
bmad-statusline
v1.6.1
Published
BMAD workflow status line integration for ccstatusline

Maintainers
 zrawday
Readme
bmad-statusline


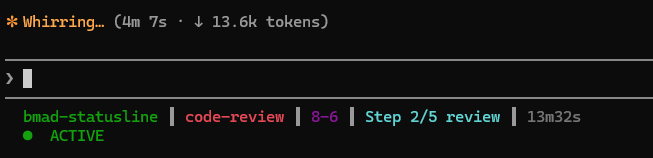
Custom widget pack for ccstatusline that adds passive BMAD activity tracking to the Claude Code status bar — automatically detects the active skill, current story, step progress, and LLM state, with zero manual action required. Includes a real-time monitor to follow all your BMAD sessions live from a separate terminal.
Note: Terminal display is powered by ccstatusline, a status line engine for Claude Code. bmad-statusline creates and injects its own custom widgets into ccstatusline. Other (non-BMAD) widgets are available directly from ccstatusline.
Status Line
Features
- Passive detection via hooks — 12 signals intercepted from the Claude Code lifecycle (prompts, reads, writes, bash, permissions, errors, session start/end…). Zero manual action required.
- Interactive TUI configurator — full visual editor to customize the display, colors, separators, and widget order
- 13 configurable widgets across 3 lines — LLM State, Project, Initial Skill, Active Skill, Story, Step, Next Step, Document, File Read, File Write/Edit, Context %, Timer, Weekly Usage
- Semantic colors — each workflow and project has its own color (cyan = dev, green = planning, yellow = product, magenta = architecture…), individually customizable
- Real-time Monitor — built-in multi-session dashboard to follow all active BMAD sessions live, with file read/write/edit history, command tracking, and auto-allow permission control (see Monitor section)
- Presets — 3 slots to save and load complete layouts
- Full workflow catalog recognition — BMAD, GDS, WDS, CIS, and TEA compatibility, with semantic colors for every known workflow
Prerequisites
- Node.js >= 20
- BMAD Framework >= 6.2.2
ccstatusline is installed automatically via npx during setup — no manual installation needed.
Installation
npx bmad-statusline installAutomatically configures:
~/.claude/settings.json— statusLine command + hook entries~/.config/ccstatusline/settings.json— BMAD widget definitions~/.config/bmad-statusline/— reader, hook, and internal configuration~/.cache/bmad-status/— runtime cache directory
TUI Configurator
npx bmad-statusline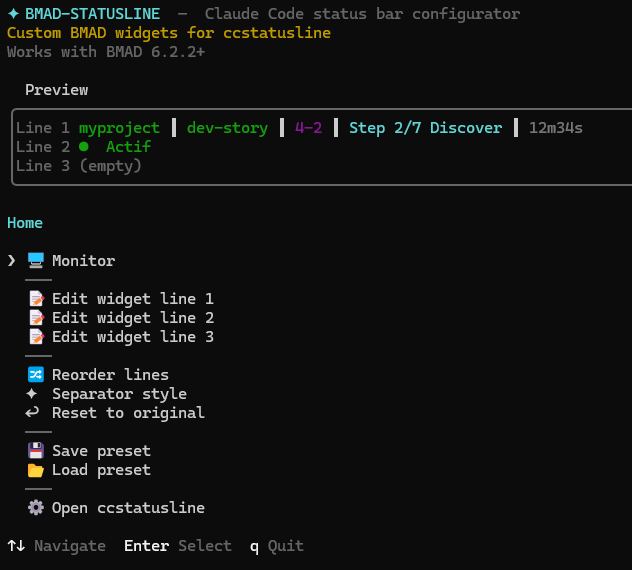
The TUI lets you fully customize the status line display without editing any files:
Edit Line
Each line (1, 2, 3) is configured individually:
- Visibility — show/hide each widget with
h - Color — cycle through 15 ANSI colors with
←/→, or switch to dynamic mode (color resolved at runtime based on the workflow/project) - Order — rearrange widgets within a line using grab mode (
g) - Display mode — toggle with
mon widgets that support it: Story (compact/full), Context % (full bar/compact), Weekly Usage (compact/extended — extended is the default on line 2 since v1.6)
Separator Style
4 separator styles between widgets:
- Tight —
project│dev-story│4/12 - Moderate —
project │ dev-story │ 4/12 - Wide —
project │ dev-story │ 4/12 - Custom — any string
Reorder Lines
Rearrange the order of the 3 lines with keyboard drag-and-drop.
Presets
3 save slots to store complete layouts (widgets, order, separators). Custom colors are preserved separately.
Weekly Usage
A dedicated dashboard screen (reachable from the TUI home menu) showing your 7-day plan usage versus the elapsed share of the week, with a pace verdict. The data is captured passively by the reader on every status line refresh and persisted to ~/.cache/bmad-status/weekly-usage.json, so the screen works even without an active session.
Monitor
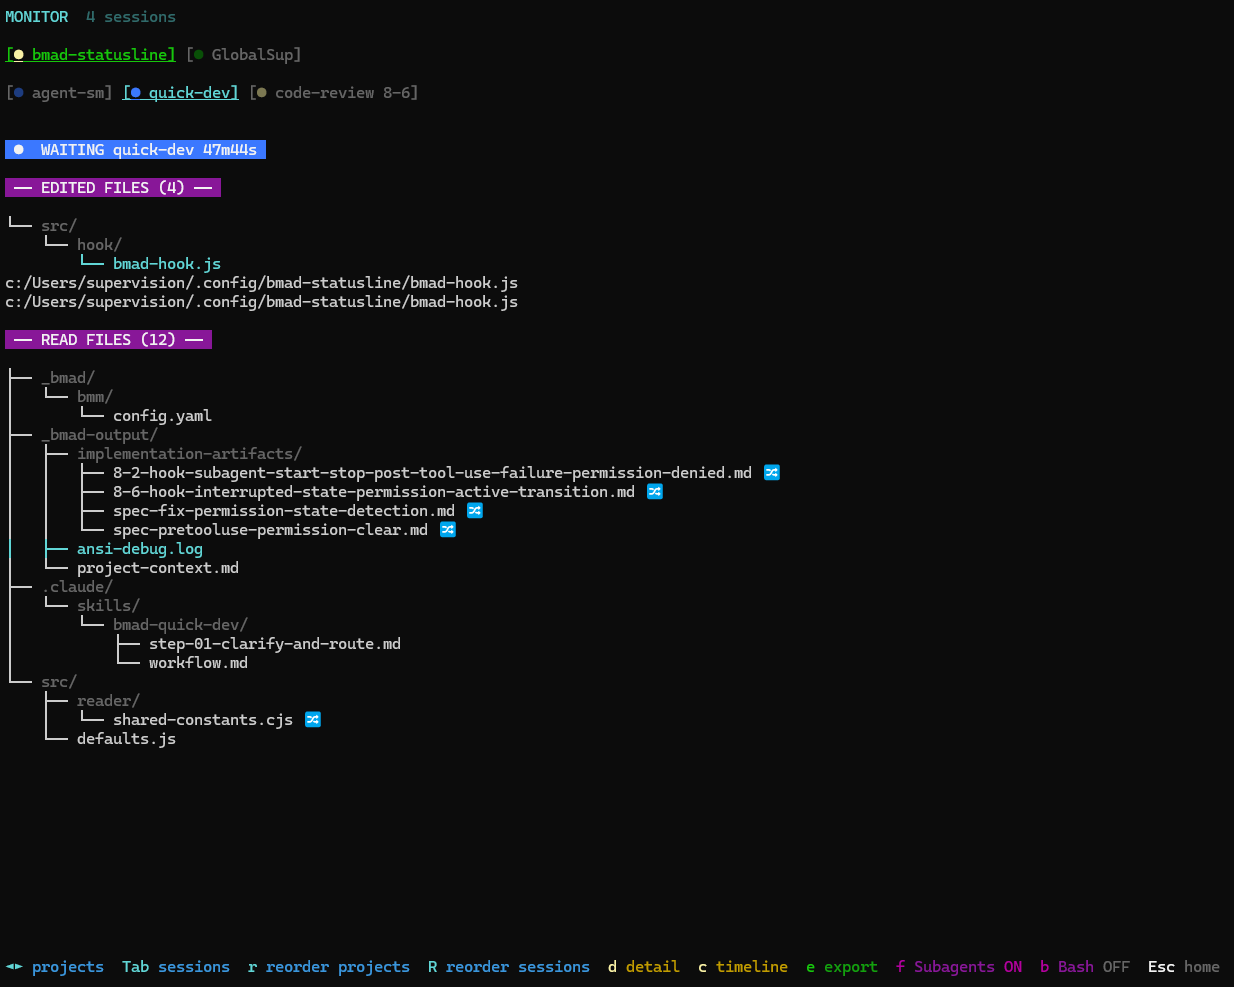
The Monitor is a real-time dashboard built into the TUI that lets you follow the activity of all active Claude Code sessions live. It is a full-featured tool in its own right, accessible from the TUI main menu.
Overview
The Monitor displays for each session:
- The active workflow and current story
- The LLM state in real time (Active, Permission, Waiting, Error, Interrupted)
- The file tree of read and edited files
- The command history of executed bash commands
- The elapsed time since the session started
Multi-Session & Multi-Project
- Up to 20 simultaneous sessions tracked in parallel
- Two-level navigation: project tabs (when multiple projects are active) + session tabs
- Each tab displays the workflow name, story number, and a colored state indicator (●)
- Smooth navigation with
←/→between sessions/projects andTabto cycle - Automatic liveness detection via Claude process PID verification
LLM Badge
Sticky banner displayed at all times with:
- State: colored indicator across 5 states
- 🟢 Active — the LLM is working
- 🟡 Permission — waiting for user confirmation
- 🔵 Waiting — idle, control returned to the user
- 🔴 Error — error detected
- 🟡 Interrupted — session interrupted
- Timer — elapsed time updated every second
- Context — workflow name + story number or document name
File Tree
- Hierarchical tree for project files (├──, └──, │)
- Flat list for out-of-project files
- Visual indicators:
*(green) — file newly created during the session- 🔀 (cyan) — file modified by a sub-agent
- The most recent file is highlighted
Bash Commands
- Deduplicated history — identical commands are grouped with a counter (
npm test (x3)) - Color-coded by family:
npm→ green,git→ yellow,node→ cyanpython/pip→ blue, file operations → dimmed, others → magenta
- Multi-line support — heredocs and long commands are displayed correctly
- The last executed command is highlighted
Detail Mode
Press d to enter detail mode with cursor navigation:
- Edited file — displays all diffs (deleted lines in red, added lines in green)
- Read file — lists all read timestamps
- Command — full execution history
Chronology
Merged timeline view of all operations (reads, writes, edits, bash commands):
- Sort — toggle between alphabetical and chronological with
s - Time format — toggle between absolute (HH:MM:SS) and relative ("5min ago") with
t - Type indicators — READ (cyan), WRITE (green), EDIT (yellow), BASH (dimmed)
Auto-Allow
Toggle automatic permission approval per-session or globally, directly from the Monitor (a key). When enabled, permission prompts are approved automatically — sessions can proceed unattended without waiting for manual confirmation.
- Per-session toggle — enable or disable auto-allow for the current session only
- Global toggle ("Always") — enable for all sessions, with per-session override capability
- Visual indicator —
Auto-allowshown in red on the monitor title line when active - Warning overlay — the menu clearly warns that tools will execute without human review
CSV Export
Export session data to CSV:
- Light — aggregated summary (type, path, count)
- Full — complete detail (type, path, operation, timestamp, content)
Commands
| Command | Description |
|---------|-------------|
| npx bmad-statusline | Launch the TUI configurator (auto-updates the deployed reader/hook when the package is newer — no reinstall needed after upgrades, v1.4+) |
| npx bmad-statusline install | Install widgets, reader, and hooks |
| npx bmad-statusline uninstall | Remove all components |
| npx bmad-statusline clean | Clean stale cache files |
| npx bmad-statusline doctor | Diagnose the status line and auto-repair a broken ccstatusline npx cache |
Doctor
If the status line goes blank while the monitor still works, run npx bmad-statusline doctor (or pick 🩺 Run health check from the TUI home screen). It verifies the deployed reader, config.json, the statusLine entry in ~/.claude/settings.json, and the registered ccstatusline widgets, then checks that npx -y ccstatusline@latest actually runs. It also compares the deployed reader/hook against the running package version and automatically re-syncs the files in ~/.config/bmad-statusline/ if they are stale. The most common cause is a corrupted npx cache (missing Windows bin shims) — doctor detects this and purges the offending ccstatusline cache entry so npx regenerates it. It never touches your settings, config, or the npm cache as a whole; for anything it can't repair it points you to npx bmad-statusline install.
How It Works
bmad-statusline relies on a 3-layer architecture:
- Hooks — intercept Claude Code lifecycle events (12 signals: UserPromptSubmit, PreToolUse, PostToolUse, PermissionRequest, PermissionDenied, PostToolUseFailure, Stop, StopFailure, SubagentStart/Stop, SessionStart/End) to passively detect the active skill, story, step progress, and LLM state
- Cache — data is stored as JSON in
~/.cache/bmad-status/(one status file + one alive file per session, plus an account-globalweekly-usage.jsonsnapshot used by the Weekly Usage widget and TUI screen) - Reader — reads the cache and produces a formatted, ANSI-colored line for ccstatusline to display
Everything is synchronous, with zero runtime dependencies (Node.js stdlib only for hook and reader), and designed to never interfere with Claude Code's operation.
Note: Due to a Claude Code limitation, the status line only refreshes when the LLM performs actions (tool calls, reads, writes…). This primarily affects the LLM State indicator and the Timer, which may appear frozen while the LLM is idle or waiting for user input.
Configuration
Configuration files are located in ~/.config/bmad-statusline/:
config.json— widget configuration, colors, separators, and presets
Two environment variables allow customizing paths:
BMAD_CACHE_DIR— cache directory (default:~/.cache/bmad-status/)BMAD_CONFIG_DIR— configuration directory (default:~/.config/bmad-statusline/)
Uninstall
npx bmad-statusline uninstallCleanly removes all components: hooks, ccstatusline widgets, reader, scripts, and cache files.