
bubble-chart-js
v2.1.3
Published
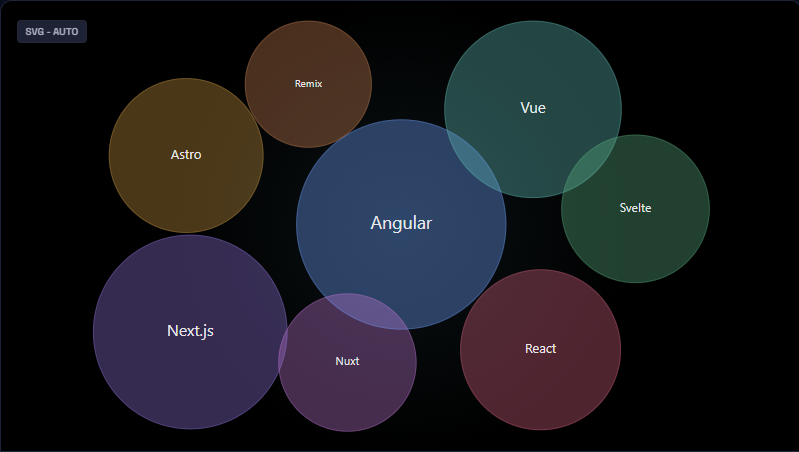
bubbleChartJs is a lightweight, customizable JavaScript library for creating stacked bubble charts. It arranges bubbles based on their values, with the largest bubble positioned at the top and surrounding bubbles decreasing in size accordingly.
Maintainers
 pragadeeshwaran-pasupathi
Readme
bubble-chart-js
A high-performance, fully configurable Bubble Chart library for high-density analytics dashboards.
Zero dependencies. Framework-agnostic. Ships as ESM, CJS, and UMD.


![]()
Demo
View the Live Interactive Demo →
Features
- Dual renderer — auto-selects Canvas (large datasets) or SVG (small datasets); override with
render.mode - Physics & static layouts — force-directed physics simulation with fully tunable parameters, or instant static placement
- Glass & flat themes — built-in visual themes with GPU-accelerated bloom and glow effects
- Per-bubble customization — individual color, opacity, label, icon, and font overrides per data item
- Live updates — call
chart.update(newData)for smooth, reconciled transitions without re-initializing - Pluggable layer hooks — inject custom draw calls into any render layer (
background,bubbles,text,overlay, …) - Event system — subscribe to
bubble:click,bubble:hover, and more with a clean pub/sub API - Angular-ready — ships full TypeScript types; integrates seamlessly into Angular, React, Vue, or vanilla JS
- Tiny footprint — zero runtime dependencies; tree-shakeable ESM build
Installation
npm install bubble-chart-jsCDN (no build step)
<script src="https://unpkg.com/bubble-chart-js/dist/bubbleChart.umd.js"></script>Quick Start
Vanilla JavaScript / TypeScript
<!-- index.html -->
<div id="chart" style="width: 800px; height: 500px;"></div>
import { initializeChart } from "bubble-chart-js";
const chart = initializeChart({
canvasContainerId: "chart",
data: [
{ id: "chrome", label: "Chrome", value: 65, bubbleColor: "#4285F4" },
{ id: "safari", label: "Safari", value: 19, bubbleColor: "#34A853" },
{ id: "firefox", label: "Firefox", value: 10, bubbleColor: "#FF6D00" },
{ id: "edge", label: "Edge", value: 6, bubbleColor: "#0078D4" },
],
layout: { type: "physics" },
render: { mode: "auto", theme: "glass" },
});
// React to bubble clicks
chart.on("bubble:click", ({ item }) => console.log("Clicked:", item.label));
// Push new data — smooth animated transition
chart.update(newData);
// Teardown (stops animation loop, removes DOM elements)
chart.destroy();Angular
// chart.component.ts
import { Component, OnDestroy, AfterViewInit } from "@angular/core";
import { initializeChart, BubbleChart } from "bubble-chart-js";

@Component({
  selector: "app-chart",
  template: `<div id="bubble-chart" style="width:100%;height:500px"></div>`,
})
export class ChartComponent implements AfterViewInit, OnDestroy {
  private chart!: BubbleChart;

  ngAfterViewInit(): void {
    this.chart = initializeChart({
      canvasContainerId: "bubble-chart",
      data: [
        { id: "revenue", label: "Revenue", value: 840, bubbleColor: "#6366f1" },
        { id: "churn", label: "Churn", value: 230, bubbleColor: "#f43f5e" },
        { id: "nps", label: "NPS", value: 510, bubbleColor: "#10b981" },
      ],
      layout: { type: "physics" },
      render: { theme: "glass" },
    });
  }

  ngOnDestroy(): void {
    this.chart.destroy();
  }
}
Browser Script Tag (UMD)
<div id="chart" style="width:800px;height:500px"></div>
<script src="https://unpkg.com/bubble-chart-js/dist/bubbleChart.umd.js"></script>
<script>
  const chart = window.initializeChart({
    canvasContainerId: "chart",
    data: [
      { label: "Alpha", value: 120, bubbleColor: "#6366f1" },
      { label: "Beta", value: 80, bubbleColor: "#f43f5e" },
      { label: "Gamma", value: 55, bubbleColor: "#10b981" },
    ],
  });
</script>
API Reference
initializeChart(config)
Creates and renders the chart. Returns a BubbleChart instance.
import { initializeChart } from "bubble-chart-js";
const chart = initializeChart(config);
BubbleChart Instance Methods
| Method | Signature | Description |
| ----------------- | ----------------------------------- | ---------------------------------------------------------- |
| update | (newData: DataItem[]) => void | Re-render with new data; animates transitions |
| on | (event, handler) => UnsubscribeFn | Subscribe to chart events (bubble:click, bubble:hover) |
| destroy | () => void | Stop animation, remove DOM nodes, clear all subscriptions |
| addLayerHook | (hook) => string | Inject a custom draw call into a named render layer |
| removeLayerHook | (id: string) => void | Remove a layer hook by ID |
| simulation | Readonly<SimulationSnapshot> | Snapshot of the last physics simulation tick |
topN(data, n) Utility
Selects the top N items by value — useful for capping high-cardinality datasets before render.
import { initializeChart, topN } from "bubble-chart-js";

initializeChart({ canvasContainerId: "chart", data: topN(rawData, 25) });
Configuration Reference
DataItem
| Property | Type | Required | Description |
| ------------- | -------- | -------- | --------------------------------------------------------------------- |
| id | string | No | Stable key for reconciliation on update(). Auto-derived if omitted. |
| label | string | Yes | Text displayed inside the bubble |
| value | number | Yes | Determines bubble radius relative to the dataset |
| bubbleColor | string | No | CSS color string for this specific bubble |
| opacity | number | No | Fill opacity 0–1. Overrides global bubbleAppearance.opacity |
| icon | string | No | Unicode codepoint or ligature string (e.g. "trending_up") |
| iconFont | string | No | Font family for the icon, e.g. "Material Symbols Outlined" |
Configuration (top-level)
| Property | Type | Default | Description |
| ---------------------------------- | ------------------- | ------------- | ------------------------------------------------------------------ |
| canvasContainerId | string | — | Required. ID of the host DOM element |
| data | DataItem[] | — | Required. Array of bubble data |
| colorPalette | string[] | built-in | Fallback color cycle for bubbles without an explicit bubbleColor |
| minRadius | number | 20 | Minimum bubble radius in pixels |
| canvasBackgroundColor | string | transparent | Canvas background fill color |
| isResizeCanvasOnWindowSizeChange | boolean | true | Auto-resize chart on window resize |
| theme | "flat" \| "glass" | "flat" | Shorthand alias for render.theme |
layout
| Property | Type | Default | Description |
| ------------------------ | ------------------------- | ----------- | ---------------------------------------------------------- |
| type | "static" \| "physics" | "static" | Layout engine selection |
| physics.seed | number | — | Seed for deterministic initial bubble placement |
| physics.centerStrength | number | 0.012 | Strength of the centering force |
| physics.collisionPad | number | 3 | Extra padding (px) added to each bubble's collision radius |
| physics.velocityDecay | number | 0.82 | Velocity decay per tick (0–1) |
| physics.alphaDecay | number | 0.0228 | Alpha decay rate per tick |
| physics.maxVelocity | number | 8 | Maximum velocity magnitude per tick |
| physics.updateBehavior | "restart" \| "momentum" | "restart" | How update() affects a running simulation |
render
| Property | Type | Default | Description |
| ---------------------------- | ----------------------------- | -------- | ----------------------------------------------------------- |
| mode | "auto" \| "svg" \| "canvas" | "auto" | Renderer selection (auto picks Canvas for >25 items) |
| theme | "flat" \| "glass" | "flat" | Visual theme |
| glassPerformanceHint | "safe" \| "full" | "safe" | full = GPU feGaussianBlur bloom; safe = CSS drop-shadow |
| glassOptions.glowIntensity | number | 0.35 | Glow intensity 0–1 (glass theme only) |
| glassOptions.blurRadius | number | 12 | Outer halo blur radius in px (full mode only) |
interaction
| Property | Type | Default | Description |
| ---------------- | --------- | ------- | ------------------------------------------ |
| hoverScale | number | 1.08 | Scale factor applied to the hovered bubble |
| hoverEase | number | 0.10 | Lerp factor for hover animation (0–1) |
| tooltipEnabled | boolean | true | Show tooltip on hover |
animation
| Property | Type | Default | Description |
| ------------------ | ----------------------- | ------- | ------------------------------------------------- |
| entryDuration | number | 25 | Entry animation duration in frames |
| transitionEasing | (t: number) => number | — | Custom easing function for position/radius tweens |
Tooltip (tooltipOptions)
Full CSS-style control over the hover tooltip. Accepts backgroundColor, fontColor, fontFamily, fontSize, padding, borderColor, boxShadow, zIndex, and more. Supply a formatter function for fully custom HTML content:
tooltipOptions: {
  backgroundColor: '#1e1e2e',
  fontColor: '#cdd6f4',
  formatter: (item) => `<strong>${item.label}</strong>: ${item.value.toLocaleString()}`,
},
Events
| Event | Payload | Description |
| -------------- | ------------------------------------------------- | ------------------------------ |
| bubble:click | { item: DataItem, event: PointerEvent } | Fired when a bubble is clicked |
| bubble:hover | { item: DataItem \| null, event: PointerEvent } | Fired on hover enter / leave |
const unsub = chart.on("bubble:click", ({ item }) => {
  console.log(`${item.label}: ${item.value}`);
});

// Stop listening
unsub();
Layer Hooks
Inject custom Canvas 2D draw calls into any render layer for complete visual control:
chart.addLayerHook({
  layer: "overlay",
  draw: ({ ctx, bubbles }) => {
    bubbles.forEach((b) => {
      ctx.strokeStyle = "rgba(255,255,255,0.4)";
      ctx.lineWidth = 2;
      ctx.beginPath();
      ctx.arc(b.x, b.y, b.r + 4, 0, Math.PI * 2);
      ctx.stroke();
    });
  },
});
Available layers: background, shadows, bubbles, text, overlay, debug.
Contributing
Contributions, bug reports, and feature requests are welcome. Please open an issue or submit a pull request on GitHub.