
bundle-intelligence
v0.1.2
Published
Analyze, understand, compare and optimize JavaScript/TypeScript bundles - dashboard, CLI and programmatic API

Maintainers
 kuldeep45
Readme
Bundle Intelligence — Angular | React | Vue | Next.js
Analyze, understand, compare and optimize JavaScript bundles.
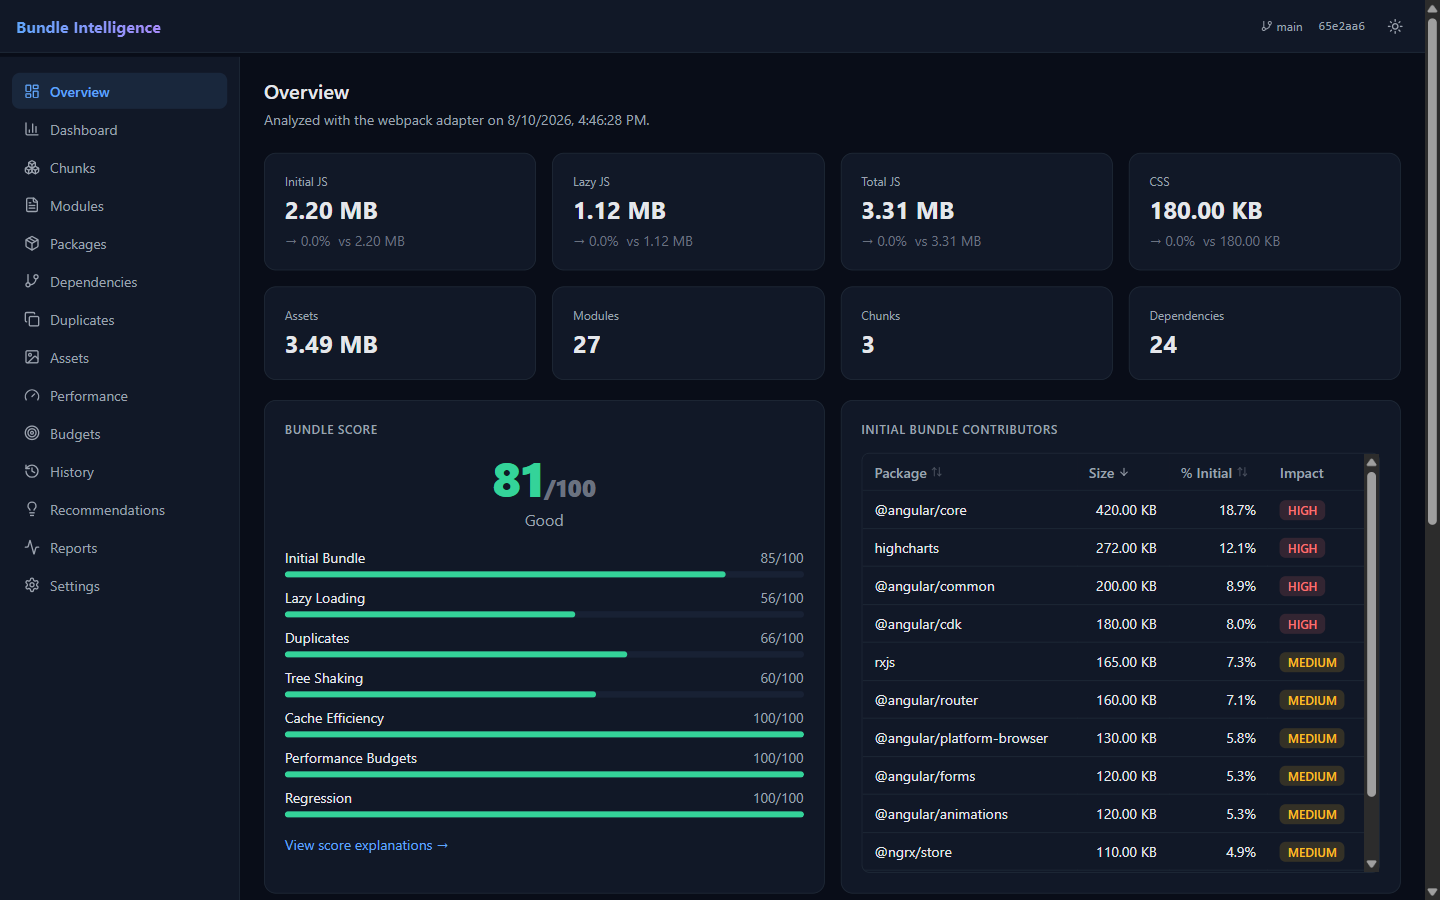
Bundle Intelligence turns raw build metadata into actionable engineering insight. It doesn't just tell you that a package is large — it tells you why it's in your bundle, whether users pay for it on first load, what changed since the last build, and what to do about it.
Highcharts

Size:            272 KB
Used by:         GlobalsService
Loaded in:       main.js
Loading:         Initial / Eager
Impact:          9.6% of initial JavaScript

Recommendation:  Move Highcharts behind a dynamic import() so it only
                 loads when the charting feature is actually used.

Potential saving: ~272 KB (estimate)
Priority:        HIGH
Try it in one command
npx bundle-intelligence serve dist/stats.json --openThat opens the interactive dashboard — a squarified treemap you can drill from bundle down to individual module, a searchable dependency graph that highlights exactly how a package got pulled in, and twelve more pages covering chunks, duplicates, budgets, history and recommendations. It runs entirely on your machine: no account, no upload, no telemetry.
Dashboard · Features · Installation · Quick start · CLI · Configuration · CI/CD · API · Security
Features
| | |
| ---------------------------- | ------------------------------------------------------------------------------------------------------------------------ |
| Initial vs lazy analysis | Determines what actually loads on first paint by walking the import graph, distinguishing static imports from import() |
| Dependency intelligence | Which package is pulled in by which module, through which path, statically or dynamically |
| Duplicate detection | Multiple versions of a package, plus libraries with overlapping functionality (lodash + lodash-es) |
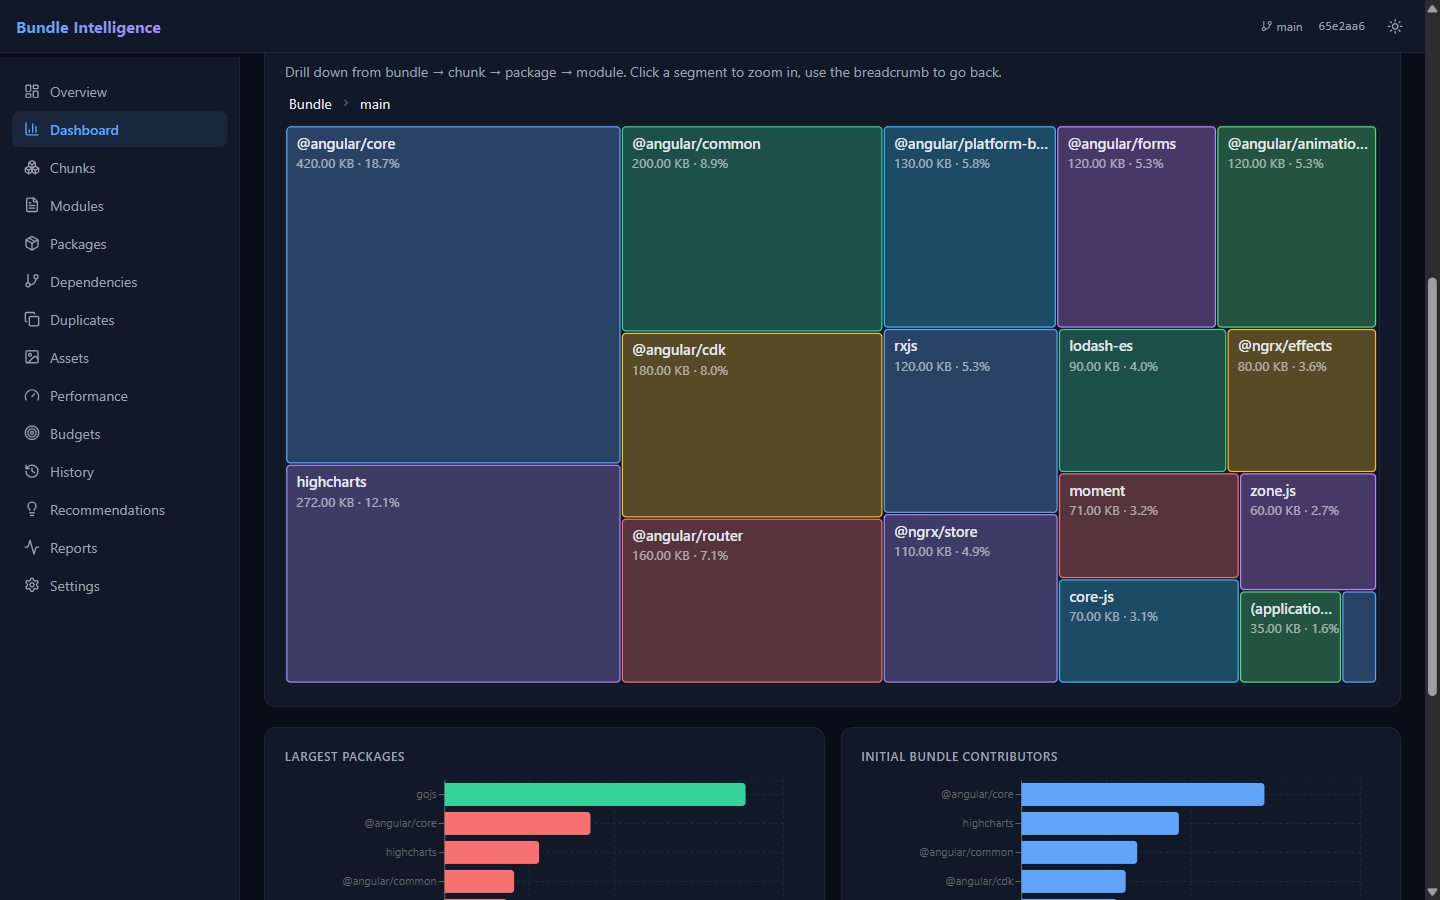
| Treemap | Squarified, drill-down treemap: bundle → chunk → package → module |
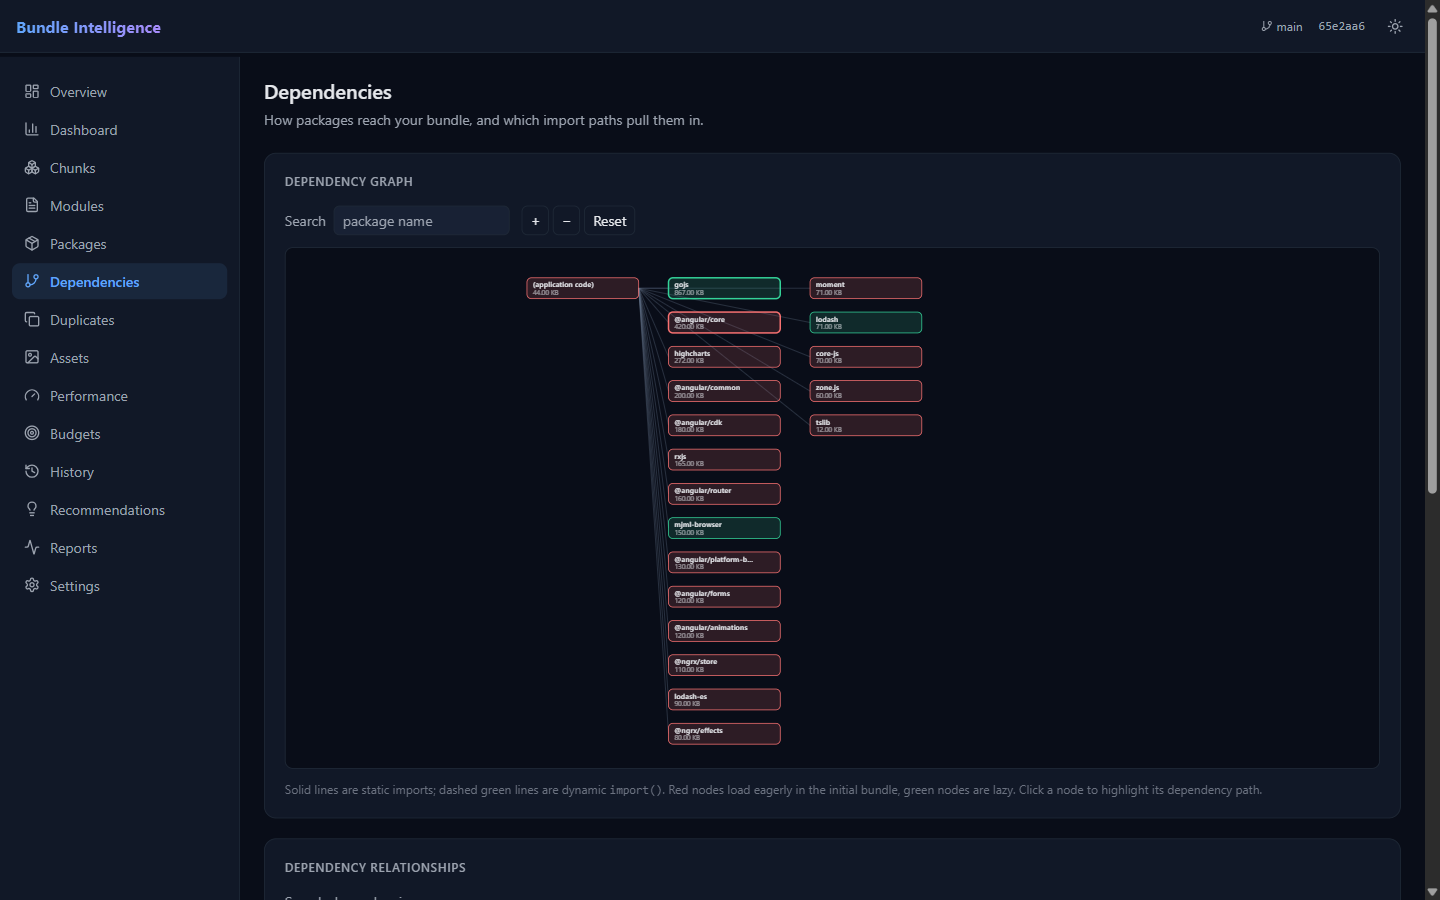
| Dependency graph | Interactive, searchable graph with zoom, pan and dependency-path highlighting |
| Regression detection | Compare any two builds; per-metric and per-package deltas |
| Performance budgets | Enforce size and regression limits in CI with meaningful exit codes |
| Bundle score | 0–100 across seven weighted, individually explained categories |
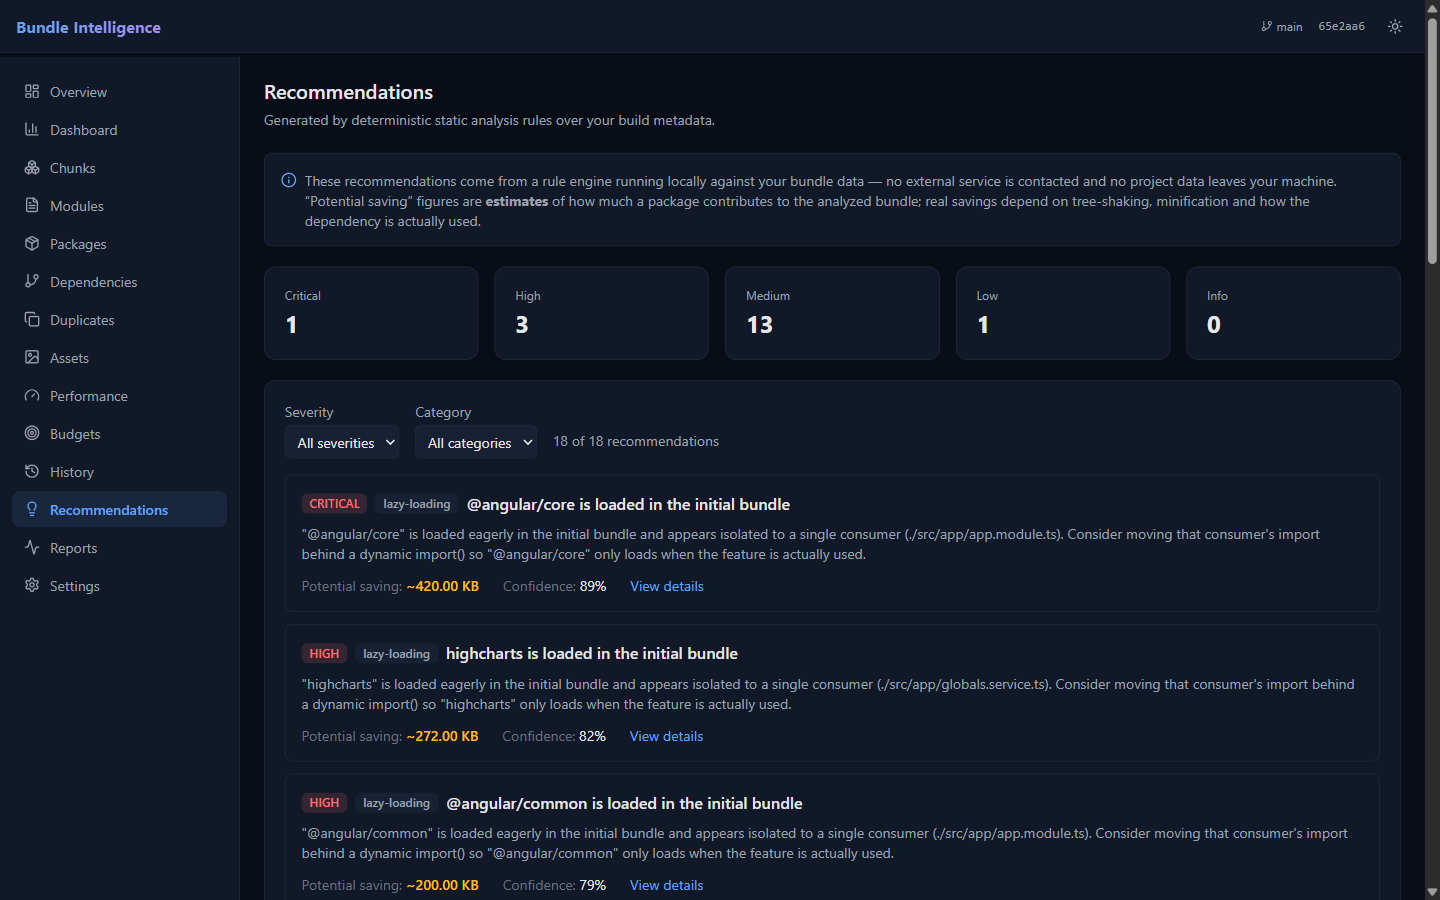
| Recommendations | Deterministic rule engine — no API key, no external service, no fake AI |
| Build history | Track bundle size across commits with git metadata |
| Cache analysis | Which build artifacts changed between builds |
| Multiple formats | HTML (offline), JSON, Markdown (PR comments), CSV, terminal |
Supported build systems
| Build tool | Input | Adapter |
| ------------- | ------------------------------------------------------- | ----------------- |
| webpack | stats.json (stats.toJson()) | webpack |
| esbuild | metafile (--metafile=meta.json) | esbuild |
| Vite / Rollup | serialized Rollup output | vite / rollup |
| Angular | webpack stats or esbuild metafile, depending on builder | angular |
Angular is an alias rather than a separate parser: the Angular CLI's webpack builder emits
standard webpack stats, and @angular/build:application emits a standard esbuild metafile.
Adding a new build system means writing one adapter — the analysis engine never changes.
Supported frameworks
Bundle Intelligence is framework-agnostic. It analyzes build metadata, not source code, so what determines support is the bundler underneath your framework — not the framework itself. If your build can emit any of the four formats above, it is supported.
| Framework | Bundler | How to produce the metadata |
| ----------------------------------------- | ------------- | ---------------------------------------------------------- |
| Angular | webpack | ng build --stats-json → dist/stats.json |
| Angular (@angular/build:application) | esbuild | ng build --stats-json → esbuild metafile |
| Vue (Vue CLI) | webpack | vue-cli-service build --report-json → dist/report.json |
| Next.js | webpack | StatsWriterPlugin in next.config.js — see below |
| Nuxt | Vite / Rollup | the Rollup plugin in Quick start |
| SvelteKit, Astro, Remix, SolidStart, Qwik | Vite / Rollup | the Rollup plugin in Quick start |
| React, Vue or Svelte scaffolded by Vite | Vite / Rollup | the Rollup plugin in Quick start |
| Anything else on webpack | webpack | webpack --json > stats.json |
| Anything else on esbuild | esbuild | esbuild --metafile=meta.json |
Next.js has no stats flag, so write the stats yourself from its webpack config:
// next.config.js
const { StatsWriterPlugin } = require('webpack-stats-plugin');

module.exports = {
  webpack(config, { isServer }) {
    if (!isServer) {
      config.plugins.push(
        new StatsWriterPlugin({ filename: '../stats.json', stats: { all: true } }),
      );
    }
    return config;
  },
};
Analyze only the client build — server chunks are never downloaded by a browser, so including them makes "initial JS" meaningless.
Turbopack, Bun and Parcel are not supported. They do not emit any of the four formats above. Support for each would mean a new adapter — see Contributing.
Installation
npm install --save-dev bundle-intelligence
# or
pnpm add -D bundle-intelligence
Requires Node.js >= 18.18.
You can also run it without installing:
npx bundle-intelligence analyze ./dist/stats.jsonQuick start
1. Produce build metadata.
webpack --json > dist/stats.jsonor in webpack.config.js, use StatsWriterPlugin, or call stats.toJson() in a build script.
esbuild src/index.ts --bundle --outdir=dist --metafile=dist/meta.jsonAdd a tiny plugin that writes the bundle description Rollup already produces:
// vite.config.js
export default {
  plugins: [
    {
      name: 'write-bundle-stats',
      generateBundle(_options, bundle) {
        this.emitFile({
          type: 'asset',
          fileName: 'rollup-stats.json',
          source: JSON.stringify({ output: Object.values(bundle) }),
        });
      },
    },
  ],
};
ng build --stats-json # webpack-based builder → dist/stats.json2. Explore it in the dashboard.
npx bundle-intelligence serve dist/stats.json --openOpens the interactive dashboard on http://localhost:4884 — treemap, dependency graph and
twelve more pages. This is where the tool earns its name; start here.
3. Or write a report to disk.
npx bundle-intelligence analyze dist/stats.json --openThat prints a terminal summary and writes a self-contained HTML report to ./bundle-report.
Unlike the dashboard, the report is static and JavaScript-free — made for emailing, archiving
and CI artifacts rather than exploring.
4. Add budgets and wire it into CI.
npx bundle-intelligence init
npx bundle-intelligence check dist/stats.json    # exit code 1 if a budget fails
CLI
bundle-intelligence <command> [options]

Commands:
  analyze <input>            Analyze a build and produce a report
  compare <base> <current>   Compare two builds and report the delta
  check <input>              Check a build against budgets (CI-friendly exit codes)
  report <input>             Generate a report without the terminal summary
  history                    List recorded build history
  serve [input]              Serve the interactive dashboard
  init                       Create a starter config file
Global options
| Flag | Description |
| ------------ | -------------------------------------------- |
| --json | Machine-readable output, no ANSI escapes |
| --quiet | Suppress non-essential output |
| --verbose | Extra diagnostic output |
| --debug | Full stack traces instead of friendly errors |
| --no-color | Disable colored output |
analyze
bundle-intelligence analyze dist/stats.json
bundle-intelligence analyze dist/stats.json --open
bundle-intelligence analyze dist/stats.json --output ./bundle-report
bundle-intelligence analyze dist/stats.json --format html|json|terminal|markdown|csv
bundle-intelligence analyze dist/stats.json --adapter webpack|esbuild|vite|angular|auto
--adapter defaults to auto, which detects the format from the file's shape.
Terminal output:
Bundle Intelligence

Project: smartech
Branch:  feature/angular-migration

────────────────────────────────────────────────────────────

Initial JS          2.84 MB   ↓ 14.0%
Lazy JS             8.21 MB   ↓ 8.0%
Total JS           11.05 MB   ↓ 12.0%
CSS               425.00 KB   ↓ 5.0%

Score: 82/100 (good)

────────────────────────────────────────────────────────────

Top Initial Contributors

 1. highcharts               272.00 KB   HIGH
 2. @angular/material        220.00 KB   HIGH
 3. rxjs                     120.00 KB   MEDIUM
 4. lodash-es                 90.00 KB   MEDIUM

────────────────────────────────────────────────────────────

Recommendations

🔴 3 High/Critical
🟡 4 Medium
🟢 8 Low

✓ Report generated: ./bundle-report/index.html
compare
bundle-intelligence compare baseline.json current.json
bundle-intelligence compare --baseline baseline.json --current current.json
bundle-intelligence compare base.json current.json --markdown   # for a PR comment
check
bundle-intelligence check dist/stats.json
bundle-intelligence check dist/stats.json --baseline baseline.json
serve
bundle-intelligence serve dist/stats.json --open --port 4884Dashboard
npx bundle-intelligence serve dist/stats.json --openMost bundle tools give you a treemap and stop there. You learn that something is big, but not whether users actually pay for it, what dragged it in, or whether it's worse than last week. The dashboard is built around those questions.
What you can't get from a treemap alone
| | |
| ---------------------------------- | ------------------------------------------------------------------------------------------------------------------------------------------------------------------------------------------------------------------ |
| Initial vs lazy, everywhere | Every page separates what loads on first paint from what's deferred behind import(). A 2 MB lazy chunk and a 2 MB eager one are not the same problem, and nothing that only shows total size can tell them apart |
| Dependency-path highlighting | Click any node in the graph and it traces the import chain that pulled it in — the answer to "why is this even in my bundle", not just "this is in my bundle" |
| Drill-down treemap | Squarified layout, navigable bundle → chunk → package → module, so you can go from "vendor chunk is huge" to the exact file without leaving the view |
| Duplicates that aren't obvious | Two versions of the same package, and separately, two different packages solving the same problem (lodash + lodash-es) |
| Budgets and history | Whether this build passes your limits, and how initial JS has moved across commits with git metadata attached |
| Explained scoring | Seven weighted categories, each showing how it was computed — not an opaque number |
Drill-down treemap
Navigate bundle → chunk → package → module. Here, one click into the main chunk shows exactly
which packages make it up, with a breadcrumb back out.
Dependency graph
Red nodes load eagerly in the initial bundle, green nodes are lazy. Solid lines are static
imports, dashed green lines are dynamic import(). Click any node to highlight the import path
that pulled it in.
Recommendations
Every finding carries evidence, a confidence score, and a clearly-labelled estimate of the saving. Produced by a local rule engine — no API key, no external service, and nothing leaves your machine.
The fourteen pages
Overview · Dashboard · Chunks · Modules · Packages · Dependencies · Duplicates · Assets · Performance · Budgets · History · Recommendations · Reports · Settings
Built to stay usable on real production bundles: tables are virtualized, so 100k modules render without freezing the browser. Dark and light themes, dark by default.
Fully offline. No CDN, no remote fonts, no account, no upload, no telemetry. Your build metadata never leaves the machine — which matters, because a stats file describes your entire source tree.
Dashboard or HTML report?
| | serve (dashboard) | analyze (HTML report) |
| ----------------------------- | ---------------------- | --------------------------------- |
| Interactive treemap and graph | Yes | No |
| Runs from a file, no server | No | Yes |
| Contains JavaScript | Yes | None at all |
| Best for | Investigating a bundle | Emailing, archiving, CI artifacts |
Use serve to find the problem; use analyze to record it.
Accessibility
Semantic tables with captions and scope, aria-sort on sortable headers, keyboard-navigable
treemap and graph nodes with descriptive aria-labels, visible focus rings, a skip link,
status regions for filter results, prefers-reduced-motion support, and deltas conveyed by
text and arrows rather than color alone.
Configuration
bundle-intelligence.config.ts (also .js, .mjs, .json, or a bundleIntelligence key in
package.json):
import { defineConfig } from 'bundle-intelligence';

export default defineConfig({
  adapter: 'auto',

  thresholds: {
    largePackage: 100 * 1024,
    largeInitialPackage: 50 * 1024,
  },

  budgets: {
    initialJs: { maxSize: '3MB' },
    totalJs: { maxSize: '12MB' },
    singleChunk: { maxSize: '2MB' },
    regression: { maxIncreasePercent: 5 },
  },

  recommendations: { enabled: true },
  git: { enabled: true },
});
TypeScript config files are transpiled with
esbuildif it is available in your project. Use.js/.mjs/.jsonif it isn't.
Bundle budgets
| Budget | Checks |
| ------------------------------- | -------------------------------------------- |
| initialJs | Total initial (eagerly loaded) JavaScript |
| totalJs | All JavaScript |
| totalCss | All CSS |
| singleChunk | The largest individual chunk |
| regression.maxIncreasePercent | Percentage growth in initial JS vs. baseline |
| regression.maxIncreaseBytes | Absolute growth in initial JS vs. baseline |
Sizes accept '3MB', '512KB', or a raw byte count.
CI/CD
bundle-intelligence check is designed for CI and is not coupled to any provider.
| Exit code | Meaning |
| --------- | ------------------------------------------------ |
| 0 | All budgets passed |
| 1 | A budget or regression check failed |
| 2 | Configuration error |
| 3 | Analyzer error (missing file, unparseable input) |
GitHub Actions
- run: npm ci && npm run build
- run: npx bundle-intelligence check dist/stats.json

# Optional: post the analysis as a PR comment
- run: npx bundle-intelligence compare base.json dist/stats.json --markdown > comment.md
- uses: peter-evans/create-or-update-comment@v4
  with:
    issue-number: ${{ github.event.pull_request.number }}
    body-path: comment.md
GitLab CI
bundle-check:
  script:
    - npm ci && npm run build
    - npx bundle-intelligence check dist/stats.json
Jenkins
sh 'npx bundle-intelligence check dist/stats.json'Programmatic API
import { analyze, compare, checkBudgets, runFullAnalysis } from 'bundle-intelligence';

const report = await analyze({ input: './dist/stats.json', adapter: 'webpack' });

const baseline = await analyze({ input: './baseline.json' });
const diff = compare(baseline, report);

const budgets = checkBudgets(report, { initialJs: { maxSize: '3MB' } });
if (budgets.status === 'fail') process.exit(1);

// Everything at once: score, duplicates, recommendations, comparison, cache
const analysis = runFullAnalysis({ report, baseline, budgets: { initialJs: { maxSize: '3MB' } } });
Also exported: detectDuplicates, computeBundleScore, generateRecommendations,
generateMarkdownReport, generatePackagesCsv, generateAssetsCsv,
analyzeCacheInvalidation, HistoryStore, validateBundleReport, parseWithAdapter,
detectAdapter, defineConfig, loadConfig, and every type in the data model.
Only what src/index.ts exports is public API. Anything else is an implementation detail and
may change in a minor release.
Report schema
Reports are versioned (schemaVersion: "1.0") and validated with Zod before any analysis runs.
interface BundleReport {
  metadata: ReportMetadata; // schema version, adapter, git info, timestamps
  assets: AssetInfo[]; // emitted files, typed, with hashes
  chunks: ChunkInfo[]; // output chunks, initial/entry flags
  modules: ModuleInfo[]; // modules with sizes and import edges
  packages: PackageInfo[]; // aggregated per npm package
  dependencies: DependencyInfo[]; // package-level import relationships
  entrypoints: EntrypointInfo[];
  metrics: BundleMetrics; // initial/lazy/total JS, CSS, counts
}
The normalized model is what makes the tool build-tool-independent: every adapter produces it, and every analysis pass consumes only it.
Recommendations
The recommendation engine is a deterministic rule engine. There is no AI provider, no API key, and nothing leaves your machine.
| Rule | Fires when |
| --------------------------- | ---------------------------------------------------------------------------------------- |
| Large initial package | A package over the threshold loads eagerly. Escalates when it's isolated to one consumer |
| Duplicate versions | Multiple resolved versions of one package |
| Overlapping implementations | Two libraries solving the same problem (lodash + lodash-es) |
| Tree shaking | A known non-tree-shakeable package with a smaller alternative |
| Regression | Initial JS grew ≥5% vs. baseline |
| Budget | A configured budget is failing |
Each recommendation carries evidence, a confidence score, and a clearly-labeled estimate of potential savings. The tool never claims an exact saving — real results depend on tree-shaking, minification, and how the dependency is actually used.
An optional RecommendationProvider interface exists for future AI-backed providers. It is
opt-in by design and not required for any core functionality.
Bundle score
A weighted average of seven categories, each explained in the UI and each individually configurable. Every threshold is a documented named constant, not a magic number.
| Category | Weight | Measures | | ---------------- | ------ | -------------------------------------------------------------- | | Initial Bundle | 25% | Initial JS against its budget | | Lazy Loading | 15% | Share of JS deferred out of the initial path | | Duplicates | 15% | Estimated duplicated bytes as a share of total JS | | Budgets | 15% | Configured budgets passing | | Tree Shaking | 10% | Heuristic proxy: presence of known non-tree-shakeable packages | | Cache Efficiency | 10% | Build artifacts unchanged vs. previous build | | Regression | 10% | Initial JS growth vs. baseline |
Categories with no data (no baseline, no budgets) score neutrally rather than penalizing you.
Git history
When run inside a git repository, each analyze records branch, commit, author, message and
timestamp alongside the metrics, under .bundle-intelligence/history.
bundle-intelligence history┌────────┬────────┬────────────────────┬──────────┬───────┐
│ Commit │ Branch │ Initial JS │ Total JS │ Score │
├────────┼────────┼────────────────────┼──────────┼───────┤
│ a31c8d │ main │ 2.61 MB │ 9.80 MB │ 84 │
│ b82a91 │ main │ 2.70 MB (+90.0 KB) │ 9.91 MB │ 82 │
│ c93de2 │ main │ 2.84 MB (+140 KB) │ 10.1 MB │ 78 │
└────────┴────────┴────────────────────┴──────────┴───────┘Git metadata is read with execFile (never a shell string) and is entirely optional — if git
isn't present or the directory isn't a repository, analysis proceeds without it. Disable with
--no-git.
Security
Bundle Intelligence processes build metadata, often inside CI. It is built to treat that input as untrusted:
- Stats files are only ever
JSON.parsed — nevereval,Function, orrequire - Every parsed report is validated against a strict schema before analysis
- All values rendered into HTML reports are escaped; reports contain no JavaScript at all
- Generated reports load no remote scripts, styles, or fonts — fully offline
- The dev server guards against path traversal and only serves the dashboard directory
- Git is invoked via
execFilewith an argument array, never through a shell - No project data is ever transmitted anywhere; no telemetry
- AI integrations are opt-in and not required for any feature
See SECURITY.md for the full model and how to report a vulnerability.
Development
pnpm install
pnpm build          # build every package
pnpm test           # 179 tests across analyzer, CLI and dashboard
pnpm lint
pnpm typecheck
pnpm format:check
pnpm coverage       # enforces 80% on core packages
Dashboard development against generated fixtures:
pnpm dev:dashboard
# then open http://localhost:5173/?fixture=webpack
Regenerate fixtures:
node fixtures/generate.mjsRepository layout
bundle-intelligence/
├── apps/dashboard/          React + Vite dashboard
├── packages/
│   ├── shared/              Normalized data model, schema, formatting, sanitization
│   ├── parsers/             Build-tool adapters (webpack, esbuild, vite/rollup)
│   ├── core/                Analysis engine: score, duplicates, budgets, comparison, rules
│   └── cli/                 CLI + programmatic API (published as `bundle-intelligence`)
├── fixtures/                Synthetic build metadata for tests and development
└── docs/                    Architecture and security documentation
Dependencies flow one way: shared ← parsers ← core ← cli. The analyzer never imports
React; the dashboard never imports the CLI.
See docs/architecture.md for the full design.
Contributing
Contributions are welcome. Please:
- Open an issue before starting significant work
- Add tests — analyzer changes need fixture-based tests
- Run
pnpm lint && pnpm typecheck && pnpm testbefore opening a PR - Follow the existing code style (enforced by ESLint and Prettier)
Adding a build-tool adapter is the most valuable contribution: implement BundleAdapter in
packages/parsers/src/<tool>/, register it, and add a fixture. No core code should change.