
calibr
v0.1.7
Published
Find the fastest safe llama.cpp model and launch configuration for your hardware.
Maintainers
 speederx
Readme
calibr
Interactive console for calibr — a
guided local-LLM recommender that measures which llama.cpp
model/configurations your hardware can actually run. It measures eval speed,
prompt speed, real VRAM, power, and the silent shared-memory paging that turns
a 47 t/s config into 10 t/s with no error message.
The CLI wraps the existing PowerShell engine and gives you a navigable console UI for guided setup/runs and for browsing the resulting winners. Recommendations are based on measured fit, speed, headroom, power, and spill behavior, not model-quality scoring. The report exposes multiple winner profiles: speed, safety-balanced, efficiency, and overall.
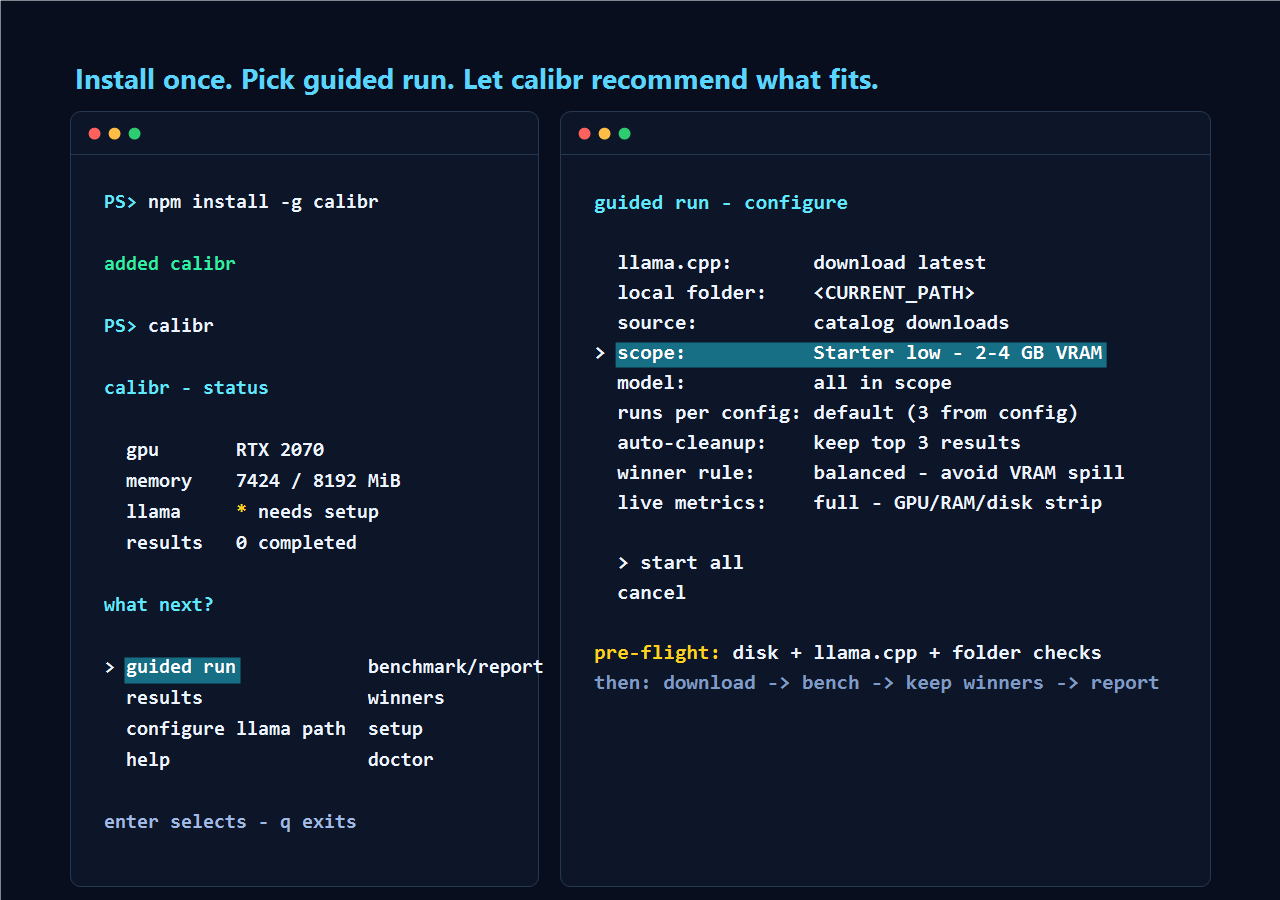

Install
npm install -g calibrThen run:
calibrYou get an interactive menu. No flags, no PowerShell prompt to copy from a README.
Requirements
- Windows 10 / 11, Linux, or experimental macOS / Metal. On Windows the engine uses Windows-only
perf counters (
Get-Counter \GPU Adapter Memory(*)\Shared Usage) to detect silent WDDM paging. On AMD/Linux,radeontopexposes the equivalent GTT spill signal; on NVIDIA/Linux, OOMs are clean and there is no silent spill to detect. On macOS, memory is unified and Metal support is experimental. - PowerShell: Windows PowerShell 5.1 (ships with Windows) on Windows, or
PowerShell Core (
pwsh) on Linux/macOS — the CLI spawnspwshthere. - Node.js 18 or newer.
- A working llama.cpp build with
llama-server(.exeon Windows).guided runandinitcan auto-fetch an official llama.cpp release when it is missing; use configure llama path only for custom builds or offline setups. - An NVIDIA GPU for the headline use case. CPU-only and other backends
bench fine, but the WDDM-paging heuristic is NVIDIA + Windows shaped. On
AMD Linux, install
radeontop+mesa-utilsfor VRAM + utilization metrics (else temperature-only). On ROCm-class AMD GPUs,amd-smiis used when present for richer live metrics.
Linux dependencies
pwsh is required on Linux. The npm package installs the Node CLI, but the
engine still runs through PowerShell Core.
| Dependency | Required? | Used for | Typical package |
|---|---:|---|---|
| pwsh | yes | run calibr.ps1 from the CLI | powershell (see PowerShell install docs) |
| llama-server | yes, auto/manual | llama.cpp inference backend | auto-fetched llama.cpp release or custom build |
| tar | yes for auto-fetch on Linux | extract official .tar.gz llama.cpp archives | usually preinstalled |
| bash, chmod | yes for install / launchers | ~/.local/bin/calibr wrapper and .sh launchers | usually preinstalled |
| xdg-open | optional | open the HTML report from the CLI | xdg-utils |
| lspci | optional | GPU-name fallback | pciutils |
| nvidia-smi | optional, NVIDIA | NVIDIA VRAM / power / temp / utilization metrics | NVIDIA driver |
| amd-smi | optional, AMD dedicated | ROCm-class AMD VRAM / power / temp / utilization metrics | ROCm / amd-smi |
| radeontop | optional, AMD | AMD VRAM-used / utilization / GTT spill metrics | radeontop |
| glxinfo | optional, AMD | AMD VRAM-total detection | mesa-utils |
For AMD/Vulkan troubleshooting, vulkaninfo from vulkan-tools is the quick
way to check whether Vulkan sees real hardware or only llvmpipe.
macOS / Metal dependencies
This path is experimental. Install Node.js 18+, npm, PowerShell Core (pwsh),
and use a local llama.cpp build with llama-server plus the Metal backend.
doctor detects Apple GPUs via system_profiler, CPU/RAM via
sysctl/vm_stat, and reports unified memory separately from desktop VRAM.
Quickstart
$ calibr
calibr - status

> guided run              download, bench, report
  results                 browse winners
  configure llama path *  set llama-server
  help                    doctor and fixes
A typical first session:
- configure llama path if you already know the exact custom build you want.
Otherwise skip it: if
llama_server_exeis missing, guided run asks whether to download official llama.cpp (latest, or a typedbNNNNbuild) or scan existing localllama-serverbinaries. One local binary is selected automatically; multiple binaries open a picker. Typed build tags are saved as the preferred auto-fetch build, and configure llama path can reuse or delete cached auto-fetched builds. - guided run -> configure: leave
source: catalog downloads, start with the default starterlowscope, choose the llama.cpp setup when prompted, and leaveauto-cleanup: yes. The CLI shows the peak disk requirement and free space before it downloads catalog models. After you accept, the engine downloads each model, benches it, cleans it up, and moves to the next. Switchauto-cleanuptokeep all,keep top 3, orkeep top 1when you want downloaded models to survive in the model folder. - results - browse measured winners per model. Press
enterto drill into per-config detail,oto open the full HTML report in your browser,rto re-run the selected config with-Force, orqto go back.
Once the starter run works, repeat guided run and switch scope to
middle, high, ultra, or all for a broader recommendation set. The
model field can narrow any scope to one model from that scope.
For sub-tasks (re-bench one model, change run count):
- Prefer repeating guided run and changing the visible fields.
local
folder
defaults to<CURRENT_PATH>, the folder where you launchedcalibr; change it to your local model directory, then setsource: local folderto bench existing.gguffiles there. When you save a folder, calibr offers to create it if missing and reports how many.ggufmodels it found. In local-folder mode,modelcycles through those local models. Those files are user-owned and are never deleted by cleanup. Guided-run field choices stay in memory while thiscalibrsession is open; restartingcalibrreturns non-config fields to defaults.
Privacy and model licenses
Benchmark data stays in the platform user-data directory and is not uploaded. The optional catalog download step fetches GGUF files from upstream model repositories; those files keep their original licenses and terms.
Where things are stored
After npm install -g calibr, the engine + defaults sit inside the
installed package. Your own data goes to %LOCALAPPDATA%\calibr\ on Windows,
or $XDG_DATA_HOME/calibr (default ~/.local/share/calibr) on Linux:
calibr-data/
├── config.json          your overrides
├── catalog.json         models discovered on disk
├── plan.json            test plan expanded from catalog
├── downloads.json       legacy manifest of calibr-downloaded .gguf files
├── llama-bin/           auto-fetched llama.cpp builds
├── results/*.json       one file per bench config
├── logs/*.log           full llama-server stderr per config
├── logs/action-trace.log human-readable user/engine action trace
├── logs/action-trace.jsonl machine-readable action trace
├── bats/*.bat           per-config launch scripts (*.sh on Linux)
└── report.html          aggregated dashboard
If you run from a checkout of the
main repo, data lives under
<repo>/data/ instead — the CLI auto-detects which mode you are in by
looking for calibr.ps1 walking up from itself.
To override either path:
$env:CALIBR_DATA_DIR = "D:\calibr-data"
$env:CALIBR_CONFIG = "D:\calibr-data\config.json"
calibr
The model folder is separate from this app-data folder. It is the directory
you choose in guided run for local .gguf files and kept catalog downloads.
Its default is <CURRENT_PATH>.
Commands
The main menu is product-facing. Guided run is the normal path: setup, model selection, benchmark, cleanup, report.
Legacy / Deprecated Advanced Commands
The individual engine verbs still exist for development and debugging, but they are no longer promoted in the main menu. Prefer guided run unless you are diagnosing the engine directly:
| Verb | What it does |
|---|---|
| init | Detect hardware, auto-fetch llama.cpp if requested, write config.json with sane defaults. |
| discover | Scan scan_paths for *.gguf, build the model catalog. |
| plan | Expand the catalog into bench configurations, sweeping the right dimension per model (context / MoE-cpu / offload). |
| bench | Run each pending plan entry, write a result JSON per config. Download retention is controlled by -DownloadRetention cleanup|keep-all|keep-top-3|keep-top-1; -KeepDownloads is deprecated. |
| report | Build the HTML dashboard and per-config .bat launchers. |
| all | discover → plan → bench → report, end to end. With catalog: on, fetches the curated set first; with auto-fetch on, downloads llama.cpp when setup is incomplete. |
| status | Print current config + counts (also shown as a card in the menu). |
| doctor | Sanity-check the system: CPU/GPU/OS + every dependency, each with a status (ok/warn/fail/missing/skipped) and the exact fix. -Export writes a redacted JSON bundle to attach to an issue; -Extended keeps full logs. In the TUI it lives under help → doctor with navigable rows. |
Status keybinds
↑/↓— moveenter— select / drillq/esc— back / quito(results screen) — openreport.htmlin your default browserq/esc(run screen) — cancel an in-flight bench
Known limitations
- Quality scoring is not implemented yet. calibr recommends by measured fit, throughput, headroom, and spill behavior. Use the report to choose between close winners by task quality.
- Spill detection depends on platform/tooling. Windows/NVIDIA uses WDDM
shared-memory counters. AMD/Linux uses GTT from
radeontopwhen installed. NVIDIA/Linux usually fails cleanly at OOM, so there is no silent spill signal to detect. macOS/Metal is experimental and has unified memory, not a separate WDDM/GTT-style spill counter. discoverpairs mmproj by directory. If two model variants live in the same folder and physically share onemmproj-*.gguffile but the projector is only valid for one of them (different visionn_embd), bench will fail at load on the other. The curated samples set keeps Gemma 4 E2B and E4B in separate folders for this reason; for your own models, keep each multimodal variant in its own subfolder.discovernow emits aWARNINGwhenever it sees one mmproj paired with multiple distinct text models.- No re-run-single-config from the results screen yet. Use the
bench screen with a tight
-Modelfilter and-Forceinstead.
Links
- Main repo, engine source, contributor docs: https://github.com/SpeederX/calibr
- Issues: https://github.com/SpeederX/calibr/issues
Development
cd cli
npm install
npm run dev          # tsx watch-free, attaches to your TTY
npm run build        # tsc -> dist/
npm test             # install smoke test: npm pack -> install in tempdir -> assert
The npm test command exercises the full publish path: it runs
npm pack (which copies calibr.ps1 and engine/*.ps1 into the package via
the prepack script), installs the tarball into a clean temp dir, and asserts the
bundled engine resolves to the right paths and readStatus() loads
the bundled default config. Anything that breaks packaging fails the
smoke test before it can ship.
Release
Maintainer flow:
- Bump
cli/package.jsonandcli/package-lock.json, then create a matching tag (vX.Y.Z).npm version <patch|minor|major>does both when the working tree is clean; if the release commit already contains the bump, create the tag manually. git push --follow-tags origin <branch>- push the branch and the tag.- GitHub Actions runs
.github/workflows/release.ymlon the tag. It re-runs the smoke test and then publishes to npm through trusted publishing (OIDC). npm generates provenance automatically for the public package.
Requires npm package settings to trust this GitHub repository and the exact
workflow filename release.yml under Package settings -> Trusted
publishing. No NPM_TOKEN repository secret is needed for publish.
Plain commits to any branch run .github/workflows/ci.yml only
(build + smoke test on Windows and Ubuntu). They do not publish.
License
MIT — see LICENSE.