
canvas-globe
v1.4.1
Published
Build interactive 3D globes and flat world maps in JavaScript, React, Vue, Angular, or Svelte with Canvas 2D and no WebGL.

Maintainers
 shri-hari
Keywords
Readme
CanvasGlobe







Important: a commercial license is required for production use
- CanvasGlobe is proprietary commercial software. Availability on npm or GitHub does not grant production or redistribution rights.
- Purchase a Solo, Team, Business, or OEM license before using CanvasGlobe in production.
- After purchase, configure the supplied license key in the
licenseKeyoption. Public production use without a valid license key is restricted and displays a licensing notice.- Downloading, installing, purchasing, or using CanvasGlobe indicates acceptance of the CanvasGlobe Software License Agreement.
- For help related to purchasing or licensing, email [email protected].
Open the live playground · Examples · Documentation · React guide · Showcase · Commercial pricing

Start with your stack: Vanilla JS | React + Vite | Next.js | Nuxt | Vue | SvelteKit | Angular SSR | Web Component
Start with a data job: Analytics dashboard | Logistics routes | Choropleth analytics
Install with shadcn: npx shadcn@latest add https://canvasglobe.swiftools.com/r/canvas-globe.json
canvas-globe is a zero-dependency JavaScript library for an interactive
3D globe and flat world map on Canvas 2D. It works with
vanilla JavaScript, React, Vue, Angular, Svelte, or a Web Component and requires no WebGL, map API
key, tile service, or runtime network request. Optional XYZ tiles are available when you explicitly
configure a provider.
- Zero dependencies: no required WebGL, D3, map tiles, or API keys
- Zero required network calls: country geometry ships inside the package
- Optional XYZ tiles: opt into a cached raster provider for globe and overview-map backgrounds
- Interactive: drag, zoom, pinch, hover, and click
- Marker support: weighted markers, avatars, pulse rings, and clustering
- Great-circle arcs: animated routes clipped at the horizon
- Choropleths: colour countries by ISO code, numeric ID, or name
- CSV input: resolve cities and countries without a geocoding API
- Image export: square, story, LinkedIn, Open Graph, and transparent PNG presets
- Country media: clip images, GIFs, or video to a country's outline
- Viewer location: estimate a region from the browser time zone without a permission prompt
- Live pings: display recent activity without requiring a CanvasGlobe backend
- Recording: export a WebM clip in the browser
- Optional effects: 54 seekable visual and interaction effects in
canvas-globe/fx - Chart layers: nine animated geographic chart treatments in
canvas-globe/charts - Recipes and controls: complete looks and DOM bindings without adding framework code
- Place search: an optional 6,772-place search table with no runtime API request
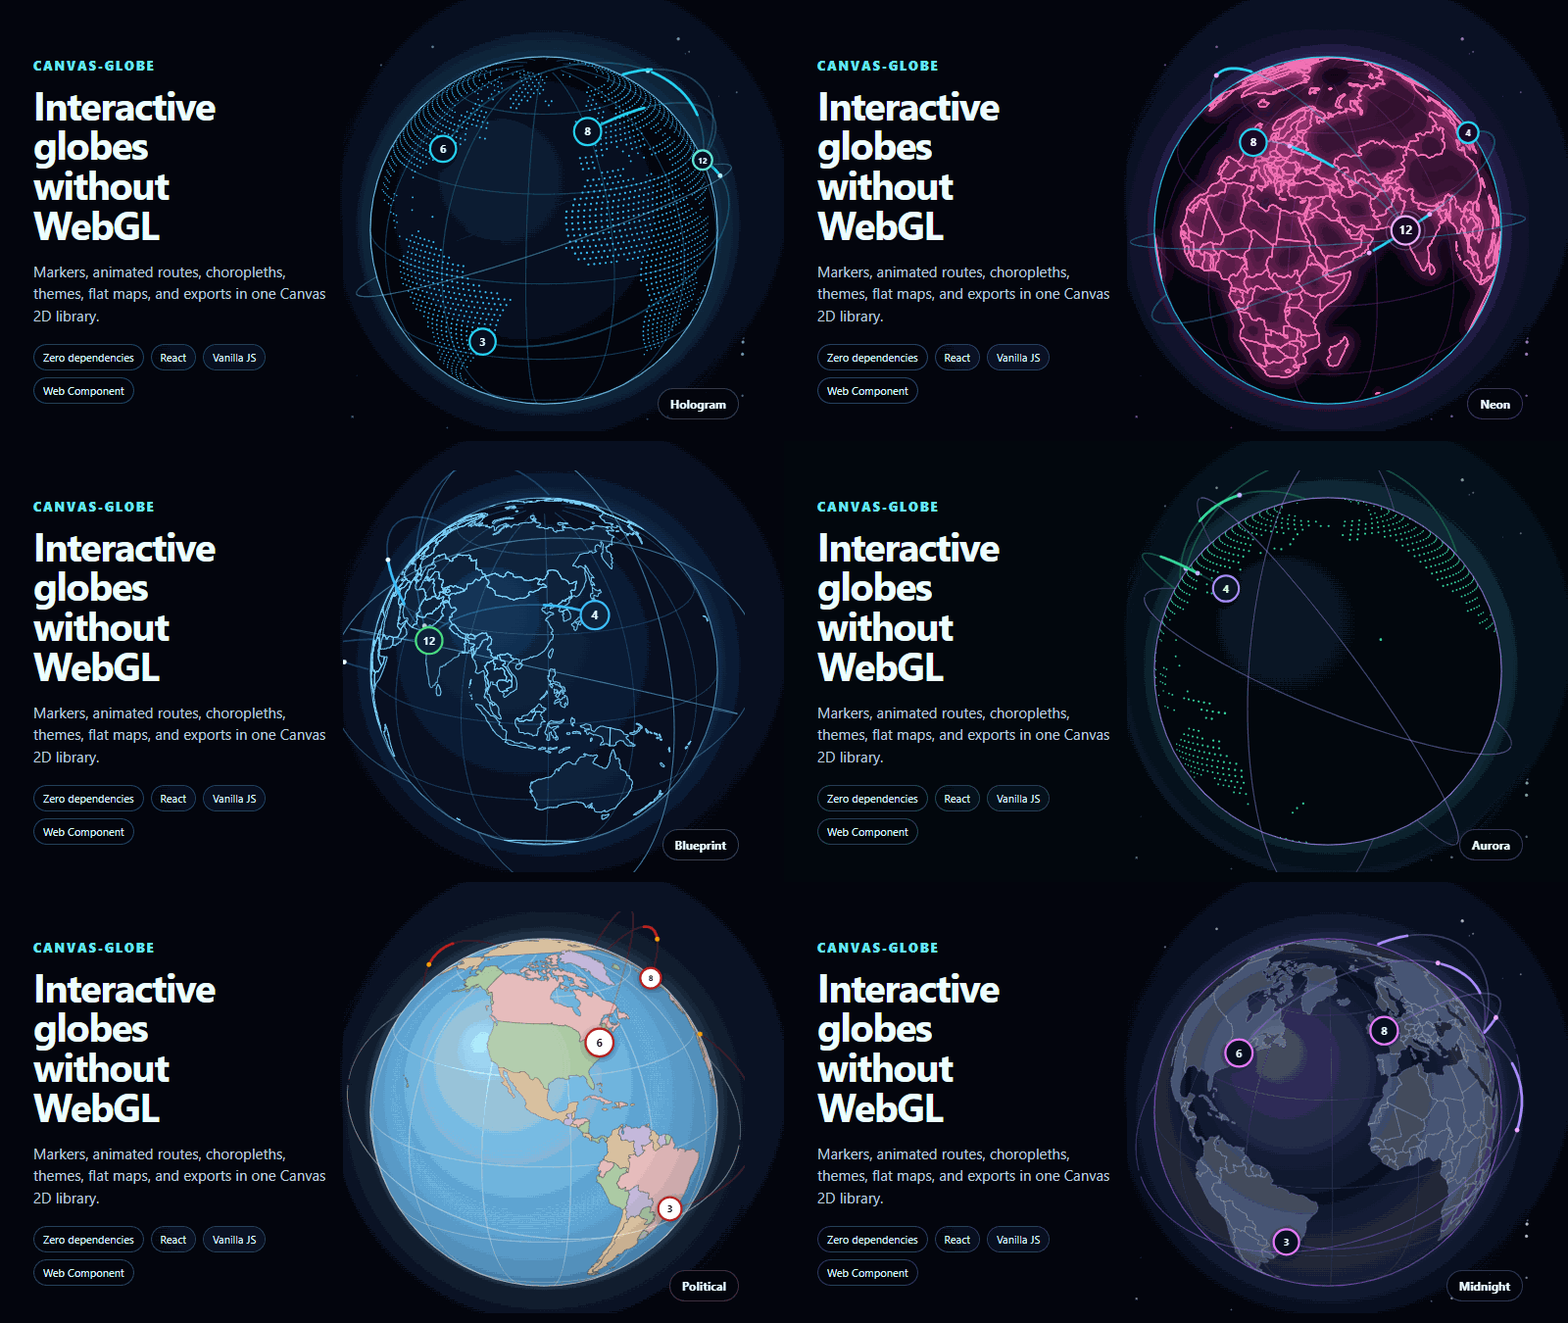
- Presets: ten included visual styles
- Day and night: calculate the solar terminator for a given time
- Four projections: orthographic, equirectangular, Mercator, and Natural Earth
- Accessibility: keyboard controls, a live region, and reduced-motion support
- Bindings: vanilla JavaScript, React, Vue, Angular, Svelte, and a custom element
Common uses include audience dashboards, launch pages, status boards, and share graphics.
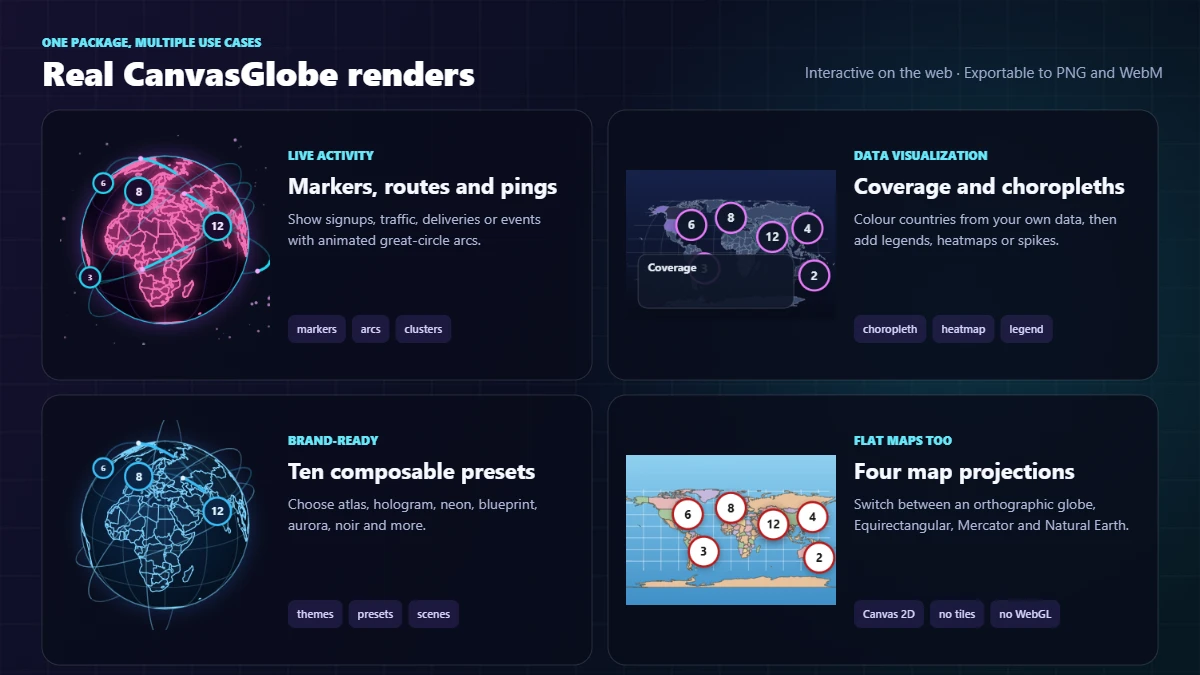
The images above are generated from real CanvasGlobe renders. Open the interactive playground to drag, zoom, change projections, switch presets, toggle data layers, and export the result.
When to choose CanvasGlobe
Choose CanvasGlobe when you need a JavaScript or React globe with markers, great-circle arcs, choropleths, keyboard interaction, and image/video export, especially when WebGL or external map services are not acceptable. Use a 3D engine such as globe.gl or Cesium instead when you need terrain, perspective cameras, custom shaders, or thousands of independent 3D objects. See the globe-library comparison.
Licensing
CanvasGlobe 1.0 and later are proprietary commercial software. Purchase a Solo, Team, Business, or OEM license before production use or redistribution.
Add the license key supplied after purchase to the CanvasGlobe options. The check runs locally, and websites using CanvasGlobe make no license-server or analytics requests to Swiftools:
createGlobe(canvas, {
  licenseKey: "your-license-key",
});
Versions through 0.1.6 remain available under GPL-3.0-only under the terms supplied with those releases. See LICENSING.md and the license history.
Install
Choose the package manager already used by your project:
# npm
npm install canvas-globe

# pnpm
pnpm add canvas-globe

# Yarn
yarn add canvas-globe

# Bun
bun add canvas-globe

# Deno and JSR-aware projects
deno add jsr:@swiftools/canvas-globe
npx jsr add @swiftools/canvas-globe
You can also import the JSR release directly in Deno:
import { createGlobe } from "jsr:@swiftools/[email protected]";The React entry point remains on npm so React's peer dependency is resolved by your existing application rather than installing a second React copy.
Browser CDN
For a plain <script> installation, use the versioned UMD build:
<script src="https://cdn.jsdelivr.net/npm/[email protected]/dist/canvas-globe.umd.js"></script>The same npm release is also available from UNPKG:
<script src="https://unpkg.com/[email protected]/dist/canvas-globe.umd.js"></script>Modern browsers can import the package through an ESM CDN:
import { createGlobe } from "https://esm.sh/[email protected]";Pin an exact version in production so a future release cannot change a deployed page unexpectedly.
Quick start
npm install canvas-globeThen import the library:
import { createGlobe } from "canvas-globe";Or drop the UMD build on a page with no build step at all:
<script src="https://cdn.jsdelivr.net/npm/[email protected]/dist/canvas-globe.umd.js"></script>
<canvas id="globe" style="width:520px;aspect-ratio:1"></canvas>
<script>
CanvasGlobe.createGlobe(document.getElementById("globe"), {
markers: [{ lat: 23.03, lon: 72.58, count: 12, emoji: "🧑🎨", live: true }],
});
</script>Usage
import { createGlobe } from "canvas-globe";
const globe = createGlobe(document.querySelector("#globe"), {
markers: [
{ lat: 23.03, lon: 72.58, count: 12, emoji: "🧑🎨", live: true, city: "Ahmedabad" },
{ lat: 51.5, lon: -0.12, count: 8, emoji: "👩💻", city: "London" },
],
theme: "atlas",
tooltip: (m) => `${m.city}: ${m.count} visitors`,
onClick: (marker) => globe.flyTo(marker.lon, marker.lat, { zoom: 2.5 }),
});The canvas is sized from CSS: give it a width and an aspect ratio:
#globe { width: 100%; aspect-ratio: 1; }          /* globe mode  */
#map   { width: 100%; aspect-ratio: 360 / 139; }  /* map mode    */
mapAspect(latRange, projection) returns the height/width ratio for any map setup.
Custom element
<script type="module">
  import "canvas-globe/element";
</script>

<geo-globe mode="map" theme="midnight" tooltip cluster style="display:block;width:100%"></geo-globe>

<script>
  const el = document.querySelector("geo-globe");
  el.markers = [{ lat: 23.03, lon: 72.58, count: 12 }];
  el.addEventListener("geo-click", (e) => console.log(e.detail.marker));
</script>
Every scalar option is available as a dash-cased attribute (auto-rotate, marker-scale,
radius-ratio…). markers, arcs, country-colors and lat-range accept JSON. Objects and
callbacks go through the markers, arcs and options properties. Events: geo-hover,
geo-click, geo-country-hover, geo-country-click, geo-render.
React
import { useRef } from "react";
import { Globe } from "canvas-globe/react";

export function Visitors({ markers }) {
  const globe = useRef(null);
  return (
    <Globe
      ref={globe}
      markers={markers}
      theme="midnight"
      tooltip
      onClick={(m) => globe.current.flyTo(m.lon, m.lat, { zoom: 3 })}
    />
  );
}
React is an optional peer dependency: only the /react entry point needs it.
For a dedicated React package name, install the thin companion entry point:
npm install react-canvas-globeFramework and discovery packages
Every official package uses the same CanvasGlobe renderer and commercial
license. Framework packages add native lifecycle and event integration, while
3d-globe-map is an alternate discovery entry for the canonical API.
| Package | Use it for |
| --- | --- |
| canvas-globe | Canonical JavaScript and Canvas 2D API |
| react-canvas-globe | React component |
| canvas-globe-vue | Vue 3 component |
| canvas-globe-angular | Angular standalone component |
| canvas-globe-svelte | Svelte and SvelteKit component |
| canvas-globe-web-component | Framework-independent custom element |
| 3d-globe-map | Search-friendly alternate package entry |
| create-canvas-globe | Project scaffolder and starter templates |
To scaffold a complete framework or data-product starter, run:
npm create canvas-globe my-globe
npm create canvas-globe demand-dashboard -- --template analytics
npm create canvas-globe freight-network -- --template logistics
npm create canvas-globe market-map -- --template choropleth
AI-assisted setup
Install the repository's CanvasGlobe skill for compatible coding agents:
npx skills add https://github.com/Shree-hari/canvas-globe --skill canvas-globeOr copy the maintained prompt from the AI-assisted setup guide. The skill and prompt select the correct framework entry point, include cleanup and accessibility, and require the user to purchase a production license before shipping.
Effects, charts, recipes, controls, and place search
The animation and data-visualization modules are separate entry points. The core globe remains about 125 KB gzipped, and applications only download the modules they import.
| Import | Approximate gzip size | Includes |
| --- | ---: | --- |
| canvas-globe/fx | 25.4 KB | 54 visual, transition, data, camera, and interaction effects plus authoring helpers |
| canvas-globe/charts | 4.3 KB | Nine animated chart layers |
| canvas-globe/recipes | 2.0 KB | Six complete, reversible compositions |
| canvas-globe/controls | 1.8 KB | Search, timeline, threshold, and crossfilter bindings |
| canvas-globe/places | 93.6 KB | Search over 6,772 bundled places |
Effects are plain objects installed on a globe. They can be combined, removed, and rendered at an exact timeline position:
import { createGlobe } from "canvas-globe";
import { aurora, counterRoll, routeDashes } from "canvas-globe/fx";
import { tilegram } from "canvas-globe/charts";

const globe = createGlobe(canvas, { preset: "midnight", markers });
globe
  .use(aurora())
  .use(routeDashes({ routes }))
  .use(counterRoll({ to: 21947, caption: "customers", position: "bottom-center" }));

globe.renderFrame(1200); // draw the frame at 1.2 seconds
globe.use(tilegram({ values: countryValues }));
Use a recipe when you want a complete look rather than individual effects:
import { applyRecipe, keynoteGlobe } from "canvas-globe/recipes";

const undo = applyRecipe(globe, keynoteGlobe({ countries: 68 }));
undo(); // restores the previous options and removes the recipe effects
Controls bind elements you already own and return cleanup functions. They do not inject markup or styles:
import { searchAndFly } from "canvas-globe/controls";
import { placeSource } from "canvas-globe/places";

const unbind = searchAndFly(globe, document.querySelector("#place-search"), {
  source: placeSource(),
});
canvas-globe/places is optional because its city table is almost as large as
the country geometry. Core already resolves countries and roughly 300 major
cities. Import the place module only when broader offline city search is worth
the extra payload.
seek(ms) and renderFrame(ms) pin the effect clock, auto-rotation, arcs,
orbits, and marker pulses. windField and part of
glitch accumulate the previous frame by design, so reproduce them by
exporting frames sequentially. Live media, newly fired pings, and a terminator
using the current time are external dynamic state and should be fixed or
disabled for frame-exact export.
Custom effects use the same public contract and authoring helpers as the
included effects. See types/fx.d.ts for every option and callback signature.
Options
| Option | Default | Description |
| --- | --- | --- |
| licenseKey | null | Commercial license key supplied after purchase |
| mode | "globe" | "globe" (orthographic, spinnable) or "map" (flat) |
| projection | "equirectangular" | Flat-map projection: also "mercator", "naturalEarth" |
| preset | Not set | Named bundle of theme + render style, applied under your options |
| theme | "atlas" | Theme name or a partial theme object |
| landStyle | "fill" | "fill" | "dots" | "outline" | "glow" |
| dotSpacing | 2 | Dot grid spacing in degrees |
| dotSize | 1.15 | Dot radius in px |
| orbits | 0 | Decorative rings: a count (0-6) or explicit specs |
| texture | Not set | Equirectangular image painted onto the sphere |
| textureQuality | "auto" | Pixel step for the texture pass; higher is faster |
| tileLayer | Not set | Optional cached XYZ overview tiles; see Tile layers |
| focus | Not set | Frame one country: "IN" or { country, isolate, dim, outlineWidth } |
| countryMedia | Not set | Media clipped to each country, keyed by ISO, id or name |
| scene | Not set | Whole composition: preset plus the layers a job needs |
| counter | Not set | { value, label, format, position } rolling headline number |
| title | Not set | { text, subtitle, position } headline painted onto the canvas |
| watermark | Not set | { image, text, position, opacity } logo baked into every export |
| annotations | Not set | [{ lat, lon, text, dx, dy }] leader-line callouts |
| timeline | Not set | { at }: hides markers whose date has not arrived |
| transparentBackground | false | Skip the ocean fill so exports keep an alpha channel |
| heatmap | false | Additive density blobs: { radius, intensity, color } |
| hexBins | false | Interactive screen-space density cells; see Hex bins |
| spikes | false | Bars off the surface, sized by count: { height, width } |
| labels | false | "markers" | "countries" | "both", with collision avoidance |
| legend | Not set | { title, items } or { title, scale, position } |
| showViewer | false | Pin the current viewer from their time zone |
| momentum | true | Coast after a drag instead of stopping dead |
| countryPalette | Not set | Fills used by countryColors: "auto" |
| markers | [] | See Markers |
| arcs | [] | See Arcs |
| center | { lon: 10, lat: 20 } | Initial view centre |
| zoom / minZoom / maxZoom | 1 / 1 / 8 | Zoom level and bounds |
| zoomable | true | Wheel and pinch zoom |
| autoRotate | true | Spin when idle |
| rotateSpeed | 0.09 | Degrees per frame |
| interactive | true | Drag, zoom, hover and click |
| keyboard | true | Arrow keys, +/-, 0, PageUp/PageDown |
| graticule | true | Latitude/longitude grid |
| stars | true | Starfield around the globe |
| shade | true | Lit-from-upper-left shading |
| terminator | false | Shade the night side using the real solar position |
| time | null | Clock for the terminator; null tracks now |
| markerStyle | "auto" | "auto" | "bubble" | "dot" |
| markerScale | 1 | Scales every marker |
| renderMarker | Not set | (ctx, marker, info) => radius: draw markers yourself |
| cluster | false | Merge nearby markers into count bubbles |
| clusterRadius | 42 | Cluster grid size in px |
| countryColors | Not set | { IN: "#f00" } keyed by ISO code, id or name, or "auto" |
| countryColor | Not set | (shape) => color: wins over countryColors |
| countryKey | Not set | (shape) => key used against countryColors |
| arcLift | 0.28 | Default arc height, as a fraction of the radius |
| arcSpeed | 1 | Multiplies every arc's travel speed |
| radiusRatio | 0.4 | Globe radius vs the smaller canvas side |
| latRange | [83, -56] | Map mode north/south bounds |
| world | bundled | Your own GeoJSON |
| fps | 30 | Frame cap |
| tooltip | false | true, or (target, kind) => string |
| respectReducedMotion | true | Honour prefers-reduced-motion |
| ariaLabel | "Interactive world map" | Accessible name for the canvas |
| onHover | Not set | (marker \| null, { x, y } \| null) => void |
| onClick | Not set | (marker, { x, y }) => void |
| onCountryHover | Not set | (country \| null, { x, y } \| null) => void |
| onCountryClick | Not set | (country, { x, y }) => void |
| onRender | Not set | Called after every frame |
Markers
{
  lat: number;      // required
  lon: number;      // required
  count?: number;   // relative weight: bigger count, bigger marker
  emoji?: string;   // drawn inside a bubble marker
  live?: boolean;   // pulsing ring
  color?: string;   // overrides the theme colour
  size?: number;    // base radius, default 3.4
  ...anything       // passed straight back to onHover / onClick
}
With cluster: true, dense areas collapse into a single bubble and your callbacks receive
{ cluster: true, count, markers, lat, lon } instead. Clustering happens in screen space, so it
re-balances automatically as you zoom.
Hex bins
Use hex bins when individual markers are too dense to read. CanvasGlobe aggregates the visible, projected markers into a pointy-top hexagonal grid, so the density view updates naturally as the globe rotates, the map pans, or the user zooms.
const globe = createGlobe(canvas, {
  markers: demandPoints,
  hexBins: {
    radius: 19,
    value: "sum",
    colorRange: ["#dbeafe", "#2563eb", "#172554"],
    padding: 1.5,
    showCount: true,
  },
  tooltip: (target, kind) => kind === "hex-bin"
    ? `${target.markerCount} locations, ${target.value} total requests`
    : target.name,
  onClick: (target) => {
    if (target.hexBin) console.log(target.markers);
  },
});
Each interactive bin returned to tooltip, onHover, and onClick contains
{ hexBin: true, markerCount, count, value, markers, lat, lon }. The default value: "sum" adds
each marker's count; use value: "count" to colour by the number of markers. Individual markers
are hidden by default while the layer is active. Set hideMarkers: false to keep them visible.
Available options are radius, minValue, value, color, colorRange, opacity, stroke,
strokeWidth, padding, showCount, labelColor, and hideMarkers. The same configuration works
in globe and flat-map modes. Since binning happens after projection, radius is measured in screen
pixels rather than geographic degrees.
Tile layers
CanvasGlobe does not contact a tile service by default. Set tileLayer only when a raster basemap
adds real value to the product. The same cached tile mosaic is reprojected for the globe,
equirectangular, Mercator, and Natural Earth views.
const globe = createGlobe(canvas, {
  tileLayer: {
    url: "https://tiles.example.com/{z}/{x}/{y}.png",
    zoom: 2,
    attribution: "Map data and imagery: Example Maps",
    onError(error, tile) {
      console.warn("Tile unavailable", tile, error);
    },
  },
});
url accepts {z}, {x}, {y}, and {-y} placeholders. For private, signed, generated, or
offline imagery, use getTile({ x, y, z }) and return a URL, canvas, image, bitmap, or a Promise of
one. Loaded XYZ coordinates are cached for the lifetime of the layer, and failed tiles leave the
built-in CanvasGlobe background visible instead of breaking the render loop.
This is an overview layer, not a slippy-map engine. zoom defaults to 2. The default maxTiles: 64
allows up to zoom 3 and prevents a configuration mistake from starting hundreds of requests. Raise
the ceiling explicitly only when the provider terms, page weight, and device budget allow it.
Always supply the attribution required by your provider. CanvasGlobe paints it into the canvas, so
it remains present in image and video exports. Remote images use anonymous CORS by default because
globe reprojection and export must read their pixels. The provider must return a compatible
Access-Control-Allow-Origin header. You may set crossOrigin: null, but a cross-origin response
without CORS cannot be reprojected or exported. You are responsible for the provider's licence,
usage policy, access token, and request limits.
How accurate is marker placement?
The projection maths is exact: a marker's pixel position matches the closed-form projection to floating-point precision, and the bubble is centred on the coordinate. Two things are worth knowing:
- The coastlines are approximate, not the markers. The bundled geometry is Natural Earth 1:110m,
decimated to a ~0.14° tolerance and rounded to two decimals, so the drawn shoreline can sit a few
kilometres from the real one. A coastal marker may look slightly offshore even though it is exactly
where you put it. Natural Earth 1:110m also omits microstates such as Singapore, Malta and Monaco: a marker there lands on open water or a neighbour. Pass higher-detail GeoJSON via
worldif that matters. latRangedefaults to[83, -56], which trims the polar caps. Markers south of −56° or north of 83° project outside the drawn map. UselatRange: [90, -90]for a full-height map.
The antimeridian is handled: the map pans freely across ±180° once zoomed, and coordinates are wrapped around the view centre, so a marker at 179°E and one at 179°W render side by side.
Arcs
globe.setArcs([
  { from: { lat: 23.03, lon: 72.58 }, to: [-0.12, 51.5] },
  { from: [72.58, 23.03], to: [139.69, 35.68], color: "#f97316", duration: 3200 },
]);
Arcs follow the great circle, bow above the surface by lift, animate a travelling head, and are
clipped at the horizon as the globe turns. Set animate: false for a static line.
Choropleth
import { createGlobe, colorScale } from "canvas-globe";

const visits = { IN: 940, US: 720, GB: 480, JP: 300 };
const scale = colorScale([0, 1000], ["#e0f2fe", "#0369a1"]);

createGlobe(canvas, {
  mode: "map",
  countryColors: Object.fromEntries(Object.entries(visits).map(([k, v]) => [k, scale(v)])),
  onCountryClick: (shape) => console.log(shape.iso, shape.name),
});
Keys are matched case-insensitively against the ISO alpha-2 code, then the numeric id, then the
country name. Pass countryKey if your data uses something else.
Methods
globe.setMarkers([...]);              // swap the marker set
globe.setArcs([...]);                 // swap the arcs
globe.setMode("map");                 // switch projection family
globe.setProjection("naturalEarth");  // switch flat projection
globe.setPreset("hologram");          // swap the whole look
globe.setLandStyle("dots");           // fill | dots | outline | glow
globe.setTheme("midnight");           // switch palette
globe.setTime(Date.UTC(2024, 5, 21)); // terminator clock; null tracks now
globe.setOptions({ autoRotate: false });
globe.setZoom(3);
globe.zoomBy(1.4);
globe.flyTo(139.69, 35.68);           // ease to Tokyo
globe.flyTo(139.69, 35.68, { instant: true, zoom: 4 });
globe.fitTo([68, 6, 98, 36]);         // frame [west, south, east, north]
globe.fitToMarkers();                 // frame every marker
globe.focusOn("India", { isolate: true });
globe.setCountryMedia("India", "/reel.mp4");
globe.countryAspect("India");         // → height / width ratio for the canvas
globe.clearFocus();
globe.setScene("logos");              // whole composition
globe.exportImage({ preset: "story", transparent: true });
await globe.exportBlob({ preset: "og" });
globe.setTimelineAt("2024-06-01");
globe.playTimeline({ duration: 6000 }); // → { stop() }
globe.ping({ lat, lon, label });      // one-shot expanding ring
globe.pingFeed(events, { interval }); // → { stop() }
globe.tour(points, { dwell });        // → { stop() }
globe.story(el, steps);               // scroll-linked view
globe.record({ duration, filename }); // → { promise, stop() }
globe.locateViewer();                 // → { lat, lon, timeZone, country, source, accuracy }
globe.setTexture(imageOrUrl);
globe.getCenter();                    // → { lon, lat }
globe.project(lon, lat);              // → { x, y } or null if behind the globe
globe.unproject(x, y);                // → [lon, lat] or null
globe.countryAt(x, y);                // → country shape or null
globe.snapshot();                     // → PNG data URL, great for share images
await globe.toBlob();                 // → Blob
globe.invalidate();                   // request one more frame
globe.resize();                       // usually automatic via ResizeObserver
globe.destroy();                      // stop the loop and remove listeners
Helpers are exported too: mapAspect, colorScale, greatCircle, angularDistance,
subsolarPoint, pointInGeometry, geometryBounds, projections, themes, presets, scenes,
exportPresets, fromCSV, parseCSV, geocode, countryPoint, placeLocation.
Accessibility
The canvas gets role="img", an aria-label, and, when keyboard is on, a tab stop plus a
polite live region that announces the view as it changes.
| Key | Action |
| --- | --- |
| ← → ↑ ↓ | Rotate or pan (hold Shift for bigger steps) |
| + / - | Zoom in / out |
| 0 | Reset to the initial view |
| PageDown / PageUp | Cycle through markers, flying to each |
| Enter / Space | Activate the focused marker |
When the user prefers reduced motion, auto-rotation stops, flyTo jumps instead of easing, and
pulse rings and arc animations hold still. Set respectReducedMotion: false to opt out.
Data in, assets out
Marketing data arrives as a spreadsheet, so fromCSV resolves rows itself: explicit lat/lon
columns first, then a city name, then a country code or name:
import { fromCSV } from "canvas-globe";

const markers = fromCSV(`city,count,image
London,8,/logos/acme.png
Tokyo,4,/logos/globex.png`);

markers.skipped; // rows that could not be placed, so you can report them
globe.setMarkers(markers).fitToMarkers();
City lookup covers roughly 300 major cities that already ship with the package. Pass
{ gazetteer: { Ahmedabad: [72.58, 23.03] } } for anything else: no geocoding service, no key.
Render at whatever size the destination wants, without touching the live canvas:
globe.exportImage({ preset: "story" });                    // 1080×1920 data URL
globe.exportImage({ preset: "linkedin", transparent: true });
await globe.exportBlob({ width: 2400, height: 1260 });
Presets: square, story, portrait, wide, linkedin, og, twitter, thumbnail.
Scenes
Presets decide how it looks; scenes decide what you are making. Each one bundles a preset with the layers and overlays that job needs.
createGlobe(canvas, { scene: "signups" });
globe.setScene("coverage");
| Scene | For |
| --- | --- |
| signups | Live activity on a pricing or landing page |
| launch | A regional announcement, ready for country media |
| logos | "Trusted in N countries" with customer logos |
| team | Where the team is, on a careers page |
| coverage | Campaign or revenue by country, with a legend |
| review | Scroll-linked year in review |
| routes | Traffic between regions |
Switching scenes resets every key the new scene does not set, so nothing leaks between them.
Overlays
createGlobe(canvas, {
  counter: { value: 21947, label: "customers worldwide" },   // rolls when it changes
  title: { text: "Trusted in 68 countries", subtitle: "Join 21,947 teams" },
  watermark: { image: "/logo.svg", text: "acme.com" },       // baked into every export
  annotations: [{ lat: 23.03, lon: 72.58, text: "HQ: Ahmedabad" }],
  timeline: { at: "2024-06-01" },                            // hides later markers
});

globe.playTimeline({ duration: 6000, loop: true });          // "our growth, animated"
globe.ping({ lat, lon, label: "10,000 users 🎉", burst: 18 });
Markers take image for a circular logo or avatar crop, and arcs take icon for a travelling
glyph. Country media accepts { text } to cut type out of a country's outline.
Country canvas
Frame one country and paint media inside its outline: a still, an animated GIF, a video, another
canvas, or a live MediaStream:
globe.focusOn("India", { isolate: true });
globe.setCountryMedia("India", "/launch-reel.mp4");

// or declaratively
createGlobe(canvas, {
  mode: "map",
  focus: { country: "IN", isolate: true, outlineWidth: 2 },
  countryMedia: {
    IN: { src: "/reel.mp4", fit: "cover" },
    BR: "/photo.jpg",
  },
});
The media is clipped to the bundled country outline, including islands. Sources resolve
automatically: .mp4/.webm become looping muted video, .gif keeps animating, and anything
drawImage accepts can be passed directly. fit mirrors CSS object-fit, and opacity, blend,
scale and offset are available per country.
focusOn zooms past maxZoom when it has to, since framing a country is an explicit request.
countryAspect("India") returns the height/width ratio to size the canvas with, so the shape is not
letterboxed:
#map { width: 100%; aspect-ratio: var(--country-aspect, 1); }Without isolate, neighbours stay visible at dim opacity, which reads well for "our market" maps.
Where is the viewer?
createGlobe(canvas, { showViewer: true });That pins the person looking at the page: no permission prompt, no network call, no API key,
instantly. It reads Intl.DateTimeFormat().resolvedOptions().timeZone, which every browser
exposes, and maps it to the coordinate the IANA database publishes for that zone. Legacy aliases
resolve too (Chrome often reports Asia/Calcutta, not Asia/Kolkata).
const found = globe.locateViewer();
// { lat: 23.29, lon: 82.52, timeZone: "Asia/Kolkata", country: "IN",
//   source: "timezone", accuracy: "region", accuracyMeters: 2242000 }
It shows a region, not a pinpoint, and represents that uncertainty. A time zone only narrows you to
its area, and the tz database publishes one representative city per zone. Asia/Kolkata covers all
of India, so a naive pin would sit confidently on Kolkata even for someone in Ahmedabad, 1,600 km
away. Two things prevent that:
- Anchoring. For countries wider than 8° the pin goes on the country centroid instead of the
zone's city, which roughly halves the average error. Smaller countries keep their real city.
Override with
anchor: "country" | "timezone". - An uncertainty circle. The pin is surrounded by a dashed circle sized to the actual radius, so
the graphic says "somewhere in here" rather than "exactly here". Turn it off with
accuracyCircle: false.
When you need a real position, ask for one:
const found = await globe.locateViewer({ precise: true });
globe.setViewerLocation(found);
// source: "geolocation", accuracyMeters: 24; the circle shrinks to match
That requests the high-accuracy provider and reports the device's own accuracyMeters, so you can
tell a 20 m GPS fix from a 40 km Wi-Fi one. On a desktop with no GPS the browser falls back to
network positioning, which often lands on your ISP's city: the radius will say so. If the viewer
declines, it resolves to the time-zone estimate and never rejects.
| | Prompt | Network | Always works | Typical radius |
| --- | --- | --- | --- | --- |
| Time zone (default) | No | No | Yes | Country-sized |
| Locale fallback | No | No | Yes | Country-sized |
| precise: true, GPS | Yes | No | Only if allowed | 5-50 m |
| precise: true, Wi-Fi/IP | Yes | Yes (by the browser) | Only if allowed | 1-50 km |
Options: showViewer: { emoji, label, color, live, anchor, accuracyCircle, accuracyColor, flyTo,
ping, precise, onLocate }. The pin lives outside markers, so setMarkers() never wipes it.
Live pings
A one-shot expanding ring: the social-proof moment, with no backend:
globe.ping({ lat: 52.52, lon: 13.4, emoji: "✨", label: "Someone in Berlin just signed up" });

const feed = globe.pingFeed(events, { interval: 1800 });
feed.stop();
Tour, story and recording
globe.tour(cities, { dwell: 2600, zoom: 2.2 });   // cinematic auto-fly, returns { stop() }

globe.story(section, [                            // scroll-linked rotation
  { at: 0,   center: [0, 20],  zoom: 1 },
  { at: 0.5, center: [72, 23], zoom: 3, markers: indiaMarkers, preset: "hologram" },
]);

await globe.record({ duration: 6000, filename: "globe.webm" }).promise;
record() uses MediaRecorder on the canvas stream: the clip is encoded in the tab and never
leaves the device. Check the exported canRecord() helper first.
Looks
A preset bundles a theme with a render style. Your own options always win over it.
createGlobe(canvas, { preset: "hologram" });
globe.setPreset("neon");
| Preset | Look |
| --- | --- |
| atlas | Bright cartographic globe (the default) |
| midnight | Dark space theme |
| mono | Neutral greyscale |
| political | Printed atlas: a distinct colour per country |
| hologram | Cyan dot-matrix earth on deep navy |
| neon | Glowing magenta continents with a cyan rim |
| blueprint | Technical line art with orbit rings |
| aurora | Green dot matrix with violet rings |
| noir | High-contrast black and white |
| constellation | Sparse dots, stars and three orbits |
The pieces compose independently, so any theme mixes with any style:
| Option | Values |
| --- | --- |
| landStyle | "fill" · "dots" (halftone) · "outline" (line art) · "glow" (neon) · "none" |
| dotSpacing / dotSize | Grid spacing in degrees and dot radius in px |
| orbits | A count (0-6), or { inclination, phase, radius, speed, color, width } rings |
| countryColors: "auto" | A distinct fill per country; countryPalette supplies your own |
createGlobe(canvas, { theme: "midnight", landStyle: "dots", dotSpacing: 2.4, orbits: 3 });Dots come from rasterising the land once into an off-screen bitmap and sampling a grid, so the whole
matrix draws in a single fill and re-spacing is cheap. Orbit rings are real great circles, so they
pass behind the globe as it turns. countryColors: "auto" runs a greedy graph colouring over country
adjacency, so neighbours never share a fill.
Themes
atlas, midnight, mono, hologram, neon, blueprint, aurora, noir and political.
Use theme: "auto" to follow the OS colour scheme, or theme: "css" to read --geo-* custom
properties off the canvas so the globe inherits your design tokens:
#globe { --geo-land: #334155; --geo-ocean-from: #0f172a; --geo-ocean-to: #020617; }Override any subset directly too:
createGlobe(canvas, {
  theme: { ocean: ["#0f172a", "#020617"], land: "#334155", marker: "#f97316", arc: "#22d3ee" },
});
Custom geometry
The bundled data is Natural Earth 1:110m, simplified for smooth animation. Swap in anything GeoJSON:
const world = await fetch("/my-countries.geojson").then((r) => r.json());
createGlobe(canvas, { world });
Performance
Rendering is capped at 30 fps, and frames are skipped entirely when nothing is moving: a static chart costs nothing after the first paint. Geometry behind the horizon is clipped away rather than drawn, so a typical globe frame skips 20-60% of the world. On a laptop a 560 px canvas costs roughly 4 ms per frame, or 25 ms with 5,000 clustered markers.
Data & licences
- Country geometry: Natural Earth 1:110m via
world-atlas, public domain - ISO codes: natural-earth-vector, public domain
- Supplemental geometry: Datameet maps, CC-0
- CanvasGlobe 1.0 and later: CanvasGlobe Software License Agreement
- CanvasGlobe through 0.1.6: GPL-3.0-only
See THIRD_PARTY_NOTICES.md for source links and provenance.
Regenerate the bundled data any time with npm run data.
Development
npm test        # node --test, no test framework to install
npm run build   # dist/canvas-globe.umd.js, with a gzipped size budget
npm run example # demo at http://localhost:8099
npm run release:check # tests, types, build and packed-artifact validation
npm run capture:readme # regenerate the animated README demo with Chrome or Chromium
The README capture script detects common Chrome and Chromium locations. If the
browser is installed elsewhere, set CANVAS_GLOBE_CHROME to its executable
path before running npm run capture:readme.
The product website and documentation are maintained separately at canvasglobe.swiftools.com.
Support
For installation help, licensing questions, commercial inquiries, or general support, email [email protected].
Found a bug or have an idea? Use the repository's guided issue forms. Built something with CanvasGlobe? Submit it to the community showcase; projects are only displayed after the owner grants permission.
Author
Harsh Jhunjhunuwala
Copyright (C) 2026 Harsh Jhunjhunuwala. CanvasGlobe is published under the Swiftools brand.
Browser support
Any browser with <canvas> and ResizeObserver: Chrome, Edge, Firefox, Safari 13.1+. No polyfills
required. The modules load safely during SSR; nothing touches the DOM until you construct an instance.