
chartam.io
v1.4.0
Published
This package provides a comprehensive chart library built on top of amCharts 5, a powerful and flexible JavaScript charting library that supports a wide range of chart types and data formats.
Downloads
42

Readme
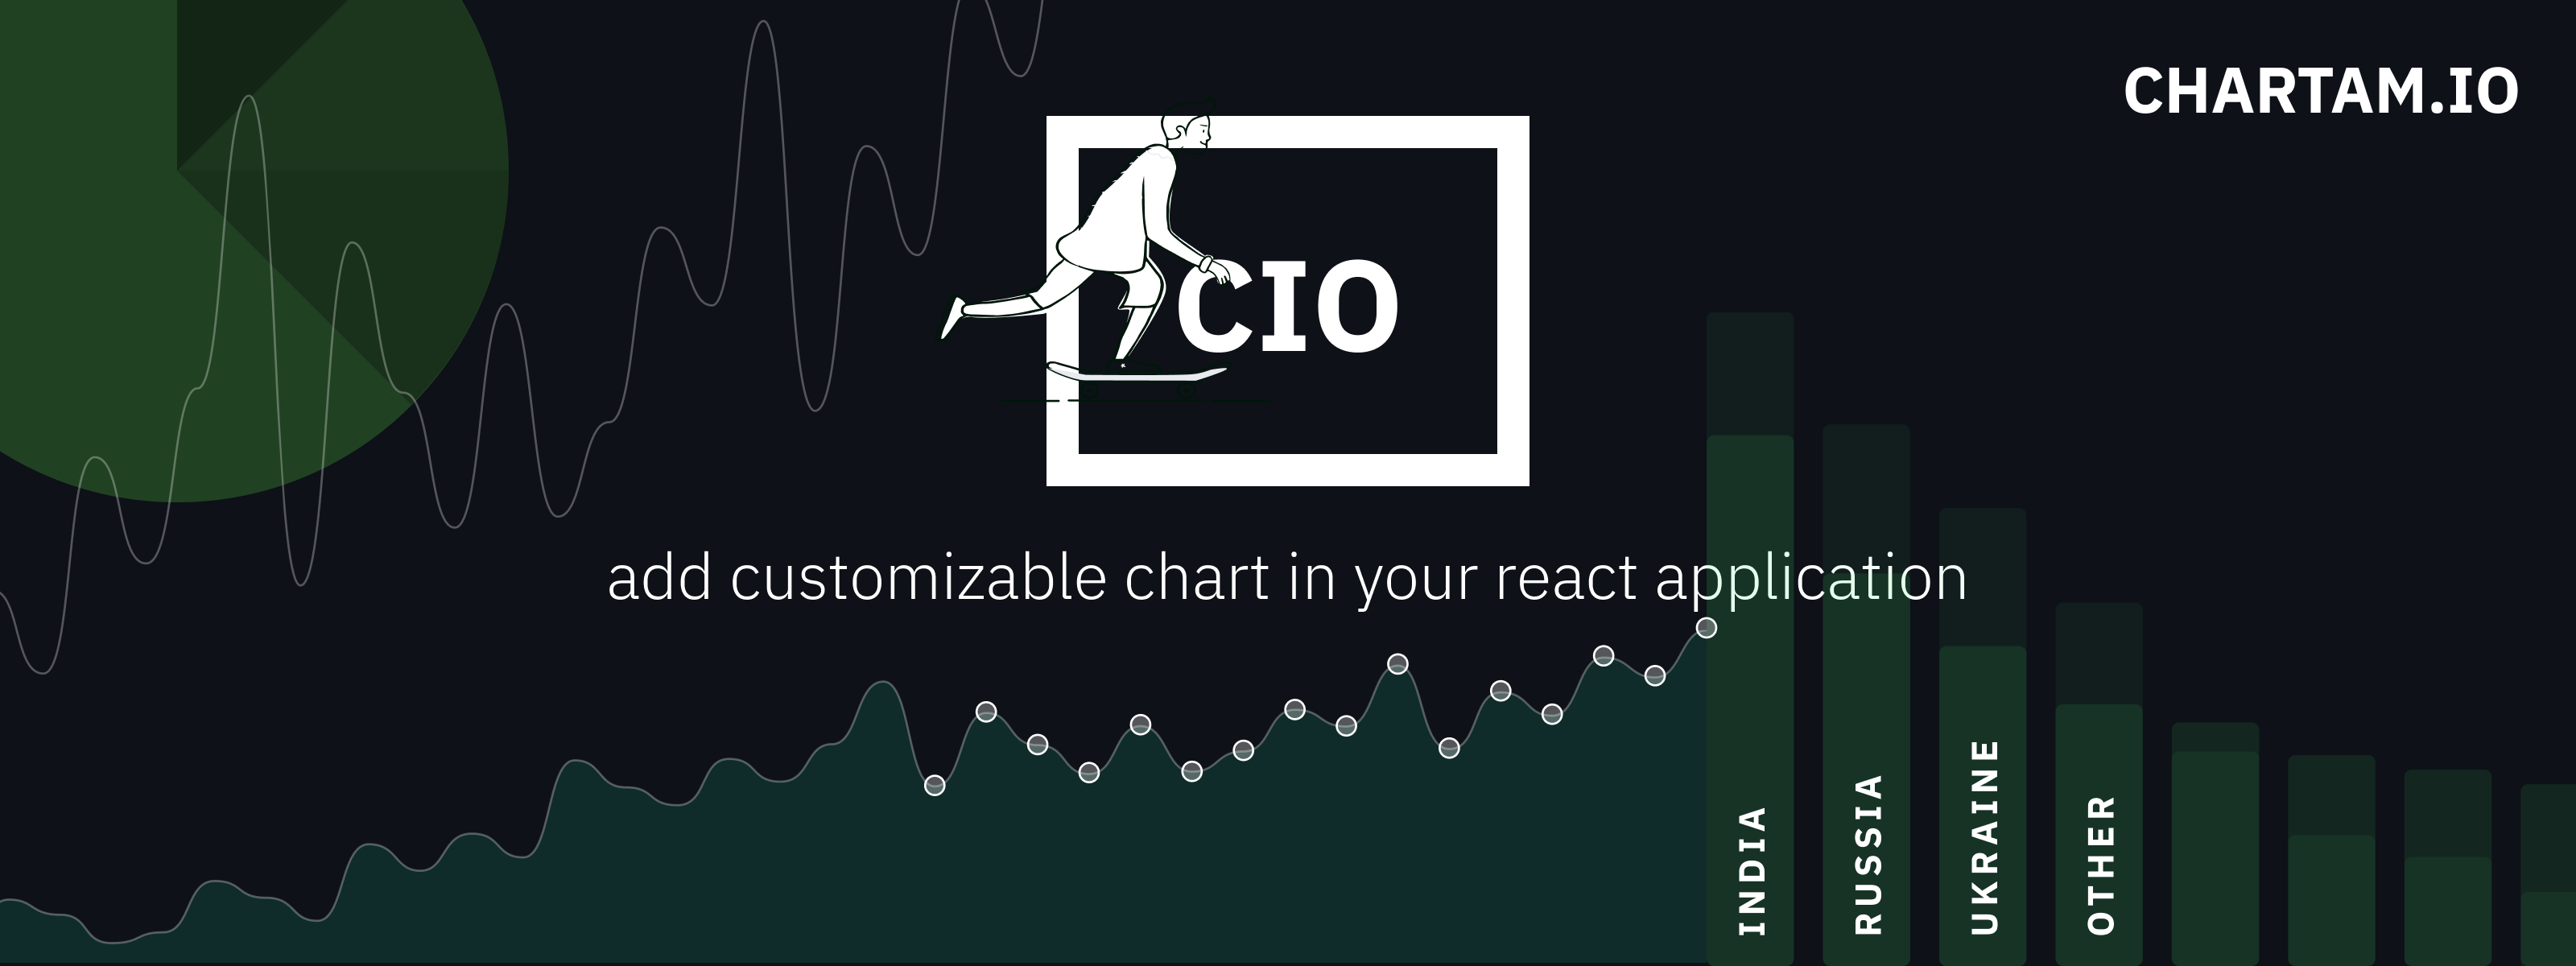
chartam.io
![]()
![]()
![]()
![]()
![]()

This package provides a comprehensive chart library built on top of amCharts 5, a powerful and flexible React charting library that supports a wide range of chart types and data formats.
With this library, you can easily create visually stunning and interactive charts for your web applications, dashboards, and reports. The library includes a variety of pre-built chart types, such as bar charts, line charts, scatter charts, and more, that can be customized to fit your specific needs.
The package is designed to be easy to use and integrate into your existing web development workflow. It comes with comprehensive documentation and examples to help you get started quickly.
Features:
- Wide range of chart types
- High-performance rendering
- Fully customizable styling
- Responsive and mobile-friendly design
- Cross-browser compatibility
- Comprehensive documentation and examples
Trello 
- You can post your chart requirements we can create for you new chart component if there's no component in library and also we can create you chart as per your reuirement.
- You can ask question in trello as well as.
- Write your thoughts about package in trello as well.
Buy me a coffee
Installation
Download node at nodejs.org and install it, if you haven't already.
npm install chartam.io --saveUsage
Install Package
# import specific chart
import { ColumnWithRolatedLabel } from "chartam.io";

<ColumnWithRolatedLabel
    chartId="ColumnWithRolatedLabel" // chartid will be unique
    width="1000px" // width
    height="500px" // height
    data={[
        {
            category: "India",
            value: 2025,
        },
        {
            category: "USA",
            value: 1882,
        }
        ]} // data
    setting={{
        xAxis: {
            label: {
              rotation: -90, // rotation
              paddingRight: 15, // padding right
            },
        },
        yAxis: {
            minValue: 100, // value for yaxis start point
            maxValue: 2500, // value for yaxis end point
        },
        columnSeries: {
            tooltipText: "{value} {category}", // JSON key names
            barcolor: "#6ed27a", // color code
          },
        }}
/>
Documentation
For more information on how to use Chartam.io, see the documentation.
Dependencies
- amcharts: Programming library for all your data visualization needs.
- lodash: Lodash makes JavaScript easier by taking the hassle out of working with arrays, numbers, objects, strings, etc.
Contributers
We welcome contributions from the community! If you find a bug, have a feature request, or would like to contribute code, please open an issue or pull request on our GitHub repository. ![]()