
chartformers
v1.0.56
Published
Animated React charting library powered by D3 with smooth data transitions and interactive features
Downloads
250
Maintainers
 petrando
Keywords
Readme
chartformers


chartformers is a lightweight React.js library for rendering interactive, responsive, and animated D3.js charts. It is designed to simplify chart creation in modern React apps while retaining the full power of D3 under the hood.
✨ Features
- Easy-to-use React components for common chart types
- Smooth animated transitions
- Performance-first:
- ~46 KB min+gzip for typical usage
- ~27–30 KB gzip per chart (tree-shaken)
- Fully tree-shakeable and modular
- Full TypeScript support
- Responsive charts that auto-fit their containers
- Simple styling with included CSS
- Powered by D3.js + React 19
Note: npm unpacked size includes source maps, type definitions, and multiple build formats.
Production bundle size depends on which charts you import.
📦 Installation
npm install chartformers@latestTo use a bar chart component import these:
import { BarChart } from 'chartformers';
import 'chartformers/dist/chartformers.css';
Render the chart inside a container with explicit width and height:
<div className="w-full h-60 md:h-96">
<BarChart data={[]} />
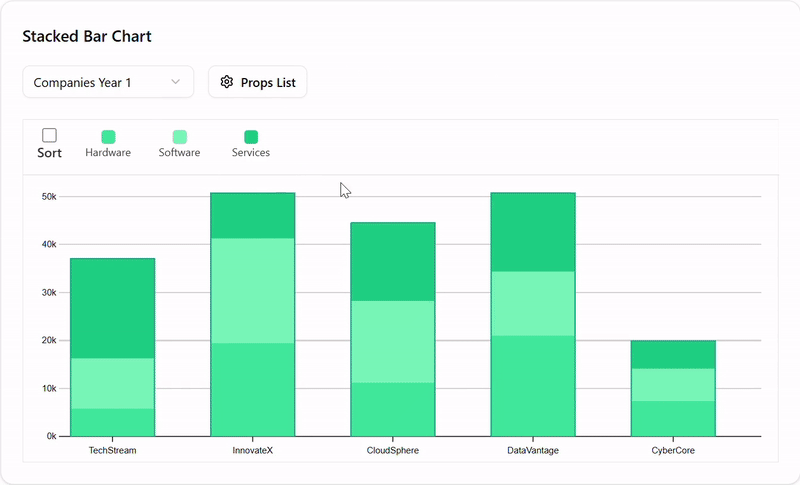
</div>Example: sortable stacked bar chart
import { StackedBarChart } from "chartformers";
import 'chartformers/dist/chartformers.css';

export default function StackedBarChartExample() {
  const companyData = [
    {
      "label": "TechStream",
      "Hardware": 5409,
      "Software": 8200,
      "Services": 10390,
      "Consulting": 21500,
      "Maintenance": 7506
    },
    {
      "label": "InnovateX",
      "Hardware": 11265,
      "Software": 8657,
      "Services": 18200,
      "Consulting": 9400,
      "Maintenance": 5286
    },
    {
      "label": "CloudSphere",
      "Hardware": 16087,
      "Software": 14200,
      "Services": 22400,
      "Consulting": 19423,
      "Maintenance": 11935
    },
    {
      "label": "DataVantage",
      "Hardware": 9912,
      "Software": 15900,
      "Services": 14674,
      "Consulting": 13322,
      "Maintenance": 11500
    },
    {
      "label": "CyberCore",
      "Hardware": 3488,
      "Software": 5520,
      "Services": 6685,
      "Consulting": 7433,
      "Maintenance": 5769
    },
    {
      "label": "AetherSystems",
      "Hardware": 6811,
      "Software": 8900,
      "Services": 8582,
      "Consulting": 24100,
      "Maintenance": 6700
    }
  ];

  return (
    <div className="w-full h-60 md:h-96">
      <StackedBarChart data={companyData} />
    </div>
  );
}
For full explanations on the options and properties, with live demo:
Visit the chartformers documentation.
Or you can grab the source code at: