
chartme
v0.0.13
Published
Turn an image into a chart.

Readme
ChartMe: Image to chart generation.
ChartMe is a TypeScript library designed to take in an image and turn it into a chart while also providing customization options.
Features
- Recoloring images using proximity to color.
- Filtering a processed image to filter for outliers.
- Saving and loading preprocessed graph data.
- Recoloring following same colored segments.
Related Links
- GitHub: https://github.com/CasFre4/EIA-bulk
- npm: https://www.npmjs.com/package/chartme
Installation
You can install the chartme package using npm:
npm install chartmeGetting Started
1. Imports
import ChartMe from 'chartme'
import {Jimp} from 'jimp'
2. Saving a model
const image = await Jimp.read(imagePath)
const chart = await new ChartMe({image: image, colorBundle: [
    {tcolor: [0,0,0,255], fcolor: 'green'},
    {tcolor: [50,50,50,255], fcolor: 'yellow'},
    {tcolor: [100, 100, 100, 255], fcolor: 'red'},
    {tcolor: [150,150,150,255], fcolor: 'black'}],
    height: image.height/20, width: image.width/20})
    .load()//height and width define image resizing.
chart.cleanData()
chart.splitColors({splits: 3})
chart.preprocess()
chart.saveFile('./data.json')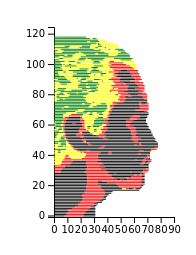
3. Displaying graph
With saved file and React
const containerRef = useRef<HTMLDivElement>(null);
useEffect(() => {
    const run = async () => {
        if (!containerRef.current) return
        const chart = new ChartMe({})
        await chart.loadFile('./data.json')
        chart.graph({container: containerRef.current, height: 190, width: 120})//height and width define size of chart
    }
    run();
}, []);
Without save file and using getElementById
const image = await Jimp.read(imagePath)
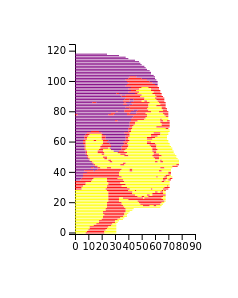
const chart = await new ChartMe({image: image, colorBundle: [
{tcolor: [0,0,0,255], fcolor: 'purple'},
{tcolor: [100,100,100,255], fcolor: 'red'},
{tcolor: [150, 150, 150, 255], fcolor: 'yellow'}],
height: image.height/20, width: image.width/20})
.load()
chart.cleanData()
chart.splitColors({splits: 3})
chart.preprocess()
const container = document.getElementById('my_dataviz')
if (container && container instanceof HTMLDivElement) {
chart.graph({container: container, height: 190, width: 120})
}
4. With color splitting
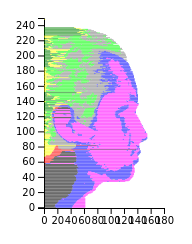
const image = await Jimp.read(imagePath)
const chart = await new ChartMe({image: image, colorBundle: [
    {tcolor: [0,0,0,255], fcolor: 'green'},
    {tcolor: [50,50,50,255], fcolor: 'yellow'},
    {tcolor: [100, 100, 100, 255], fcolor: 'red'},
    {tcolor: [150, 150, 150, 255], fcolor: "black"}]})
    .load()
chart.cleanData()
chart.splitColors({splits: 4, colorBundle:
  [{tcolor: [0,0,0,255], fcolor: 'lime'},
  {tcolor: [50,50,50,255], fcolor: 'grey'},
  {tcolor: [150, 150, 150, 255], fcolor: 'blue'},
  {tcolor: [100,100,100,255], fcolor: 'magenta'}]})
chart.preprocess()
const container = document.getElementById('my_dataviz')
if (container && container instanceof HTMLDivElement) {
    chart.graph({container: containerRef.current, height: 190, width: 120})
}
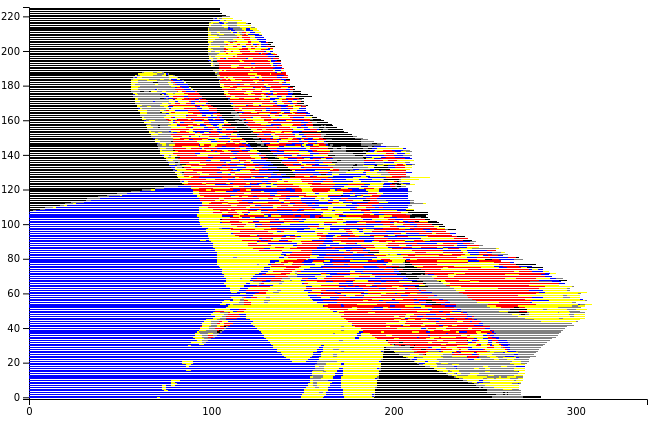
5. Full example
Starting image

Edit image
Switching to an image with an alpha channel and removing parts of the image that you don't want on your chart will facilitate the process.

Image processing and chart generation
const editproportion = 1/2
image.flip({horizontal: true})//Flip since charts only face right.
const chart = await new ChartMe({image: image, colorBundle:
  [{tcolor: [50,51,50,255], fcolor: 'grey'},
  {tcolor: [33,28,25,255], fcolor: 'black'},
  {tcolor: [85,24,24,255], fcolor: 'red'},
  {tcolor: [100, 100, 100, 255], fcolor: 'yellow'},
  {tcolor: [150, 150, 150, 255], fcolor: 'blue'},
  ], height: image.height * newprop, width: image.width * newprop}).load()
chart.cleanData()
chart.splitColors({splits: 5})
chart.preprocess()
Final Chart
Limitations
- Images may look better with some minimal external image editing.
- Graphing options are currently limited.
- Works best with images that have distinct color changes.