
chartsheet
v0.3.1
Published
Write native Excel charts and pivot tables into .xlsx files built with ExcelJS or SheetJS

Maintainers
 ritusmoikaushik
Readme
chartsheet
Native Excel charts and pivot tables for .xlsx files built with ExcelJS or SheetJS —
the support neither library has.
ExcelJS is installed over 11 million times a week and cannot write a chart. Its pivot table code was
merged twelve days after its last release and has never been published, so npm install exceljs
cannot produce one either. SheetJS Community leaves charts to its paid tier, and does not offer pivot
creation at all. So every spreadsheet exported by every app using them arrives as bare numbers, and
whoever opens it selects the data and inserts the chart by hand.
This adds them. Real, native Excel objects — click one, change a number, it redraws. Not images.
npm install chartsheet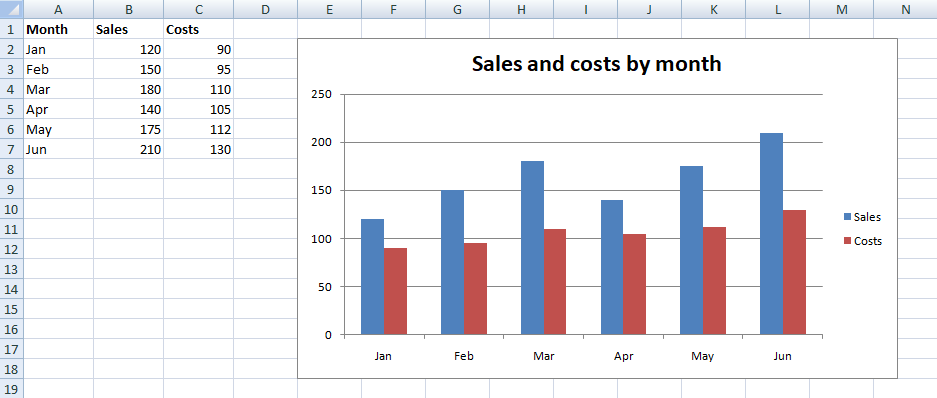
Documentation · charts with ExcelJS · pivot tables · with SheetJS · why charts vanish · check a file in your browser
Use
const fs = require('fs')
const ExcelJS = require('exceljs')
const { addChart } = require('chartsheet')

async function main () {
  const wb = new ExcelJS.Workbook()
  const ws = wb.addWorksheet('Data')
  ws.addRow(['Month', 'Sales', 'Costs'])
  ws.addRow(['Jan', 120, 90])
  ws.addRow(['Feb', 150, 95])
  ws.addRow(['Mar', 180, 110])

  let buffer = await wb.xlsx.writeBuffer()   // ExcelJS writes the sheet

  buffer = await addChart(buffer, {          // chartsheet adds the chart
    type: 'bar',
    title: 'Quarterly performance',
    categories: "'Data'!$A$2:$A$4",
    series: [
      { nameRef: "'Data'!$B$1", ref: "'Data'!$B$2:$B$4" },
      { nameRef: "'Data'!$C$1", ref: "'Data'!$C$2:$C$4" },
    ],
    anchor: { col: 4, row: 1 },              // top-left cell, zero-based: E2
  })

  fs.writeFileSync('report.xlsx', buffer)
}

main()
The snippets after this one are fragments — they assume they sit inside an async function, because
await cannot go at the top level of a CommonJS file.
Works the same on a SheetJS workbook:
const buffer = XLSX.write(wb, { type: 'buffer', bookType: 'xlsx' })
const withChart = await addChart(buffer, spec)
Chart types
bar · column · line · pie · doughnut · area · scatter · radar
Options
| Option | Meaning |
|---|---|
| type | one of the types above; defaults to bar |
| title | chart title; omit for no title |
| series | [{ ref, nameRef, name, colour }] — ref is required |
| categories | cell range for the category labels |
| sheet | worksheet name to place the chart on; defaults to the first |
| anchor | { col, row }, zero-based top-left cell |
| width / height | pixels; defaults 600 × 340 |
| stacked | stack the series |
| horizontal | horizontal bars (bar only) |
| dataLabels | print values on the chart |
| legend | 'r', 'l', 't', 'b', or false to hide |
| numberFormat | value-axis format, e.g. '#,##0.00' |
| gridlines | false to remove value-axis gridlines |
| xTitle / yTitle | axis titles |
Several charts at once:
const { addCharts } = require('chartsheet')
buffer = await addCharts(buffer, [barSpec, lineSpec, pieSpec])
Pivot tables
exceljs has no pivot table API. Support was merged into its master branch on 2023-10-31,
twelve days after the last release, and has never been published — so npm install exceljs
cannot give you one. chartsheet writes the pivot parts into the finished file.
const { addPivotTable } = require('chartsheet')

buffer = await addPivotTable(buffer, {
  sourceSheet: 'Data',
  sourceRef: 'A1:C500',      // include the header row
  targetSheet: 'Report',     // must already exist
  anchor: 'A3',
  rows: ['Region'],
  columns: ['Product'],
  values: [{ field: 'Sales', fn: 'sum' }],
})
| Option | Meaning |
|---|---|
| sourceSheet | Sheet holding the source table. Defaults to the first sheet |
| sourceRef | Range including the header row, e.g. 'A1:C500' |
| targetSheet | Sheet the table is written to. Must exist |
| anchor | Top-left cell of the table. Default 'A3' |
| rows / columns / filters | Field names, taken from the header row |
| values | ['Sales'], or [{ field, fn, name }] |
| name | Table name. Default 'PivotTable1' |
fn is one of sum, count, average, max, min, product, countNums, stdDev,
stdDevp, var, varp.
addPivotTables(buffer, [spec, spec]) writes several in one pass.
The aggregation itself is left to Excel. The cache definition sets refreshOnLoad, so Excel
rebuilds rows, columns and totals from the cached records when the file opens — the same
division of labour the charts use, and far more robust than reimplementing Excel's own
aggregation in JavaScript.
validate() checks pivot wiring too: that cacheId resolves to a <pivotCache> in the
workbook, that the table part relates to its cache definition, and that recordCount matches
the records actually written. All three are silent failures otherwise.
Validating a workbook
Excel reports a damaged file only as "we found a problem with some content", with no detail. This tells you what is actually wrong:
const { validate } = require('chartsheet')

const { valid, errors, warnings } = await validate(buffer)
// errors: [ 'xl/charts/chart1.xml: no <Override> content type — ...' ]
It checks the things that make Excel refuse a file: unresolved relationships, missing content-type
overrides, duplicate shape ids, drawing parts that are related but never referenced, and <drawing>
placed out of schema order. Useful on any xlsx, not only ones this library touched.
Why this exists
Adding a chart to an xlsx means writing a chart part, a drawing part, two sets of relationships, and content-type overrides — and getting any of it slightly wrong produces a file Excel refuses to open, with no useful error. The most-upvoted feature request on ExcelJS asked for chart support in 2016 and is still open.
Notes
- Cell references use standard Excel syntax and should be absolute:
'Sheet name'!$B$2:$B$10 - A worksheet holds one drawing part; every chart on that sheet becomes another anchor inside it, which this handles for you
- Output opens in Excel, Google Sheets and LibreOffice
Keeping charts through a read-write cycle
ExcelJS does not model chart parts, so opening a workbook that has charts, editing it and writing it back silently deletes every chart. No error, no warning. Reported on ExcelJS in 2020, 2021 and 2023; still open.
const { preserveCharts } = require('chartsheet')

const original = fs.readFileSync('template.xlsx')   // has charts

const wb = new ExcelJS.Workbook()
await wb.xlsx.load(original)
wb.getWorksheet('Data').getCell('B2').value = 999
const rewritten = await wb.xlsx.writeBuffer()       // charts are gone here

const output = await preserveCharts(original, rewritten)   // and back again
Or in two steps, if the edit happens elsewhere:
const record = await captureCharts(original)
// ...
const output = await restoreCharts(rewritten, record)
Sheets are matched by name, so charts land back where they belong even if sheet order changed. A sheet that was renamed or removed is skipped rather than guessed at.
Keeping pivot tables through a read-write cycle
The same hole, and the oldest open issue about it — ExcelJS #261, filed 2017. Load a workbook
that has a pivot table, write it back, and the pivot tables, their caches and the workbook's
<pivotCaches> entry are all gone. Nothing is corrupt; they were never written, so there is no
error to catch.
const { preservePivotTables } = require('chartsheet')

const original = fs.readFileSync('report.xlsx')     // has a pivot table

const wb = new ExcelJS.Workbook()
await wb.xlsx.load(original)
wb.getWorksheet('Data').getCell('C2').value = 999
const rewritten = await wb.xlsx.writeBuffer()       // pivot is gone here

const output = await preservePivotTables(original, rewritten)
capturePivotTables / restorePivotTables split it in two, the same way the chart pair does.
The restored cache is marked refreshOnLoad, so Excel recomputes every total from the sheet as it
opens the file. The records captured off the original describe the data before your edit, and a
pivot showing yesterday's numbers is worse than one that takes a moment to redraw.
Most real templates have both, so there is one call that does both:
const { preserveAll } = require('chartsheet')
const output = await preserveAll(original, rewritten)   // charts and pivot tables
Licence
MIT