
chiasm-dataset
v0.1.1
Published
A data structure for representing tabular data.

Readme
chiasm-dataset

A data structure for representing tabular data.
Intended for use as:
- the data structure generated by loading data into the browser,
- the input and output type for data transformations (e.g. filtering and aggregation), and
- the input type for data visualizations.
This data structure accommodates both relational data tables as well as aggregated multidimensional data.
The purpose of this data structure is to serve as a common data table representation for use in the Chiasm project. By using this data structure, components for data access, data transformation, and interactive visualization can be interoperable.
What Problem Does This Solve?
Most of the D3-based data visualization examples are organized such that the data-specific logic is intertwined with data visualization logic. This is a barrier that makes it more difficult to adapt existing visualization examples to new data, or to create reusable visualization components.
For example, in this Bar Chart Example, the visualization logic is deeply entangled with the mapping from data to visual marks and channels in lines of code like this `` Also, the logic that specifies how each column in a CSV file should be parsed is specified using JavaScript, which must be manually changed with changing the data used for the visualization.
As another example, consider the Heatmap Example. This example has the following lines:
// The size of the buckets in the CSV data file.
// This could be inferred from the data if it weren't sparse.
var xStep = 864e5,
    yStep = 100;
These steps are defined in JavaScript code, but are better suited to be expressed as part of the dataset representation. Chiasm-dataset supports representation of intervals like this using the interval property, allowing visualizations to be implemented that operate on any intervals that may be used in the data.
Introducing a well defined data structure for dealing with data tables makes it possible to cleanly separate data-specific logic from generic data visualization logic. Using chiasm-dataset as an intermediate data table representation, the chiasm-dsv-dataset module moves the logic that specifies how each column in a CSV file should be parsed out of JavaScript and into a configuration file. This organization of the code also enables services that may render arbitrary data tables that can be configured dynamically at runtime.
In addition, it is useful to explicitly represent the types of each column so that they can be checked for compatibility with various "shelves" of visualization components such as xColumn, yColumn, colorColumn, sizeColumn, and shapeColumn, corresponding to mappings from data columns (also called "variables", "fields", or "attributes") visual marks and channels. This enables user interfaces that are aware of column type restrictions for certain visualization, such as dropdown menus restricted by column type, or drag & drop interfaces that know where a given column can and cannot be dropped.
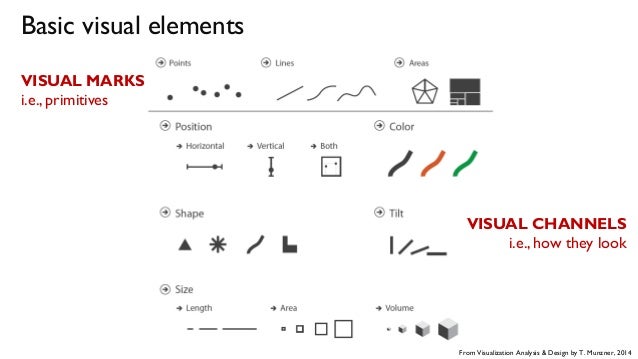
Visual Marks and Channels Diagram from Munzner: Visualization Analysis and Design
Usage
Since this project is mainly a specification of an in-memory JavaScript data structure, the library it provides is a program that will validate the data structure according to a set of constraints. Here's some example code that shows how to validate a dataset.
var ChiasmDataset = require("chiasm-dataset");

var dataset = {
  data: [
    { name: "Joe",  age: 29, birthday: new Date(1986, 11, 17) },
    { name: "Jane", age: 31, birthday: new Date(1985, 1, 15)  }
  ],
  metadata: {
    columns: [
      { name: "name", type: "string" },
      { name: "age", type: "number" },
      { name: "birthday", type: "date" }
    ]
  }
};

var promise = ChiasmDataset.validate(dataset);

promise.then(function (){
  console.log("This dataset successfully passed validation!");
}, function (err){
  console.log("This dataset failed validation with the following error: " + err.message);
});
Note that ChiasmDataset.validate returns a promise. See the tests for an enumeration of all possible validation failure errors.
Data Structure Reference
Each dataset object has two properties, data and metadata.
#dataset.data
An array of row objects. This contains all rows of the data table. This is the same data structure returned by d3-dsv after parsing strings into primitive types. Each row object has keys corresponding to column names and values for each cell of the data table. The values are represented in memory as the JavaScript primitive types corresponding the the declared column type.
#dataset.metadata
An object that describes the data table. This includes the properties isCube and columns.
#dataset.metadata.isCube
A property set to true if this dataset contains aggregated multidimensional data where each row represents a cell of a data cube. This value may be omitted or set to false if this dataset contains a relational data table where each row represents an individual entity or event.
When set to true, each row contains values for dimensions and measures. In this case, each column is interpreted as either as a dimension or measure, depending on the value of the isDimension property.
#dataset.metadata.columns
An array of column descriptor objects. Each of these objects must have the properties name, label and type. The order of these objects may be used in visualizations (e.g. to define the order of axes in parallel coordinates, or the order of columns in an Excel-like table representation).
If isCube is true, then each of these objects may have the properties isDimension and interval.
#dataset.metadata.columns[i].name
The name of the column. This corresponds to the keys in each row object of dataset.data.
#dataset.metadata.columns[i].label
The label of the column. This is a human-readable string that may be used in user interface elements that represent the column such as column selection widgets or axis labels in visualizations.
#dataset.metadata.columns[i].type
The type of the column. This is a string, and must be either "number", "string", or "date".
#dataset.metadata.columns[i].isDimension
If this property is set to true, then this column represents a data cube dimension. This property is only relevant if isCube is set to true.
If the column represents a dimension and is of type "number" or "date", then it is assumed to represent the result of binned aggregation. In this case, the interval property must be defined.
#dataset.metadata.columns[i].interval
The interval between bins. This property is only relevant if:
- the dataset is aggregated (isCube ==
true) and - the column is a dimension (isDimension is true), and
- the column type is either "number" or "date".
If the column type is "number", then this property is expected to be a number. This is the width of the numeric bins used, for example, in a histogram or heat map. Only fixed-width numeric binning is supported (variable width binning is not supported at this time).
If the column type is "date", then this property is expected to be a string corresponding to one of the interval types defined in d3-time. This includes, for example, "minute", "hour", "day", "week", "month", and "year".
Variable width intervals are planned to be supported in the future.
#dataset.metadata.columns[i].domain
The domain of this column. This corresponds to the notion of domain in D3 scales.
If the column type is "string", then the domain is an array of unique string values that occur in the column. The ordering of these strings will determine, for example, the postion of bars in a bar chart, or the order in which values are mapped to colors using color scales.
If the column type is "number", then the domain is an array containing two numbers, the minimum (domain[0]) and the maximum (domain[1]). This is how numeric domains are typically represented in D3 numeric scales.
If the column type is "date", then the domain is an array containing two JavaScript Date objects, the minimum (domain[0]) and the maximum (domain[1]). This is how temporal domains are typically represented in D3 time scales.
Related Work
This library is essentially a data frame for JavaScript, similar in many ways to:
The following libraries touch upon some related aspects, such as data transformation and data-to-visualization mapping:
- Datalib A powerhouse for parsing and transforming data.
- Voyager This project implements automatic mapping from data to visualization, based on explicitly represented knowledge of compatibilities between column types and visual encodings.
- Plywood This can parse "split-apply-combine" data transformation expressions and evaluate them in memory or in a database.
I hope I'm not reinventing the wheel here. If you know of any JavaScript data frame library that solves the same problems as this one, please open a GitHub issue.
Roadmap
The overall goal of this project is to serve as the core data structure exchanged between Chiasm components for representing tabular data. The following issues comprise the roadmap: