
chrome-debugger-mcp
v1.0.4
Published
Chrome breakpoint debugging MCP server for inspecting runtime values and stepping through code
Maintainers
 bitepro
Readme
chrome-debugger-mcp
English
Breakpoint-driven Chrome debugging for MCP clients.
chrome-debugger-mcp exposes Chrome DevTools Protocol debugging primitives as MCP tools. It lets an agent attach to a real Chrome tab, pause on breakpoints or debugger;, inspect scope variables, evaluate expressions inside the paused frame, step through code, and resume with runtime facts instead of guessing from static source.
It is not a general browser automation server. The focus is runtime debugging.
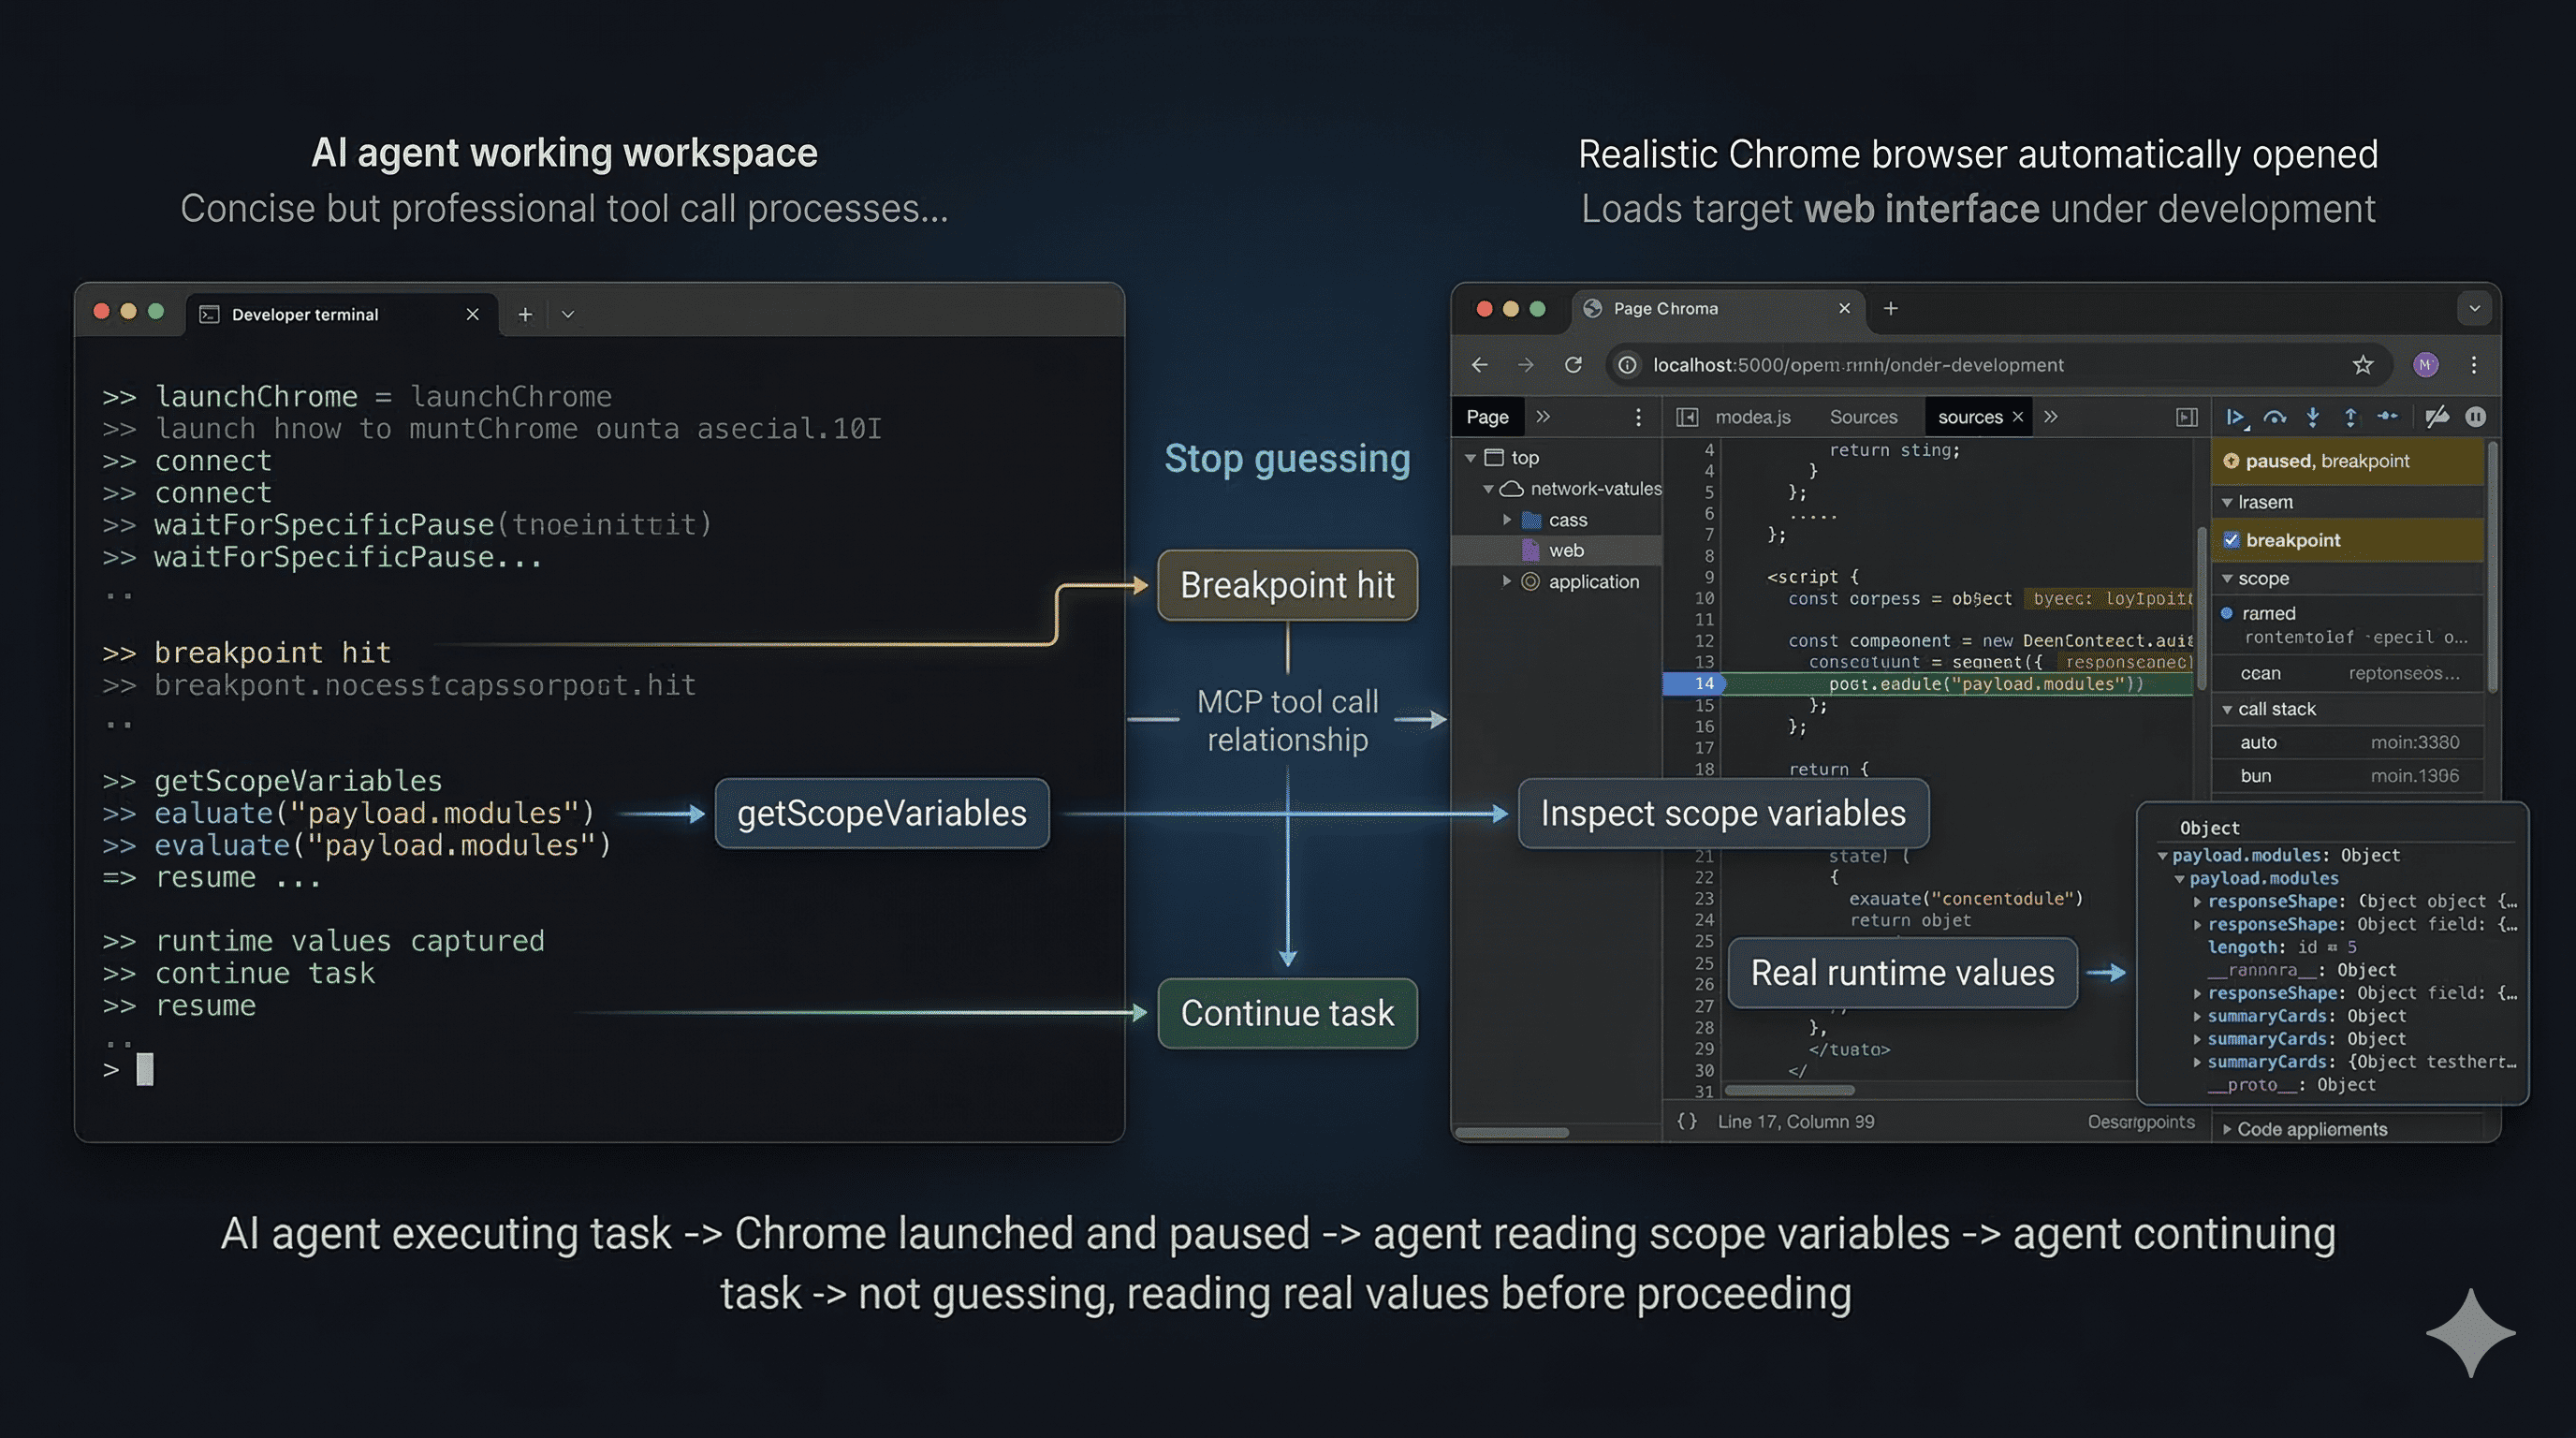
Demo: the agent launches Chrome, waits for a breakpoint, inspects real scope variables, and resumes with runtime facts.
MCP Client Configuration
Use the published package directly:
{
  "mcpServers": {
    "chrome-debugger": {
      "command": "npx",
      "args": ["-y", "chrome-debugger-mcp"]
    }
  }
}
No local build step is required for normal usage.
Quick Start
- Add the MCP config above and reload your MCP client.
- Ask the agent to start a debugging session and show the available Chrome tabs before connecting.
- Confirm the exact target page URL when the agent calls
listTargets(). - Add a temporary
debugger;statement in local source code, or ask the agent to callsetBreakpoint(). - Reload the page and immediately wait for the pause with
waitForSpecificPause()orwaitForPause(). - Inspect runtime state with
getScopeVariables()andevaluate(), step if needed, then callresume().
Example prompt:
Use chrome-debugger-mcp to debug my app.
Start with startDebuggingSession(), list the available Chrome tabs, wait for my confirmation before connect(), then help me pause in App.jsx, inspect runtime values, and resume when done.
Core Tools
startDebuggingSession: returns the recommended debugging flow and behavior rules for the agentlaunchChrome: launches a dedicated Chrome instance with remote debugging enabledlistTargets: lists available Chrome tabs and requires explicit user selectionconnect: attaches to the confirmed target tabsetBreakpointandremoveBreakpoint: manage CDP breakpoints without editing source filesreloadPage: reloads the current page through CDPwaitForSpecificPause: waits for the next pause and matches by file plus line tolerance ordebugger-statementwaitForPause: waits for any pause when exact location matching is not neededgetScopeVariables: reads local, closure, and module scope values from the paused frameevaluate: runs JavaScript in the paused call framestepInto,stepOver,stepOut: standard step controlsresume: resumes execution after inspectiongetStatus: polls connected and paused state for clients with short request timeoutsforcePause: requests a pause at the next JavaScript statement
Usage Guidance
- Start with
startDebuggingSession()when integrating this server into an agent workflow. - Always call
listTargets()and wait for explicit user confirmation beforeconnect(). - Prefer
waitForSpecificPause()when you know the target file or line. - After
reloadPage(), callwaitForSpecificPause()orwaitForPause()in the same turn. - Use
getScopeVariables()andevaluate()before drawing conclusions from static source. - Always call
resume()after inspection. - Remove any temporary
debugger;statements before finishing.
Important Notes
- Requirements: local Google Chrome, an MCP client that supports stdio servers and tool calling, and source access if you plan to insert
debugger;. launchChrome()uses a dedicated profile so it does not interfere with the user's normal browser session.- Default launch settings are remote debugging port
9222and profile directory~/.chrome-debug-profile. - If automatic launch fails, the tool returns a command you can run manually.
- Bundlers and source maps can shift compiled line numbers, so
waitForSpecificPause()also matchesdebugger-statementpauses. - If your MCP client has short request timeouts, use
getStatus()to poll state.
License
MIT
中文
一个面向 MCP 客户端的 Chrome 断点调试服务。
chrome-debugger-mcp 把 Chrome DevTools Protocol 的核心调试能力暴露为 MCP 工具,让 agent 可以连接真实的 Chrome 标签页,在断点或 debugger; 处暂停,读取作用域变量,在当前暂停帧中执行表达式,单步跟踪代码,并基于真实运行时值继续工作,而不是只靠静态源码猜测行为。
它不是通用浏览器自动化服务。它的重点是运行时调试。
演示流程:agent 拉起 Chrome,等待断点命中,读取真实作用域变量,再基于运行时事实继续执行。
MCP 客户端配置
直接使用已发布包:
{
  "mcpServers": {
    "chrome-debugger": {
      "command": "npx",
      "args": ["-y", "chrome-debugger-mcp"]
    }
  }
}
正常使用时不需要本地构建。
快速使用
- 添加上面的 MCP 配置,并重新加载你的 MCP 客户端。
- 让 agent 先启动调试会话,并在连接前展示可用的 Chrome 标签页。
- 当 agent 调用
listTargets()后,明确确认要调试的页面 URL。 - 在本地源码里临时加入
debugger;,或者让 agent 调用setBreakpoint()。 - 重载页面后,立刻调用
waitForSpecificPause()或waitForPause()等待暂停。 - 用
getScopeVariables()和evaluate()检查运行时状态,必要时单步跟踪,最后调用resume()。
示例提示词:
使用 chrome-debugger-mcp 帮我调试这个应用。
先调用 startDebuggingSession(),列出可用的 Chrome 标签页,在我确认之前不要 connect(),然后帮我在 App.jsx 里暂停、检查运行时值,最后恢复执行。
核心工具
startDebuggingSession:返回推荐调试流程和 agent 行为规则launchChrome:启动带远程调试能力的独立 Chrome 实例listTargets:列出可调试的 Chrome 标签页,并要求用户明确选择connect:连接到已经确认的目标标签页setBreakpoint和removeBreakpoint:无需改源码即可管理 CDP 断点reloadPage:通过 CDP 重载当前页面waitForSpecificPause:等待下一次暂停,并按文件加行号容差或debugger-statement进行匹配waitForPause:在不需要精确位置匹配时等待任意暂停getScopeVariables:读取当前暂停帧中的 local、closure、module 作用域变量evaluate:在当前暂停调用帧中执行 JavaScriptstepInto、stepOver、stepOut:标准单步控制resume:检查完毕后恢复执行getStatus:给超时较短的客户端轮询连接和暂停状态forcePause:请求在下一条 JavaScript 语句处暂停
使用建议
- 在把这个服务接入 agent 工作流时,先调用
startDebuggingSession()。 - 调用
connect()之前一定先执行listTargets(),并等待用户明确确认。 - 已知目标文件或行号时,优先使用
waitForSpecificPause()。 - 调用
reloadPage()后,要在同一轮里立刻调用waitForSpecificPause()或waitForPause()。 - 能读取运行时值时,优先使用
getScopeVariables()和evaluate(),不要只看静态代码下结论。 - 检查完成后一定要调用
resume()。 - 如果加入了临时
debugger;,结束前要清理掉。
注意事项
- 运行要求:本机安装 Google Chrome,MCP 客户端支持 stdio server 和工具调用;如果要插入
debugger;,还需要能访问本地源码。 launchChrome()使用独立 profile,不会影响用户平时正在使用的浏览器会话。- 默认启动参数是远程调试端口
9222,profile 目录是~/.chrome-debug-profile。 - 如果自动启动失败,工具会返回一条可以手动执行的命令。
- 打包和 source map 可能导致编译后行号偏移,所以
waitForSpecificPause()也会匹配debugger-statement暂停。 - 如果 MCP 客户端请求超时时间较短,可以用
getStatus()轮询状态。
许可证
MIT