
competency-radar-chart
v1.0.0
Published
Configurable competency / skills radar chart renderer (SVG, PNG, HTML) with category bands, level rings and multiple profiles
Downloads
133

Maintainers
 anatoly.sakhno
Readme
competency-radar-chart
Render competency / skills radar charts as SVG, PNG or HTML from a single JSON config: level rings with their own legend, skills grouped into coloured category bands, any number of overlaid profiles, a fully configurable colour scheme, and landscape or portrait output.
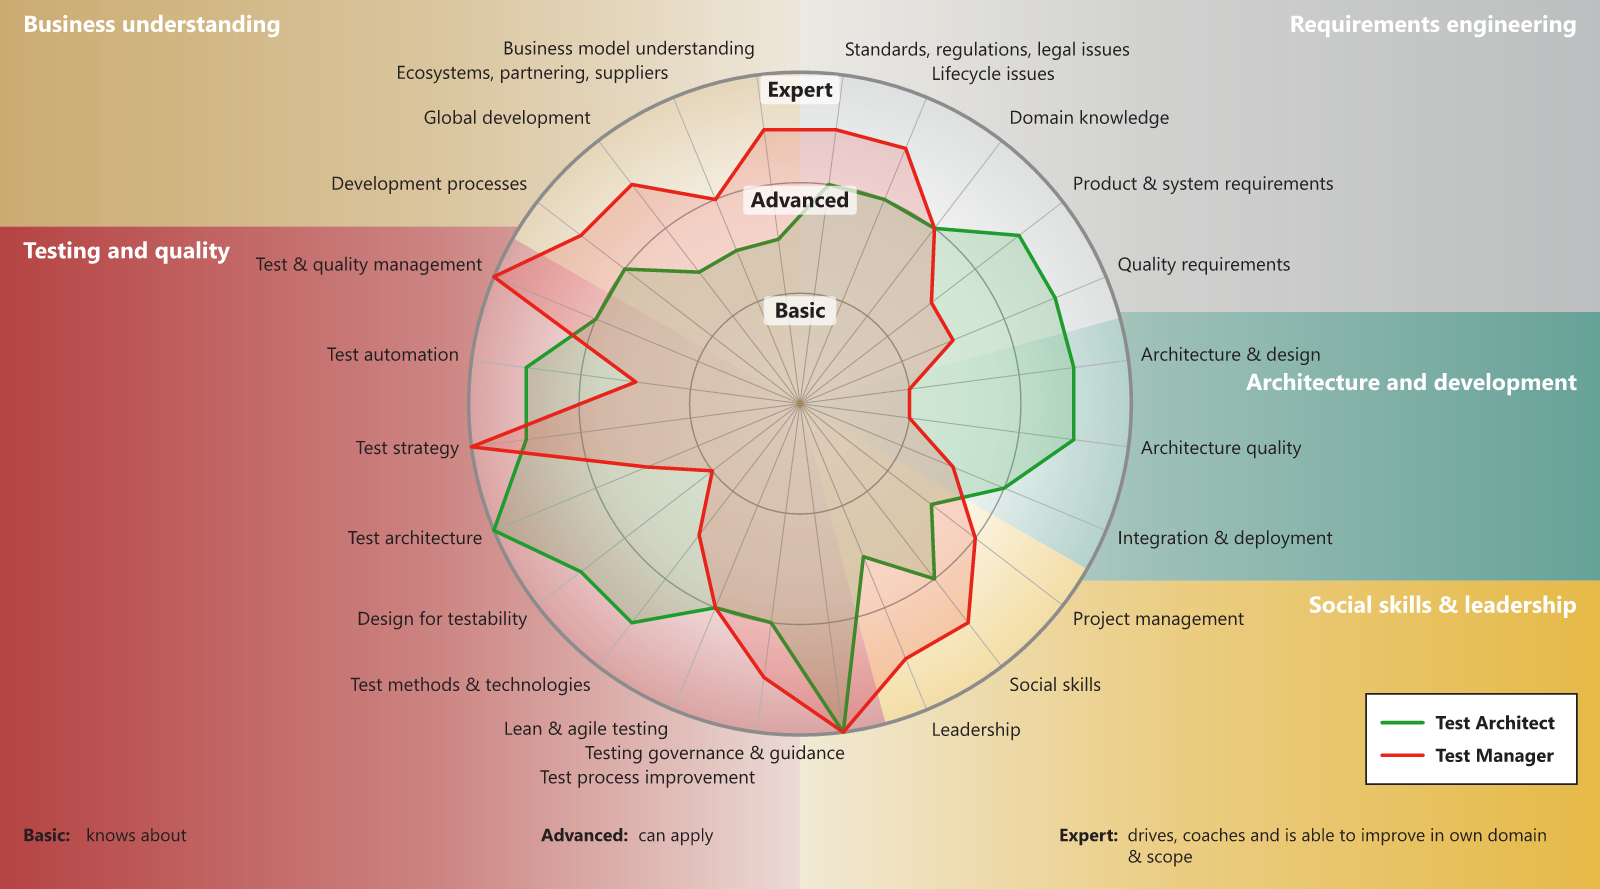
The core renderer has zero runtime dependencies — it writes SVG directly. PNG output
uses the optional @resvg/resvg-js.
Install
npm install competency-radar-chart

# for PNG output, also install the optional renderer
npm install @resvg/resvg-js
Or run it without installing:
npx competency-radar-chart -c my-radar.json -o out/radar.svgQuick start
# start your own chart from a template
npx competency-radar-chart init my-radar.json

# render it
npx competency-radar-chart -c my-radar.json -o out/radar.svg

# a high-resolution PNG
npx competency-radar-chart -c my-radar.json -o out/radar.png --png-width 2400

# the same data in portrait
npx competency-radar-chart -c my-radar.json -o out/radar.svg --orientation portrait
When working from a clone of this repo, node bin/cli.js … works the same way and the
bundled configs live in examples/.
CLI
competency-radar [render] -c <config.json> [-o <out.svg>] [options]
competency-radar init [file.json]

  -c, --config <file>    Config file (.json or .js)
  -o, --out <file>       Output file. Default: out/<config name>.svg
  -f, --format <fmt>     svg | png | html (default: from the output extension)
      --orientation <o>  landscape | portrait
      --width <px>       Canvas width
      --height <px>      Canvas height
      --title <text>     Chart title
      --profiles <a,b>   Render only these profiles, by name or id
      --scale <n>        PNG only: pixel scale factor (default 1)
      --png-width <px>   PNG only: output width in pixels (overrides --scale)
      --quiet            Suppress the summary line
Config problems are reported all at once, with the offending path:
Error: Invalid configuration:
  - skills["Testing"][2]: unknown category "Testng" (known: Testing, Delivery)
  - profiles[1].values["Test stratgy"]: unknown skill "Test stratgy"
Node API
const { renderChart, renderToFile, toHtml, toPng, normalize } = require('competency-radar-chart');

const svg = renderChart(config);                       // -> SVG string
renderToFile(config, 'out/chart.png', { width: 2400 }); // svg | png | html, by extension
const html = toHtml(svg, 'Skills radar');
const png = toPng(svg, { scale: 2 });                   // Buffer (needs @resvg/resvg-js)
const resolved = normalize(config);                     // validated config, throws ConfigError
Configuration
Everything below is optional except categories, skills and profiles.
{
  "title": "Platform engineering competencies",   // optional heading
  "subtitle": "Team calibration - Q3",
  "orientation": "landscape",                     // "landscape" | "portrait"
  "width": 1800,                                  // overrides the orientation preset
  "height": 1000,

  "levels": [ ... ],
  "categories": [ ... ],
  "skills": { ... },
  "profiles": [ ... ],
  "colorScheme": { ... },
  "layout": { ... }
}
Levels
The rings, from the centre outwards. Accepts a count, a list of names, or objects with a description for the footer legend.
"levels": 5                                    // -> Level 1 .. Level 5
"levels": ["Basic", "Advanced", "Expert"]      // named, no footer legend
"levels": [
  { "name": "Basic",    "description": "knows about" },
  { "name": "Advanced", "description": "can apply" },
  { "name": "Expert",   "description": "drives, coaches and improves in own domain" }
]
Default: Basic / Advanced / Expert, as in the reference chart. 2–10 levels are supported; the footer strip grows automatically if the descriptions wrap.
Categories
Each category becomes one contiguous arc of the circle, a tinted wedge inside it, and a coloured banner band running to the edge of the canvas. Order is the drawing order, clockwise from the top.
"categories": [
  { "name": "Requirements engineering", "color": "#b9bcbd" },
  { "name": "Testing and quality",      "color": "#b23a3a", "labelColor": "#ffffff" },
  "Business understanding"                       // plain string: colour from the palette
]
| Field | Meaning |
| --- | --- |
| name | Label drawn in the band |
| id | Optional stable key, if two categories share a display name |
| color | Band, wedge and gradient colour. Defaults to colorScheme.categoryPalette |
| labelColor | Overrides colorScheme.categoryLabelColor for this band |
Skills
Either a map of category → skills (most compact), or a flat array. Both forms are regrouped into category order, so each category always owns one unbroken arc.
"skills": {
  "Requirements engineering": ["Domain knowledge", "Quality requirements"],
  "Testing and quality": [
    "Test strategy",
    { "name": "Test methods & technologies", "short": "Test methods", "id": "methods" }
  ]
}
"skills": [
{ "name": "Domain knowledge", "category": "Requirements engineering" },
{ "name": "Test strategy", "category": "Testing and quality" }
]short is used as the drawn label when the full name is too long; id is the key
profiles can refer to. Minimum 3 skills.
Profiles
The overlaid polygons. Values are level numbers (fractions allowed, e.g. 2.5) or level
names. Skills you omit are treated as 0.
"profiles": [
  {
    "name": "Test Architect",
    "color": "#1f9c2e",
    "values": { "Test strategy": 2.5, "Domain knowledge": "Advanced" }
  },
  {
    "name": "Team average",
    "color": "#facc15",
    "strokeDasharray": "10 8",     // dashed outline, also shown in the legend
    "fillOpacity": 0.08,           // per-profile override
    "strokeWidth": 3,
    "values": { "Test strategy": 1.8 }
  }
]
Render a subset without editing the file: --profiles "Test Manager" (works against
examples/test-roles.json in a clone of this repo).
Colour scheme
Every colour is overridable; anything you leave out keeps its default.
| Key | Default | Used for |
| --- | --- | --- |
| background | #f2efe9 | Canvas |
| chartBackground | #ffffff | Disc behind the wedges, and the level-label halo |
| textColor | #231f20 | Skill labels, legend and footer |
| categoryLabelColor | #ffffff | Category names in the bands |
| levelLabelColor | #231f20 | Basic / Advanced / Expert |
| ringColor / outerRingColor | #9a9a9a / #8c8c8c | Level rings, outer ring |
| spokeColor | #b3b3b3 | Radial axes |
| centerDotColor | #b09a72 | Centre dot |
| legendBackground / legendBorder | #ffffff / #231f20 | Profile legend box |
| categoryPalette | 10 colours | Fallback for categories without color |
| profilePalette | 6 colours | Fallback for profiles without color |
| wedgeOpacity | 0.55 | Category tint inside the circle |
| bandOpacity | 0.95 | Banner bands |
| profileFillOpacity | 0.16 | Polygon fill |
| profileStrokeWidth | 4 | Polygon outline |
examples/engineering-competencies.json shows a full dark theme.
Layout
Fine-tuning, all optional:
| Key | Default | Meaning |
| --- | --- | --- |
| fontFamily | Segoe UI stack | Font for the whole chart |
| margin | 26 | Canvas margin |
| radiusScale | 1 | Shrink (< 1) or grow the circle |
| skillLabelSpace | 0.26 landscape / 0.215 portrait | Side gutter for skill labels; a fraction of the width, or pixels if > 1 |
| startAngle | -90 | Angle of the first spoke (-90 = up) |
| angleOffset | 0.5 | Rotation in steps; 0.5 leaves a gap on the vertical axis for the level labels |
| skillFontSize / categoryFontSize / levelFontSize / legendFontSize / footerFontSize / titleFontSize | 21 / 26 / 24 / 21 / 20 / 34 | Type sizes |
| skillLabelGap | 14 | Distance from the outer ring to the labels |
| legendPosition | bottom-right | top-left, top-right, bottom-left, bottom-right |
| showBands, showWedges, showRings, showSpokes, showLevelLabels, showProfileLegend, showLevelLegend | true | Toggle chart furniture |
| showPoints / pointRadius | false / 5 | Markers on each polygon vertex |
Setting showBands: false and showWedges: false gives a plain radar with no category
colouring.
Layout behaviour
A few things the renderer works out on its own, so arbitrary configs stay readable:
- Category bands are projected onto the canvas edge from each category's arc, then normalised so the bands on a side tile the full height with no gaps — including a category that wraps past the top or bottom of the circle (as "Testing and quality" does in the example).
- Skill labels anchor away from the circle, take the full canvas width when they sit on the vertical axis, and slide clear of each other when spokes are crowded.
- Category labels sit at the top outer corner of their band and slide down it until they clear the skill labels and the legend.
- The circle is sized to leave headroom for the labels above and below it, and the footer grows to fit however far the level descriptions wrap.
Examples
| File | Shows |
| --- | --- |
| examples/test-roles.json | The reference chart: 24 skills, 5 categories, 3 levels, 2 profiles |
| examples/engineering-competencies.json | 5 levels, dark colour scheme, dashed profile, vertex markers, portrait |
From a clone of this repo:
npm run examples     # renders every example to out/, in both orientations
npm test             # 29 assertions, no test framework needed
Licence
MIT — see LICENSE.