
copilot-lens
v1.2.2
Published
A local dashboard to visualize and analyze your GitHub Copilot CLI sessions
Maintainers
 pavanvamsi
Readme
Copilot Lens 👓
Your Copilot history has answers. Now you can actually find them.
A local memory layer for AI coding assistants. Search and browse everything you've ever discussed with Copilot CLI, VS Code Copilot Chat, or Claude Code. All on your machine. No cloud, no sign-in.
Install
npx copilot-lens --openOr npm install -g copilot-lens for a permanent install.
Usage
copilot-lens                  # Web dashboard at localhost:3000
copilot-lens --open           # Open browser automatically
copilot-lens --port 8080
copilot-lens tokens           # Token usage in the terminal (Ink TUI)
copilot-lens tokens --json    # Machine-readable output
Features
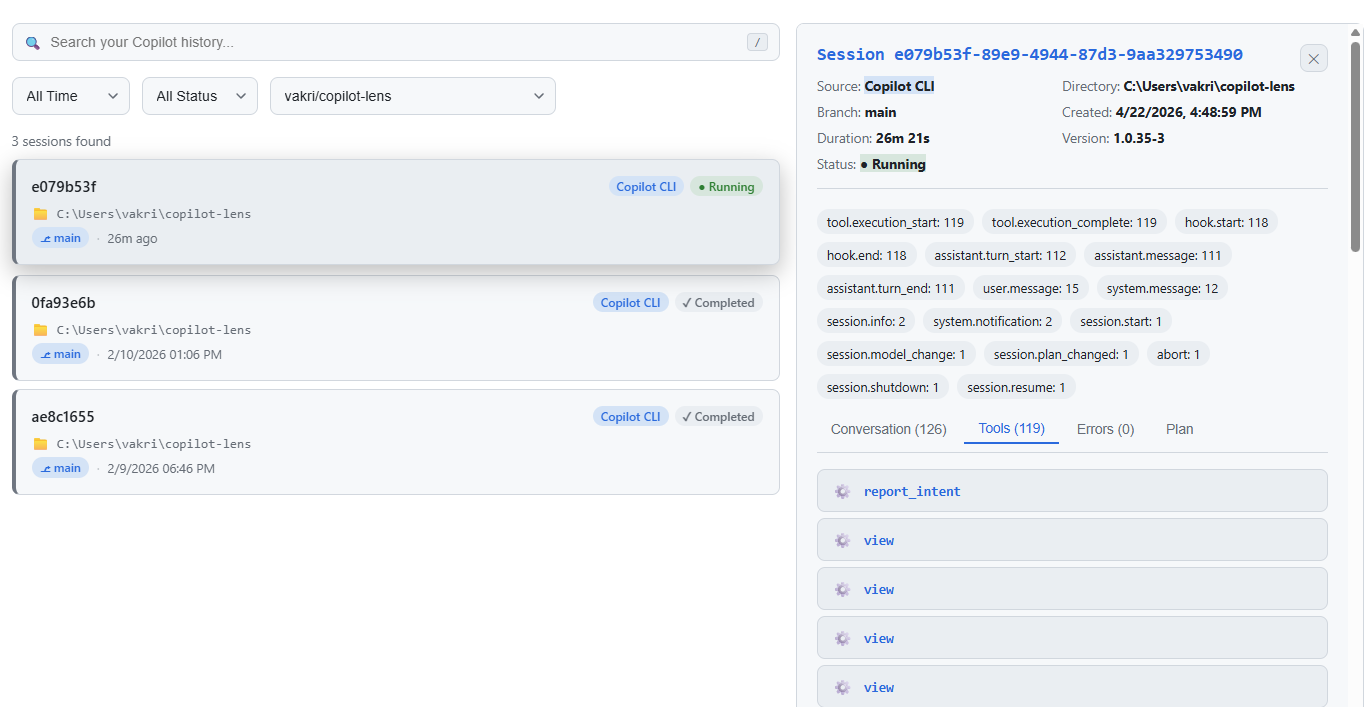
- Search: full-text across every session, with source/date/directory filters
- Sessions: unified browser for Copilot CLI, VS Code Copilot Chat, and Claude Code conversations, including extended-thinking blocks where supported
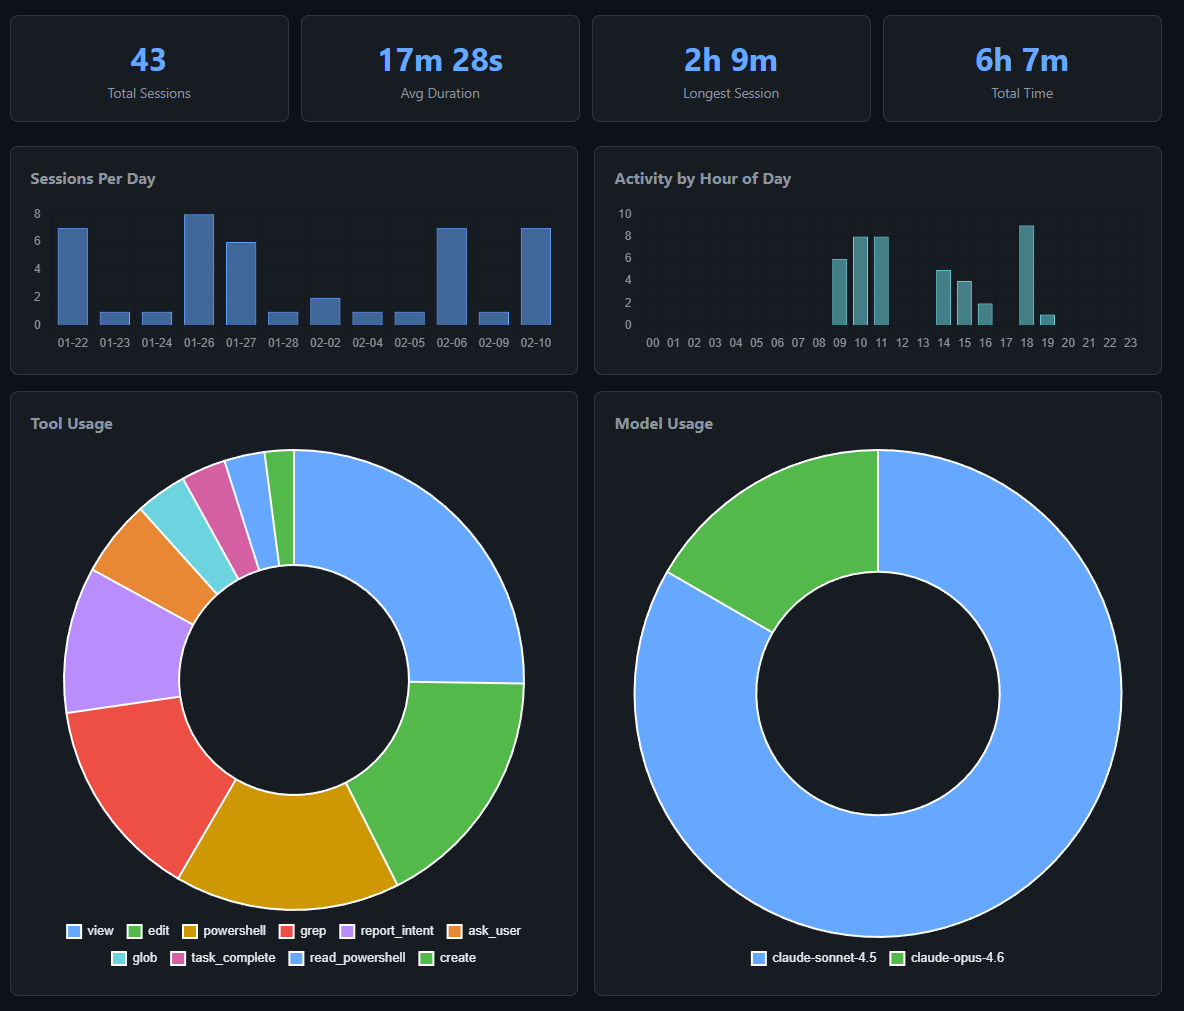
- Analytics: eight charts covering daily activity, hour-of-day, tools, models, top directories, time per branch/repo, and MCP servers
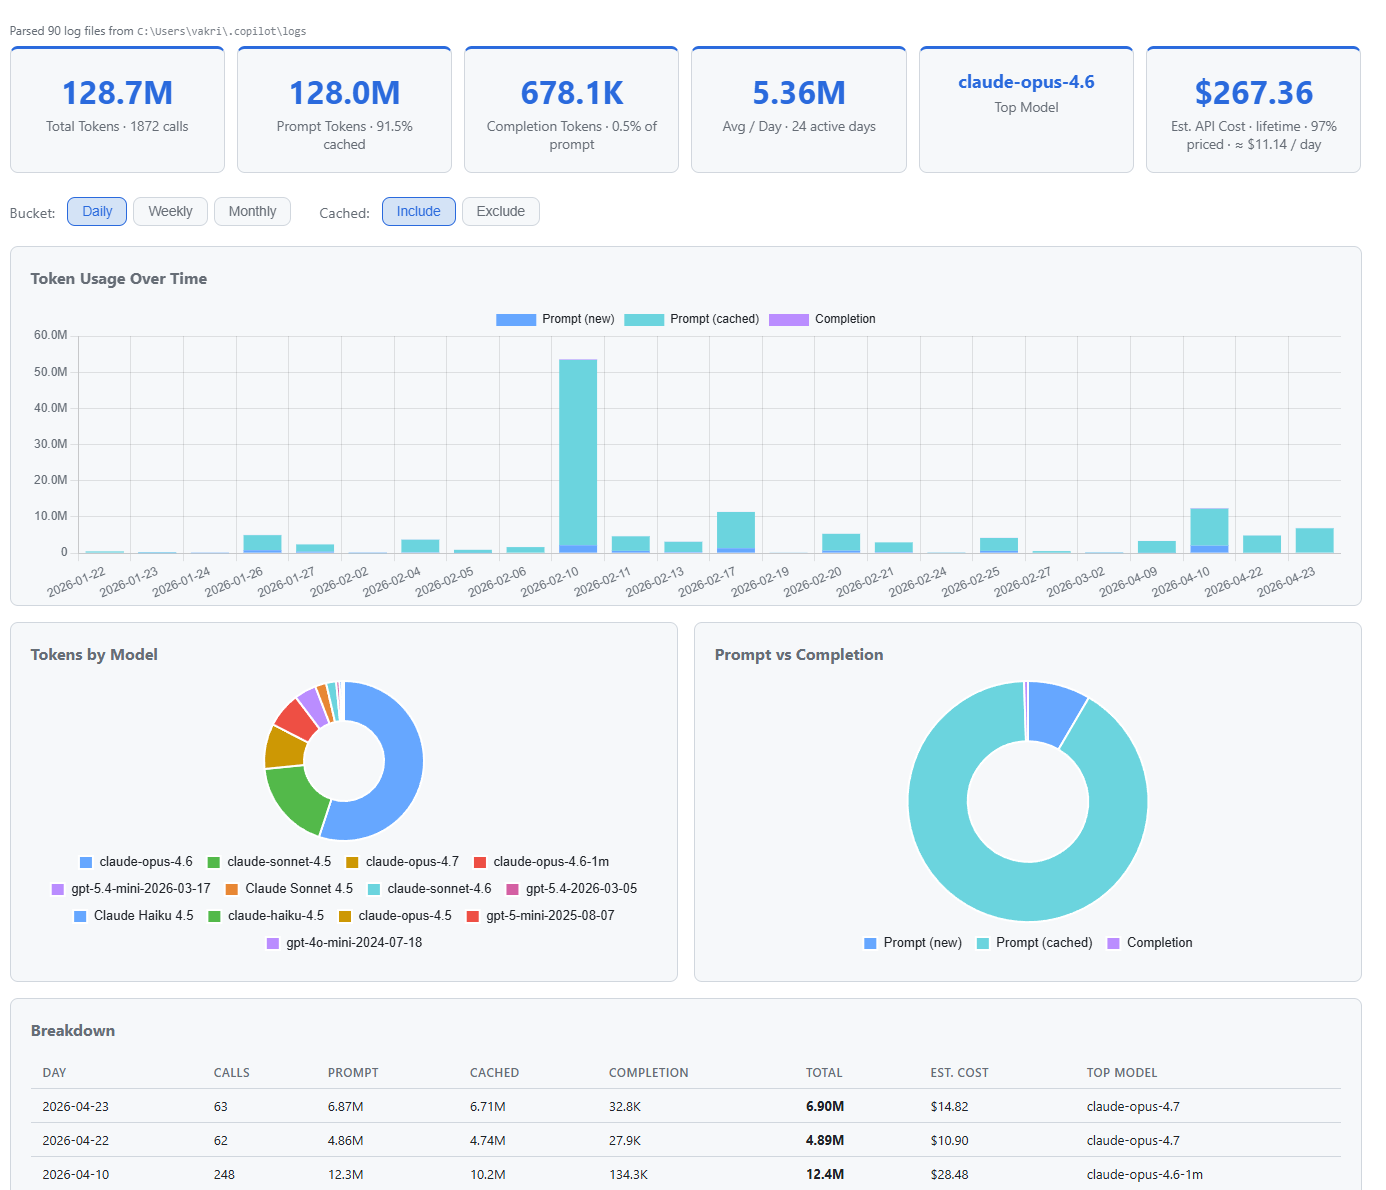
- Tokens: real API-reported token usage parsed from local logs, with daily/weekly/monthly views, model breakdown, and an estimated upstream API cost
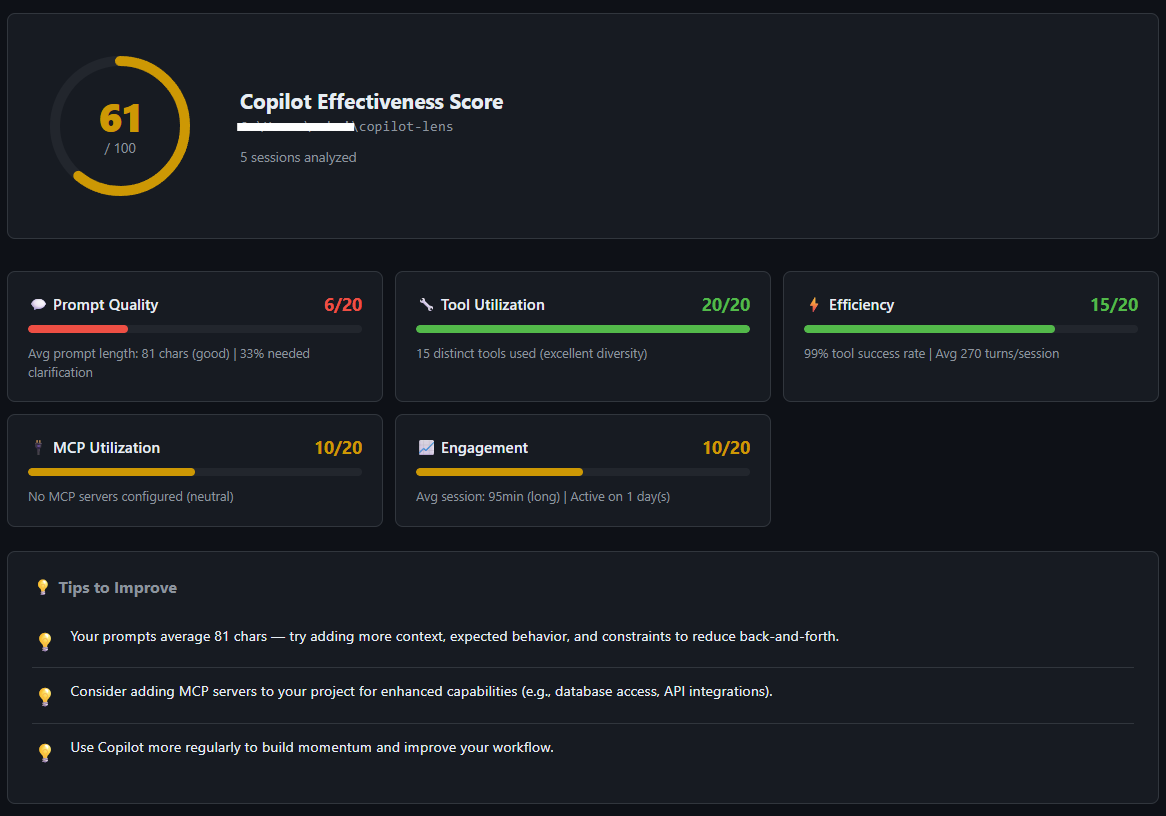
- Effectiveness Score: 0 to 100 score per repo with improvement tips
- Export: single-session OpenAI-style chat JSONL, suitable as SFT data
Sessions
Analytics
Tokens
Effectiveness Score
About the cost number: GitHub Copilot bills on premium requests, not tokens. The cost shown is what you'd pay calling Anthropic / OpenAI / Google directly with the same usage. Useful as a reference, not your GitHub bill.
Where the data comes from
| Source | Path |
|--------|------|
| Copilot CLI sessions | ~/.copilot/session-state/ |
| Copilot CLI token logs | ~/.copilot/logs/process-*.log |
| VS Code Copilot Chat | ~/Library/Application Support/Code/ (macOS), %APPDATA%/Code/ (Win), ~/.config/Code/ (Linux) |
| Claude Code | ~/.claude/projects/ |
VS Code Insiders is supported. Pasted images are stripped; files over 200MB are skipped. Durations exclude gaps longer than 5 minutes so paused sessions aren't inflated.
Development
git clone https://github.com/pavanvamsi3/copilot-lens.git
cd copilot-lens
npm install
npm run dev        # tsx, no build step
npm run build
npm test
Stack: Node + Express + TypeScript, vanilla frontend, Chart.js, Ink for the TUI, Vitest.
License
MIT