
copy-tui-chart
v3.7.0
Published
TOAST UI Application: Chart
Maintainers
 h1055619878
Readme

🍞📈 Spread your data on TOAST UI Chart. TOAST UI Chart is Beautiful Statistical Data Visualization library


![]()
![]()
Wrappers
- toast-ui.vue-chart: Vue wrapper component is powered by NHN.
- toast-ui.react-chart: React wrapper component is powered by NHN.


🚩 Table of Contents
- Collect statistics on the use of open source
- Browser Support
- True Cross Browser Charts
- Features
- Install
- Load
- Usage
- Development
- Documents
- Contributing
- TOAST UI Family
- Used By
- License
Collect statistics on the use of open source
TOAST UI Chart applies Google Analytics (GA) to collect statistics on the use of open source, in order to identify how widely TOAST UI Chart is used throughout the world. It also serves as important index to determine the future course of projects. location.hostname (e.g. > “ui.toast.com") is to be collected and the sole purpose is nothing but to measure statistics on the usage. To disable GA, use the following usageStatistics option when creating charts.
var options = {
  ...
  usageStatistics: false
}

tui.chart.barChart(container, data, options);
Or, include tui-code-snippet(v1.5.0 or later) and then immediately write the options as follows:
tui.usageStatistics = false;🌏 Browser Support
| Chrome | Internet Explorer | Edge | Safari | Firefox | | :---------: | :---------: | :---------: | :---------: | :---------: | | Yes | 8+ | Yes | Yes | Yes |
🌈 True Cross Browser Charts And It's Beautiful!
| IE8 | CHROME |
| --- | --- |
|  |
|  |
|
No one likes legacy, but sometimes it matters.
We started TOAST UI Chart because we could not find a project supporting legacy browsers, maintained reliably, and free for commercial use.
The visuals of the charts in IE8 are exactly as it looks in Chrome.
The TOAST UI Chart guarantees an identical look for all browsers. Draws fast and requires no polyfill, ToastUI uses of the native browser formats, such as SVG and RVML.
The TOAST UI Chart will continue to support legacy browsers under the MIT license
With over 50 releases since June 2015 under MIT License, the TOAST UI Chart is the answer if you have the same requirements as us.
🎨 Features
- Intuitive and easy to apply.
- Is an open-source JavaScript library.
- Can be used in legacy browsers including IE8.
- Change the chart in detail using many options and custom themes.
Single Charts
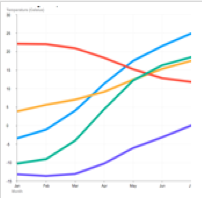
The TOAST UI Chart provides many types of charts to visualize the various forms of data.
| BarColumn | LineAreaRadial | BubbleScatter | Pie(General)Pie(Donut) |
| --- | --- | --- | --- |
|  |
|  |
|  |
|  |
|
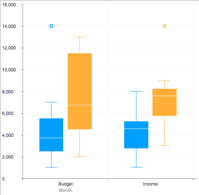
| HeatmapTreemap | Map | Boxplot | Bullet |
| --- | --- | --- | --- |
|  |
|  |
|  |
|  |
|
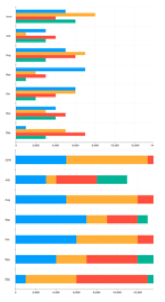
Combo Charts
The TOAST UI Chart covers complex data visualization.
| Column-Line | Pie-Donut | Line-Area | Line-Scatter |
| --- | --- | --- | --- |
|  |
|  |
|  |
|  |
|
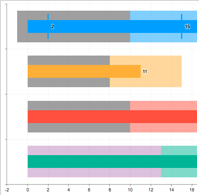
Customize
Visualize the data in different styles by customizing the details of the charts.
| Various expressions | Custom theme | Stack option | Diverging option | Group tooltip |
| --- | --- | --- | --- | --- |
|  |
|  |
|  |
| |
|  |
|
And More From Examples
Check out Example and wiki to discover more.
💾 Install
The TOAST UI products can be installed by using the package manager or downloading the source directly. However, we highly recommend using the package manager.
Via Package Manager
The TOAST UI products are registered in two package managers, npm and bower. Install by using the commands provided by each package manager. When using npm, be sure Node.js is installed in the environment.
npm
$ npm install --save tui-chart # Latest version
$ npm install --save tui-chart@<version> # Specific version
bower
$ bower install tui-chart # Latest version
$ bower install tui-chart#<tag> # Specific version
Via Contents Delivery Network (CDN)
The TOAST UI Chart is available over a CDN.
- You can use cdn as below.
<link rel="stylesheet" href="https://uicdn.toast.com/tui.chart/latest/tui-chart.min.css">
<script src="https://uicdn.toast.com/tui.chart/latest/tui-chart.min.js"></script>
The types of distribution files are classified into three types depending on whether or not they exist in the code of the dependency file.
tui-chart.js- This is not include dependency modules in the code.tui-chart-all.js- Includes all dependency modules, including 'babel-polyfill', in bundle file codetui-chart-polyfill.js- This includes only babel-polyfill in code.
Within the download you'll find the following directories
tui.chart/
├─ latest
│  ├─ tui-chart.js
│  ├─ tui-chart.min.js
│  ├─ tui-chart-all.js
│  ├─ tui-chart-all.min.js
│  ├─ tui-chart-polyfill.js
│  ├─ tui-chart-polyfill.min.js
│  ├─ tui-chart.css
│  ├─ tui-chart.min.css
│  ├─ maps/
│  │  ├── (china | japan | singapore | south-korea | taiwan | thailand | use | world).js
├─ v3.0.1/
Download Source Files
🔨 Usage
HTML
Add the container element where TOAST UI Chart will be created.
<div id="chart"></div>JavaScript
Load
The TOAST UI Chart can be used by creating an instance with the constructor function. To access the constructor function, import the module using one of the three following methods depending on your environment.
var chart = tui.chart; /* namespace */var chart = require('tui-chart'); /* CommonJS in Node.js */import chart from 'tui-chart'; /* ES6 in Node.js */Factory function needs three parameters: container, data, options
- container: Wrapper HTML element that will contain the chart as a child
- data: Numerical data the chart will be based on
- options: functional options including legend, alignment, and tooltip visibilities
var container = document.getElementById('chart-area');
var data = {
    category: [...], series: [...]
};
var options = {
    chart: {width: 700, height: 400}
};

chart.barChart(container, data, options);
Refer to details for additional informations.
🔧 Development
The TOAST UI products are open-source. After fixing issues, create a pull request(PR). Run npm scripts and develop with the following process.
Setup
Fork develop branch into your personal repository.
Clone to local computer.
Install node modules.
Before starting development, check for any errors.
$ git clone https://github.com/{username}/tui.chart.git
$ cd tui.chart
$ npm install
$ npm run test
Develop
Let's start development! Run a server and see the code reflected. Add test cases and then make them green.
Run webpack-dev-server
$ npm run serve
$ npm run serve:ie8 # Run on Internet Explorer 8
Run karma test
$ npm run testPull Request
Before creating a PR, test and check for any errors. If there are no errors, then commit and push!
For more information, please refer to the Contributing section.
$ npm run deploy
$ npm run test
📙 Documents
See the older versions of API page on the releases page.