
csv-to-datatable
v2.0.4
Published
Transform CSV files into beautiful, interactive HTML tables with 5 stunning themes, advanced search, sorting, pagination, and export options (Excel, PDF, CSV)
Maintainers
 mohanchinnappan
Readme
📊 CSV to DataTable Generator
Transform your CSV files into beautiful, interactive HTML tables with advanced features, stunning themes, Monaco SQL editor, AI sidekick, and a built-in HTTP server.
✨ Features
- 🎨 5 Beautiful Themes — Dark, Light, Neon, Purple, and Ocean
- 🔍 Advanced Search — Real-time filtering across all columns
- 📑 Smart Pagination — Customizable page sizes
- ↕️ Column Sorting — Click any header to sort
- 📤 Export Options — Copy, CSV, Excel, PDF, and Print
- 📱 Responsive Design — Works on all screen sizes
- 🖥️ Monaco SQL Editor — VS Code-grade SQL editor with autocomplete, dotted field support (
a.b.c), Ctrl+Enter to run - 📊 SQL Results as DataTable — Query results are sortable, searchable, and paginated
- 🤖 AI Sidekick — Ask questions about your data via Anthropic, OpenAI, or local Ollama models
- 🌐 Built-in HTTP Server — Serve the HTML over
http://localhostto eliminate CORS issues with Ollama - 💾 SQL History — Persisted per-table across sessions
- ⚡ Lightning Fast — Handles large datasets efficiently
- 🎯 Zero Configuration — Works out of the box
- 📥 stdin Support — Pipe data directly from other commands
Screenshot
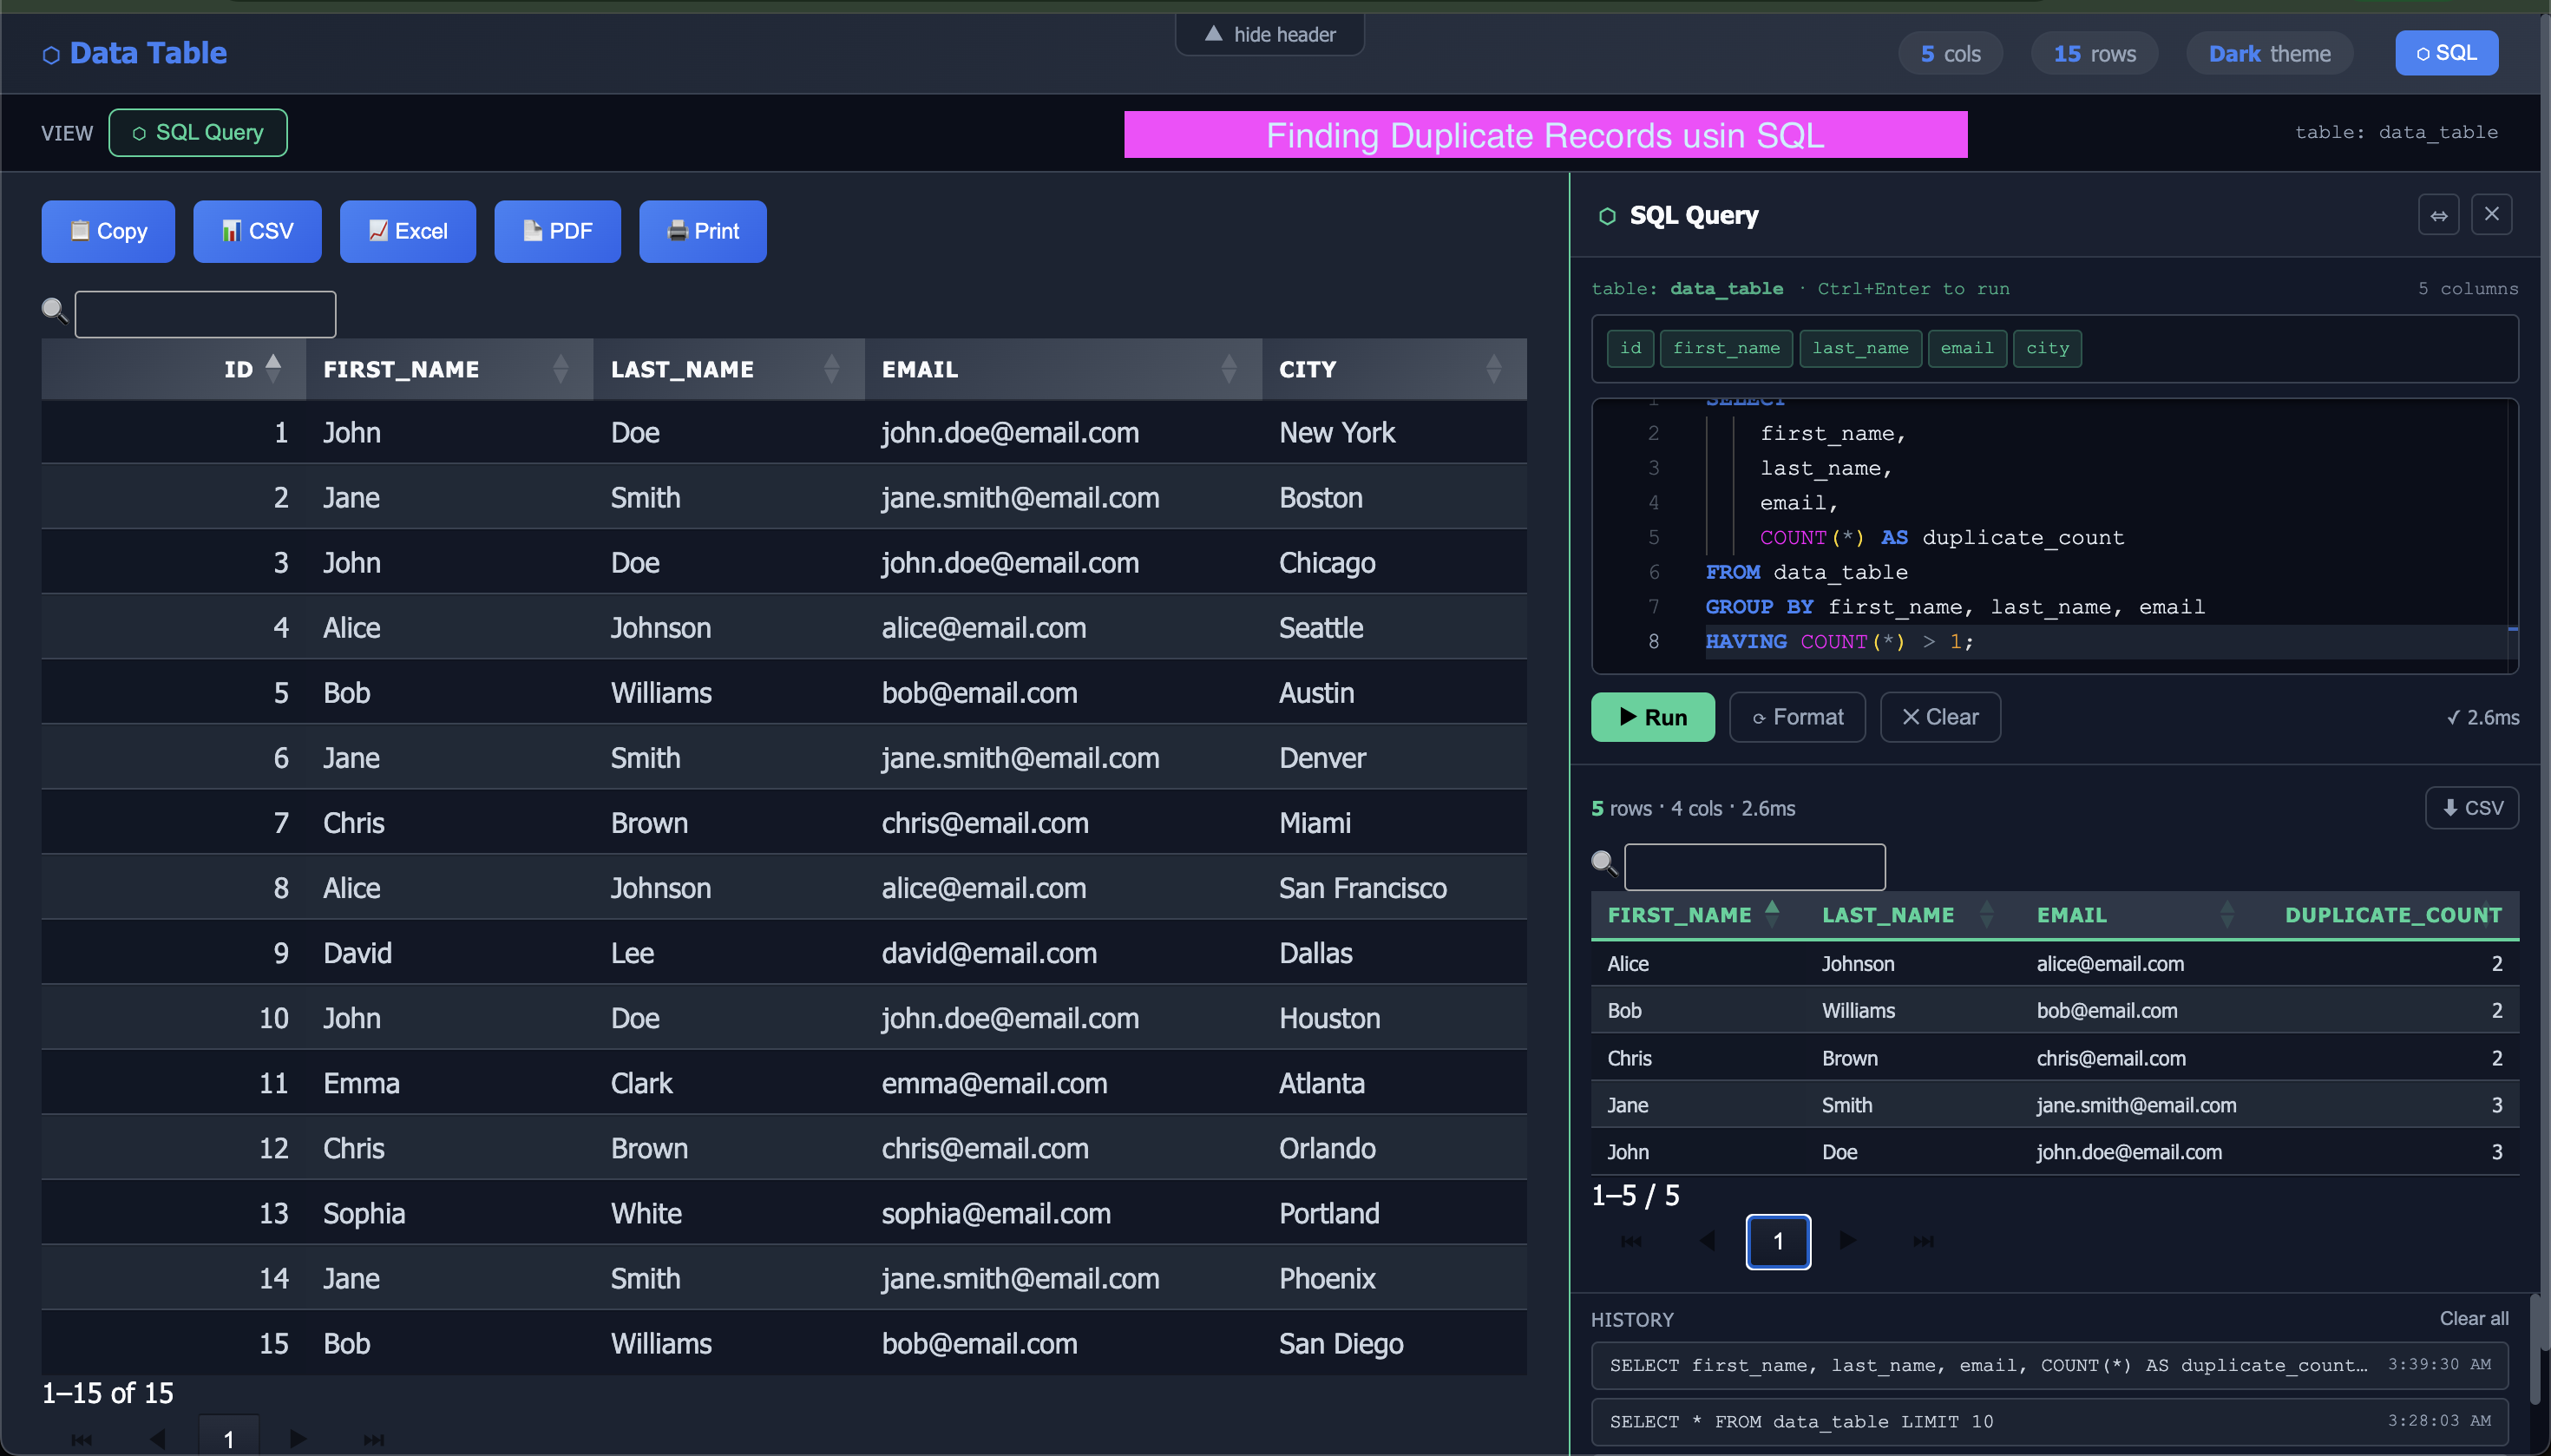
Finding Duplicates records using SQL
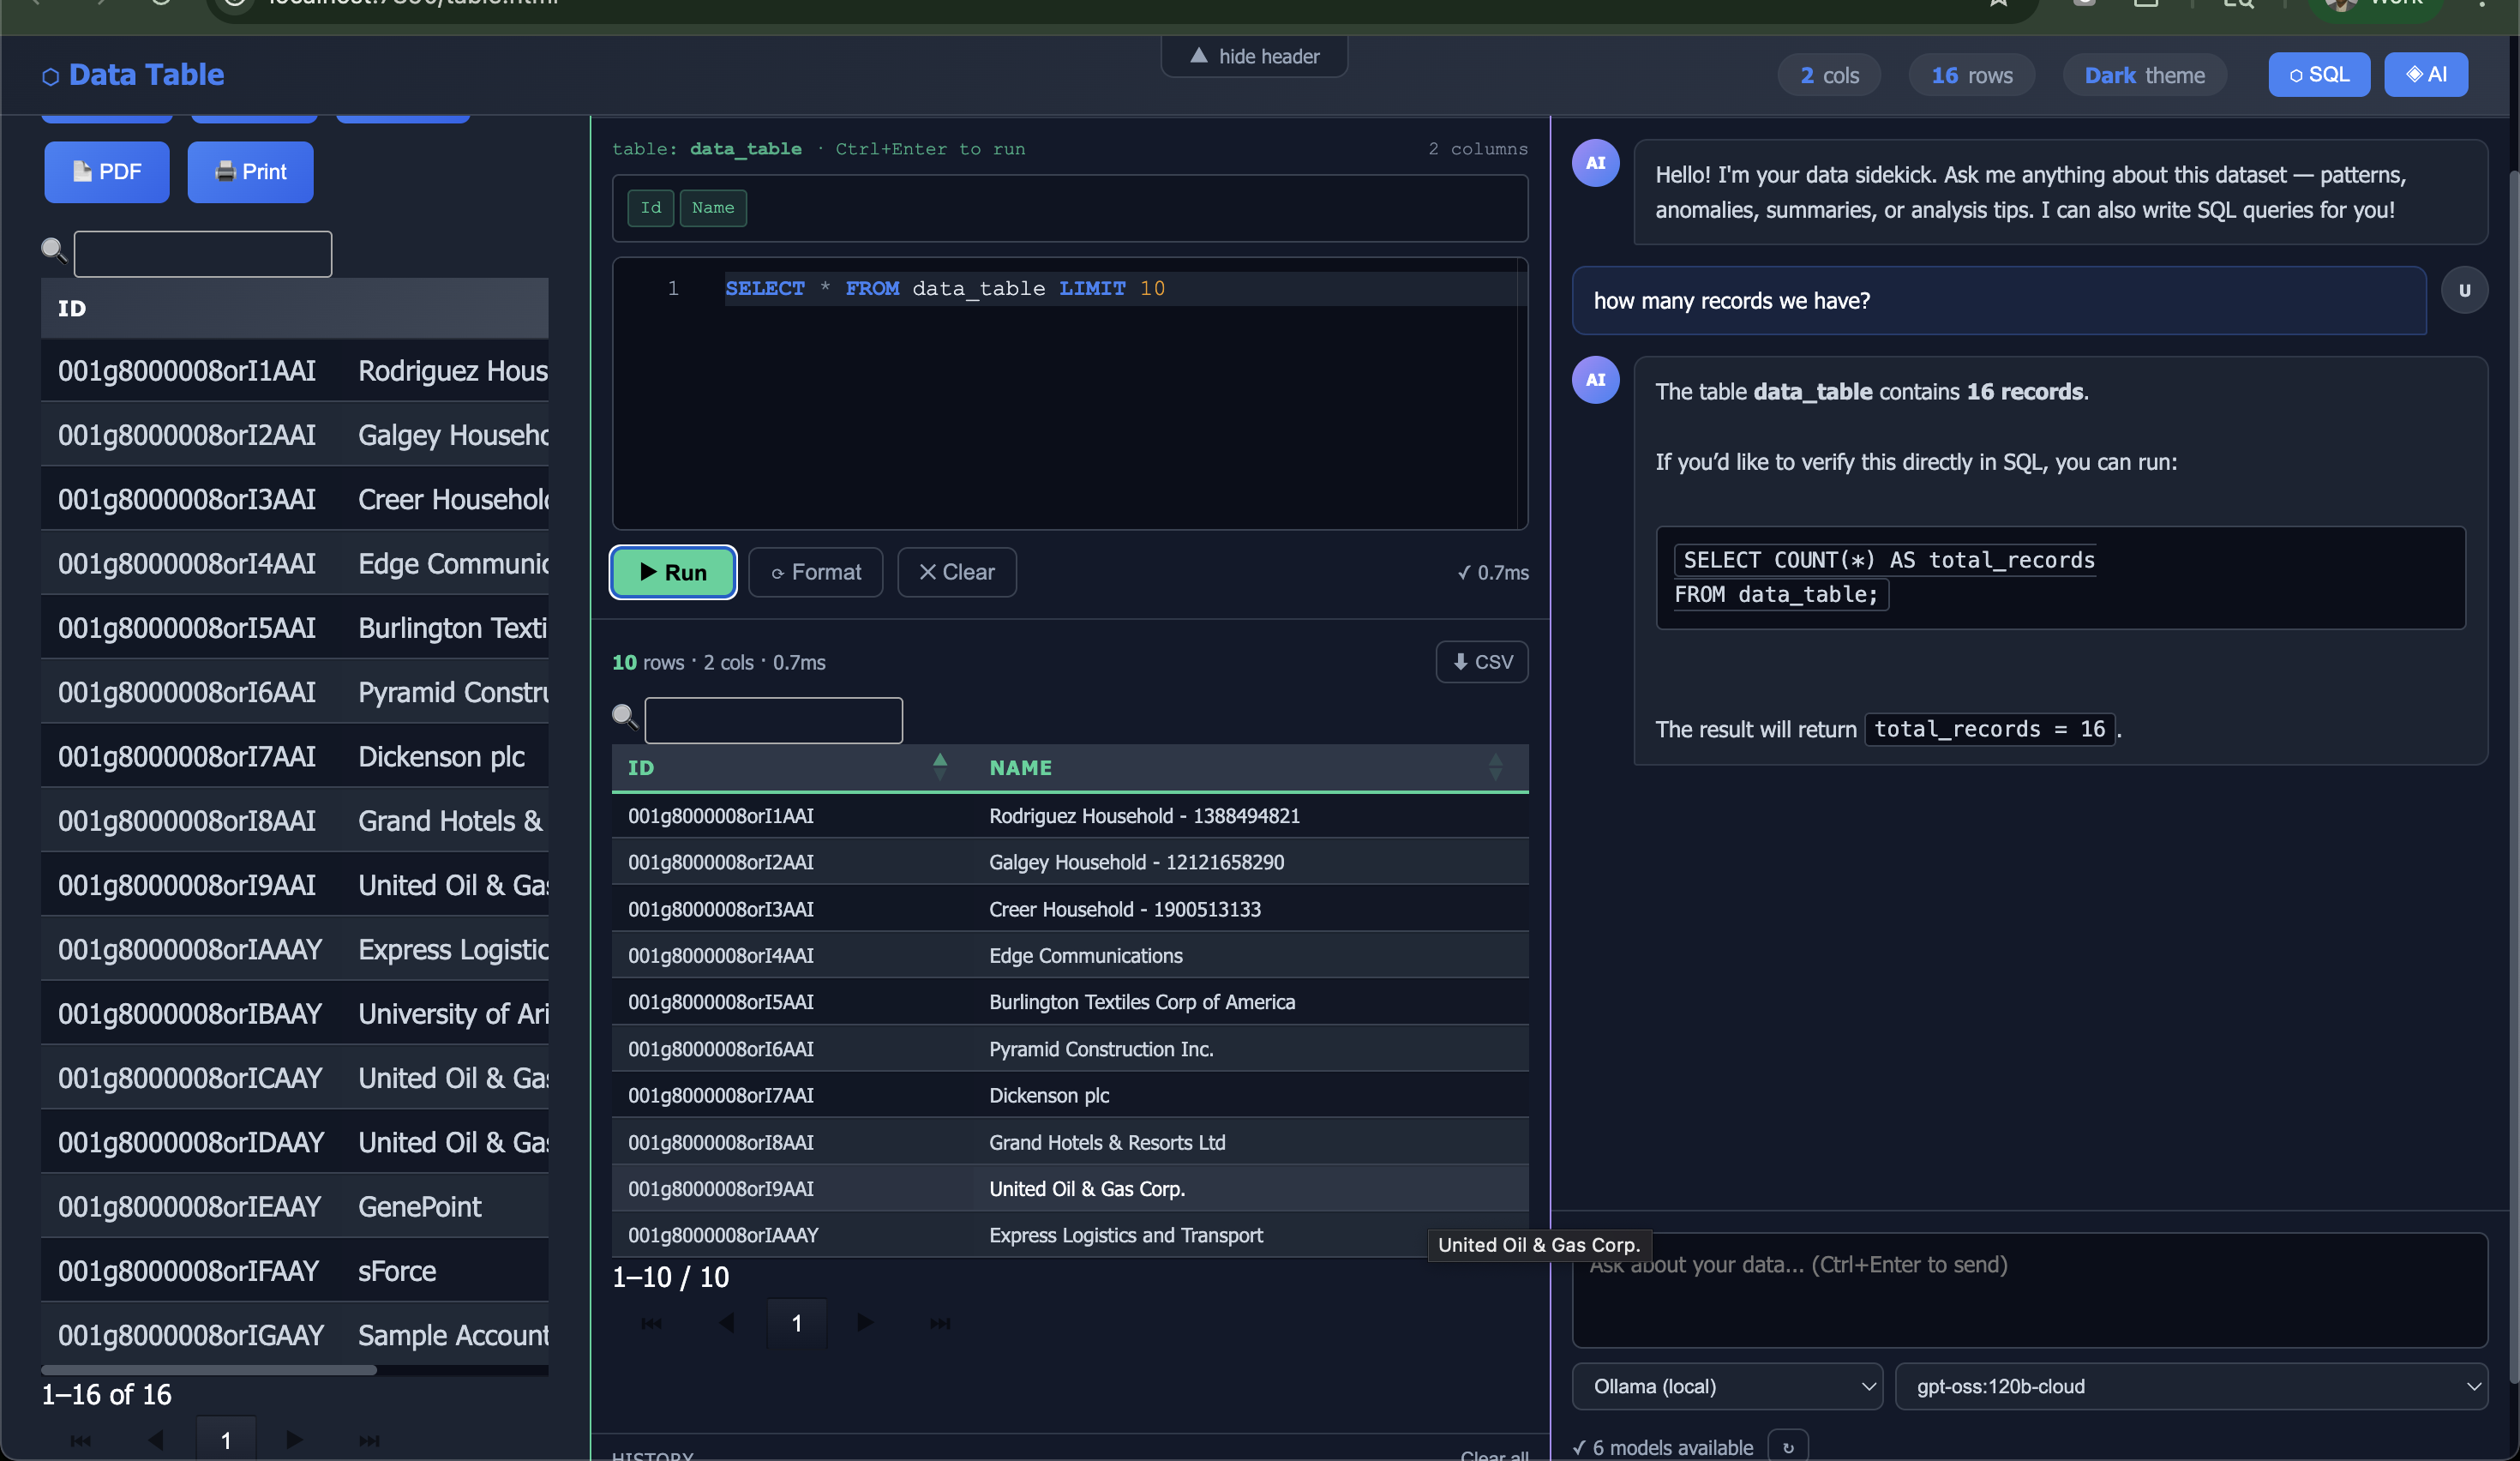
AI-Sidekick
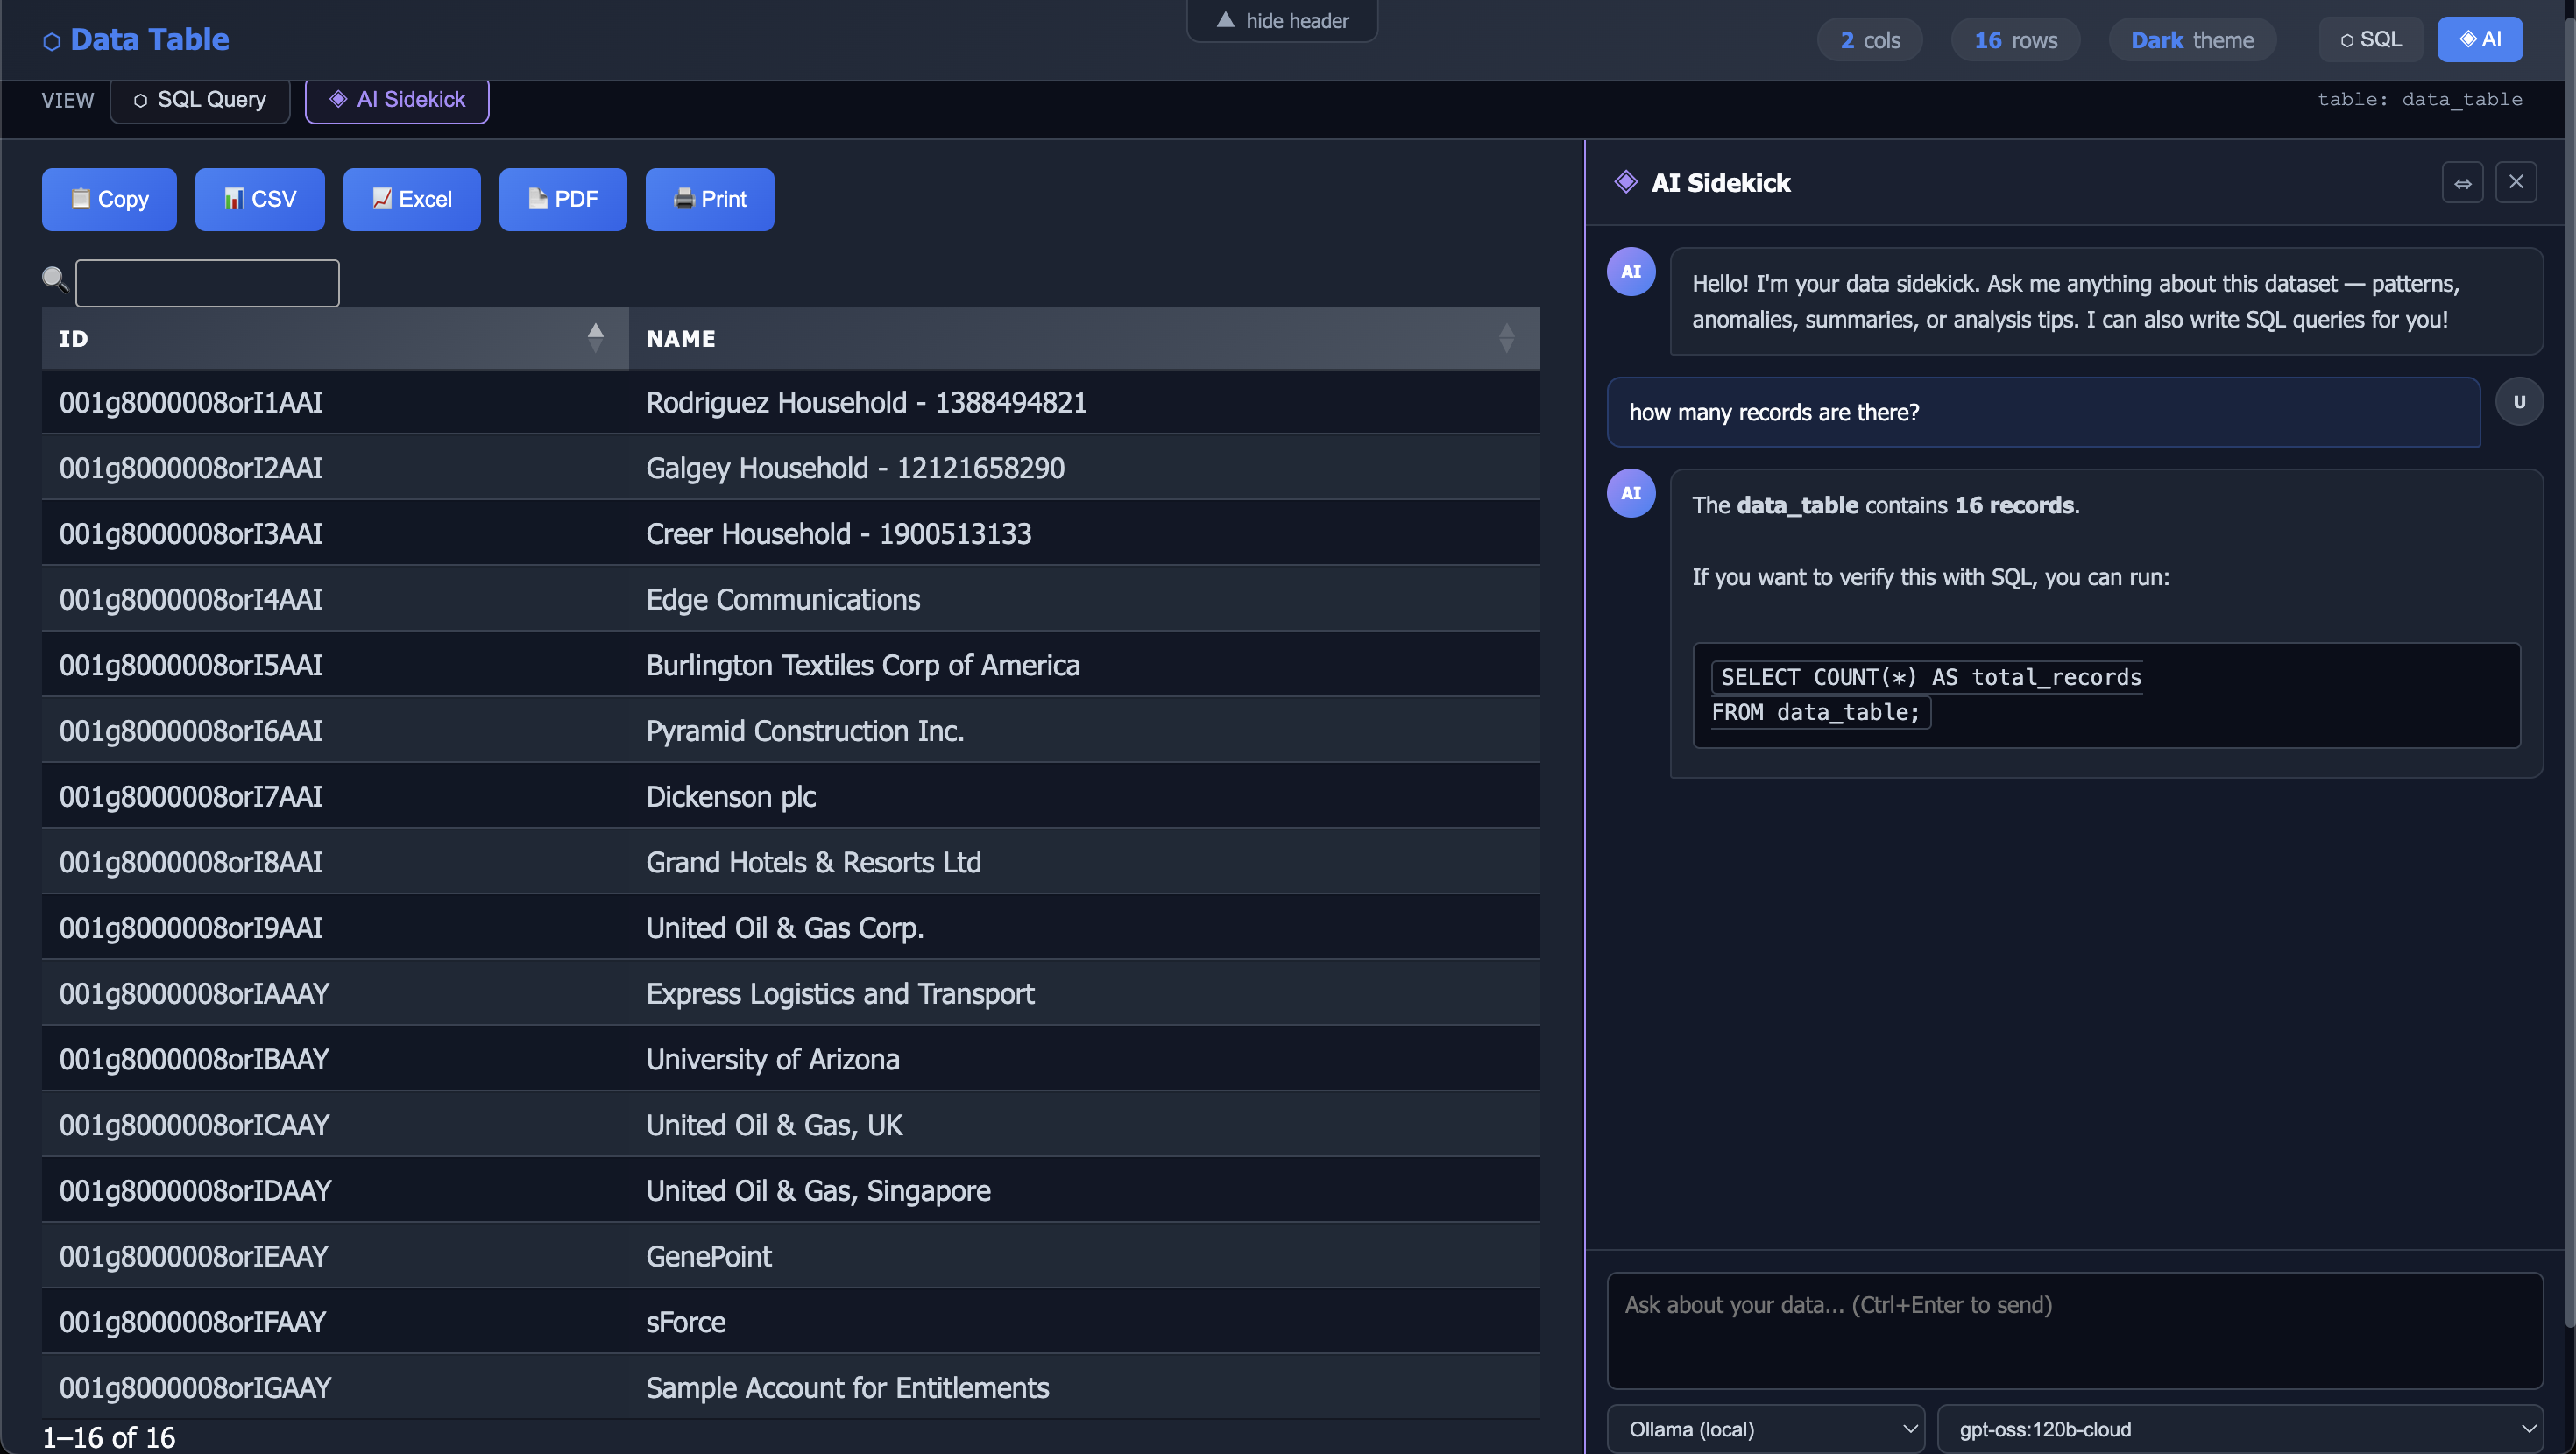
sf data query -q "SELECT Id, Name FROM Account " -o af102 -r csv | csv-to-datatable --enable-ai --serve --port 6767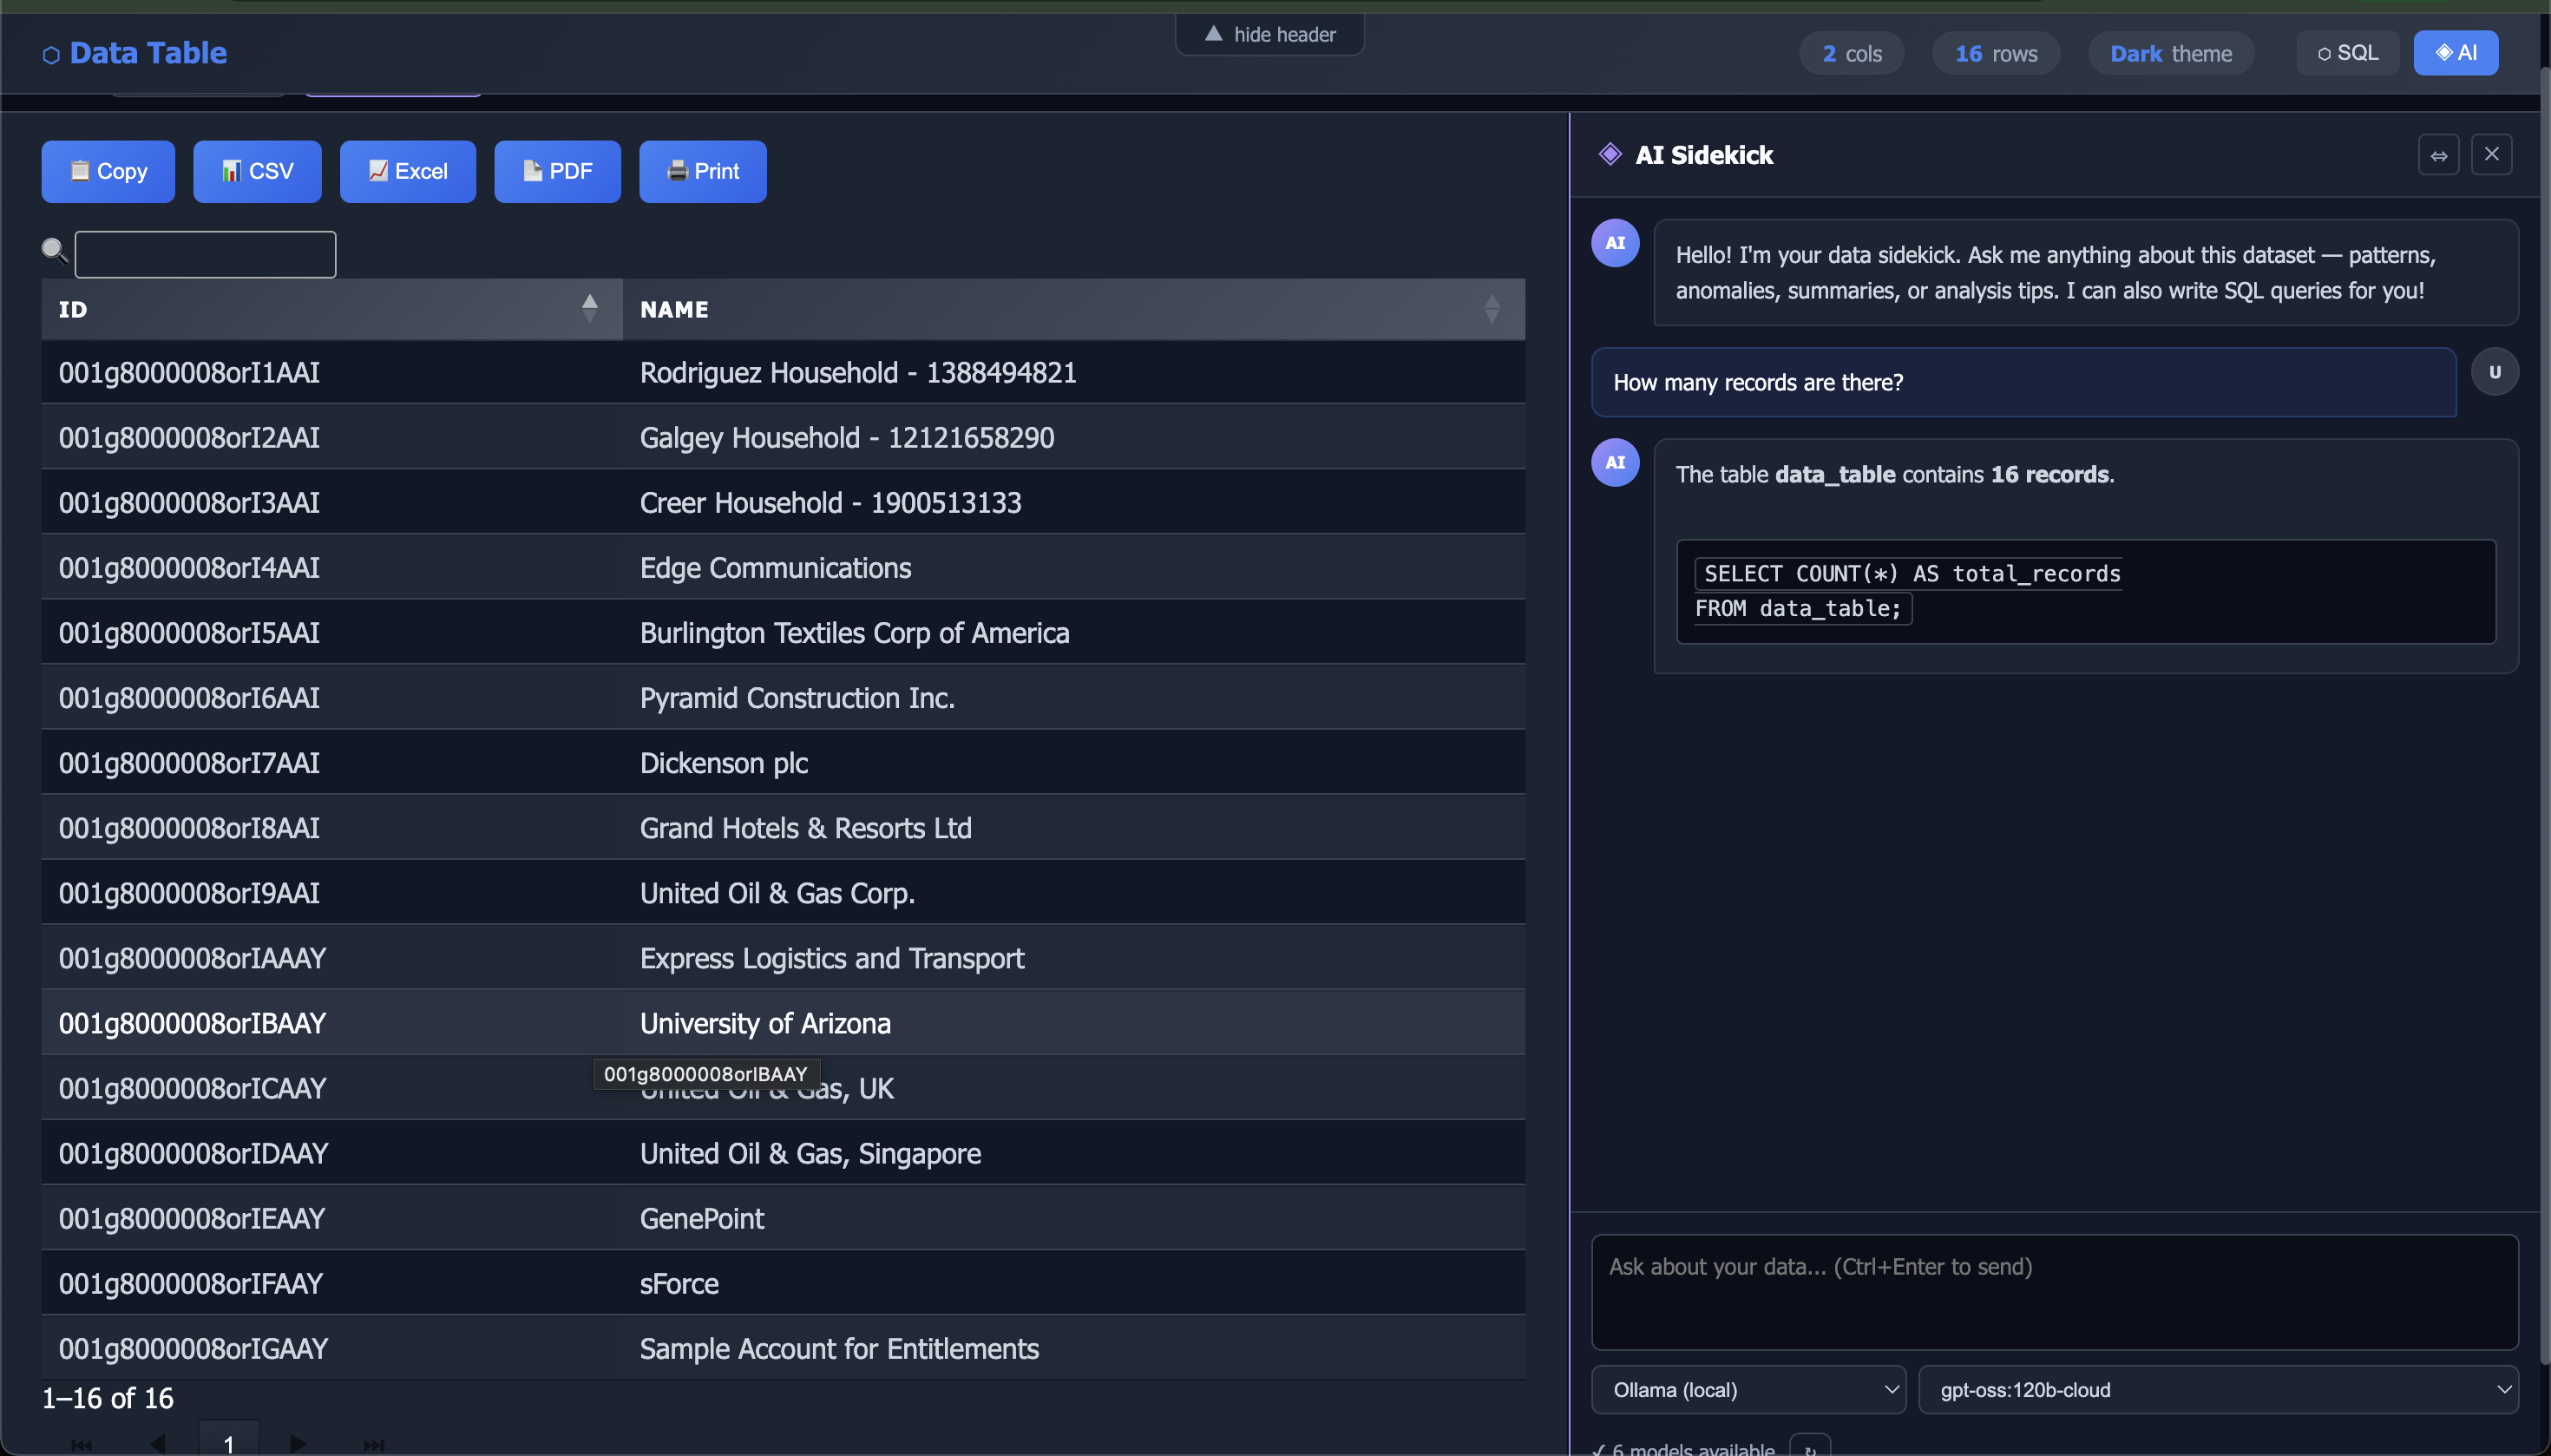
📦 Installation
Global Installation (Recommended)
npm install -g csv-to-datatable🚀 Quick Start
Basic Usage
# From a file
csv-datatable data.csv

# From stdin
cat data.csv | csv-datatable

# With AI sidekick enabled
csv-datatable data.csv --enable-ai

# Serve via HTTP (fixes CORS for Ollama and other local APIs)
csv-datatable data.csv --enable-ai --serve

# From a command, neon theme
curl https://example.com/data.csv | csv-datatable -T neon
This generates table.html and opens it in your browser.
With Options
csv-datatable sales.csv -t "Sales Report 2024" -T light -p 50 -s "25,50,100,200"📖 Command-Line Options
Input Methods
The tool supports three ways to provide CSV data:
- Positional argument:
csv-datatable data.csv - File flag:
csv-datatable -f data.csv - stdin (pipe):
cat data.csv | csv-datatable
Options
| Option | Description | Default |
|--------|-------------|---------|
| [file] | Input CSV file path (positional) | — |
| -f, --file <path> | Input CSV file (alternative to positional) | — |
| -t, --title <title> | Title for the table | "Data Table" |
| -T, --theme <theme> | Theme: dark, light, neon, purple, ocean | dark |
| -o, --output <path> | Output HTML file path | table.html |
| -p, --page-length <n> | Default page length | 25 |
| -s, --page-sizes <sizes> | Available page sizes (comma-separated) | 10,25,50,100 |
| --enable-search | Enable global search | true |
| --enable-sort | Enable column sorting | true |
| --responsive | Enable responsive design | true |
| --enable-ai | Enable AI Sidekick panel | false |
| --serve | Serve via built-in HTTP server (fixes CORS) | false |
| --port <n> | Port for --serve mode | 7070 |
🌐 Built-in HTTP Server (--serve)
When opening the generated HTML as a file:// URL, browsers block cross-origin requests — this prevents Ollama (and other local APIs) from working. The --serve flag starts a zero-dependency Node.js HTTP server so your file is served from http://localhost, resolving all CORS issues.
# Start server on default port 7070
csv-datatable data.csv --enable-ai --serve

# Custom port
csv-datatable data.csv --enable-ai --serve --port 8080
The server will:
- Write
table.htmlto disk as normal - Start listening on
127.0.0.1:<port> - Set
Access-Control-Allow-Origin: *on every response - Open your browser automatically at
http://localhost:<port>/table.html - Serve all static files in the same directory
- Shut down cleanly on
Ctrl+C
Note for Ollama users: Even with
--serve, Ollama must be started withOLLAMA_ORIGINS=*to accept requests from the browser:OLLAMA_ORIGINS=* ollama serveOr permanently on macOS:
launchctl setenv OLLAMA_ORIGINS "*"
🖥️ Monaco SQL Editor
The SQL panel (click SQL Query in the toolbar) features a full VS Code-grade Monaco editor:
- Autocomplete — columns, keywords, table name, and snippets trigger on Space,
.,(,, - Dotted field names — fields like
a.b.care auto-quoted as"a.b.c"when inserted - Keyboard shortcuts —
Ctrl+Enterto run,Ctrl+Shift+Fto format - SQL results as DataTable — results are sortable, searchable, and paginated; export to CSV in one click
- History — last 30 queries persisted per table name in
localStorage - Expandable panel — click
⇔to widen to 800px
Built-in Snippets
| Snippet | Inserts |
|---------|---------|
| select-all | SELECT * FROM <table> LIMIT 100 |
| select-cols | SELECT col1, col2, … FROM <table> WHERE … LIMIT 100 |
| group-by-count | SELECT col, COUNT(*) as count FROM <table> GROUP BY col ORDER BY count DESC |
🤖 AI Sidekick (--enable-ai)
Enable an AI chat panel that understands your dataset and can answer questions, spot patterns, and write SQL for you.
csv-datatable data.csv --enable-ai --serveSupported Providers
| Provider | Models |
|----------|--------|
| Anthropic | claude-sonnet-4-5, claude-opus-4-5, claude-haiku-4-5 |
| OpenAI | gpt-4o, gpt-4o-mini, gpt-4-turbo, gpt-3.5-turbo |
| Ollama (local) | Auto-detected from http://localhost:11434/api/tags |
Switch providers from the dropdown in the AI panel. API keys can be entered directly in the UI — they are never stored.
Ollama Setup
- Install Ollama and pull a model:
ollama pull gemma4 - Start with CORS enabled:
OLLAMA_ORIGINS=* ollama serve - Run the CLI with
--serve --enable-ai - Select Ollama (local) in the provider dropdown — available models are fetched automatically
If Ollama is running but CORS is blocked, the UI shows a yellow hint box with the exact commands to fix it.
🎨 Available Themes
Dark Theme (Default)
csv-datatable data.csv -T darkProfessional dark theme with blue accents. Perfect for long reading sessions.
Light Theme
csv-datatable data.csv -T lightClean, bright theme ideal for presentations and printing.
Neon Theme
csv-datatable data.csv -T neonCyberpunk-inspired with neon green and hot pink accents.
Purple Theme
csv-datatable data.csv -T purpleElegant purple gradient theme with a mystical feel.
Ocean Theme
csv-datatable data.csv -T oceanRefreshing ocean-blue theme with aqua accents.
💡 Usage Examples
Example 1: Simple Report
csv-datatable customers.csv -t "Customer List"Example 2: Sales Dashboard with AI
csv-datatable sales_2024.csv \
  -t "Q4 Sales Report" \
  -T ocean \
  -p 50 \
  -s "25,50,100,200" \
  --enable-ai \
  --serve \
  -o sales-dashboard.html
Example 3: Large Dataset
csv-datatable bigdata.csv \
  -p 100 \
  -s "50,100,200,500,-1" \
  -T dark
Note: Use -1 in page sizes to include "All" option
Example 4: Local AI with Ollama
# Start Ollama with CORS enabled
OLLAMA_ORIGINS=* ollama serve &

# Generate and serve
csv-datatable data.csv --enable-ai --serve --port 7070
# → Opens http://localhost:7070/table.html
# → Select "Ollama (local)" in AI panel
# → Your local models appear automatically
Example 5: Light Theme for Printing
csv-datatable invoice.csv \
  -t "Invoice Details" \
  -T light \
  -o invoice.html
Example 6: Piping from Commands
# From cat
cat data.csv | csv-datatable -T neon -o output.html

# From curl
curl https://example.com/api/export.csv | csv-datatable -t "Remote Data"

# Filter columns then visualize
cut -d',' -f1,2,3 data.csv | csv-datatable -t "Selected Columns"

# Filter rows then visualize
grep "Active" customers.csv | csv-datatable -t "Active Customers"
Example 7: Salesforce Data Query
# Query Salesforce and visualize results
sf data query -q "SELECT Id, Name FROM Account" -o username -r csv | \
  csv-datatable -T dark

# With AI for analysis
sf data query \
  -q "SELECT Id, Name, Industry, AnnualRevenue FROM Account LIMIT 100" \
  -o myorg -r csv | \
  csv-datatable -t "Salesforce Accounts" -T ocean -p 50 --enable-ai --serve

# Query and save to custom file
sf data query \
  -q "SELECT Id, Name, Email, Phone FROM Contact WHERE Email != null" \
  -o username -r csv | \
  csv-datatable -t "Contacts with Email" -T purple -o contacts-report.html
Example 8: Database Export
# PostgreSQL
psql -d mydb -c "COPY (SELECT * FROM users) TO STDOUT CSV HEADER" | \
  csv-datatable -t "User Database" -T dark

# MySQL
mysql -u user -p database -e "SELECT * FROM products" -B | \
  sed 's/\t/,/g' | \
  csv-datatable -t "Product Catalog" -T light
Example 9: Log Analysis
# Parse and visualize logs
cat access.log | awk '{print $1","$4","$7}' | csv-datatable -t "Access Logs"

# With preprocessing
grep "ERROR" app.log | cut -d' ' -f1,2,5 | tr ' ' ',' | \
  csv-datatable -t "Error Log" -T neon
Example 10: API Data Processing
# Fetch JSON, convert to CSV, visualize
curl https://api.example.com/data | \
  jq -r '.[] | [.id, .name, .value] | @csv' | \
  csv-datatable -t "API Data" -T purple
Example 11: Finding duplicates using SQL
id,first_name,last_name,email,city
1,John,Doe,[email protected],New York
2,Jane,Smith,[email protected],Boston
3,John,Doe,[email protected],Chicago
4,Alice,Johnson,[email protected],Seattle
5,Bob,Williams,[email protected],Austin
6,Jane,Smith,[email protected],Denver
7,Chris,Brown,[email protected],Miami
8,Alice,Johnson,[email protected],San Francisco
9,David,Lee,[email protected],Dallas
10,John,Doe,[email protected],Houston
11,Emma,Clark,[email protected],Atlanta
12,Chris,Brown,[email protected],Orlando
13,Sophia,White,[email protected],Portland
14,Jane,Smith,[email protected],Phoenix
15,Bob,Williams,[email protected],San Diego
SELECT
    first_name,
    last_name,
    email,
    COUNT(*) AS duplicate_count
FROM data_table
GROUP BY first_name, last_name, email
HAVING COUNT(*) > 1;
📊 Features Breakdown
🖥️ Monaco SQL Editor
- Full VS Code editor with SQL syntax highlighting
- Column, keyword, table, and snippet autocomplete
- Dotted field names (
account.owner.name) auto-quoted Ctrl+Enterto run,Ctrl+Shift+Fto format- Results rendered as a full DataTable (sortable, searchable, paginated)
- Export query results to CSV
- Query history persisted per table (30 entries)
- Expandable panel (560px default, 800px expanded)
🤖 AI Sidekick
- Anthropic, OpenAI, and Ollama support in one UI
- Auto-detects local Ollama models via
/api/tags - CORS error detection with inline fix instructions
- Markdown + code block rendering in chat bubbles
- Full conversation history maintained per session
🌐 HTTP Server
- Zero dependencies — uses Node's built-in
httpmodule Access-Control-Allow-Origin: *on all responses- Serves all static files in the output directory
- Binds to
127.0.0.1only (local access) - Graceful
Ctrl+Cshutdown
🔍 Search & Filter
- Global search across all columns instantly
- Real-time results as you type
📑 Pagination
- Customizable sizes; use
-1for "Show All" - First / Previous / Next / Last navigation
- Status: "Showing X to Y of Z entries"
↕️ Sorting
- Click any header to sort ascending / descending
- Visual arrows show current sort state
📤 Export Functions
- 📋 Copy — clipboard
- 📊 CSV — CSV file
- 📈 Excel —
.xlsxspreadsheet - 📄 PDF — landscape A2
- 🖨️ Print — print-optimized view
🗂️ CSV Format Requirements
Supported Format
Header1,Header2,Header3
Value1,Value2,Value3
Value4,Value5,Value6
Best Practices
- ✅ First row should contain headers
- ✅ Use UTF-8 encoding
- ✅ Quote fields containing commas:
"Last, First" - ✅ Escape quotes with double quotes:
"He said ""Hello""" - ✅ Headers with dots (
a.b.c) are fully supported — auto-quoted in SQL
File Size Recommendations
- Small (< 1MB): Any page size works
- Medium (1–10MB): Use page sizes 25–100
- Large (> 10MB): Use page sizes 50–200
🎯 Use Cases
- 📈 Data Analysis — Quickly visualize CSV exports with SQL and AI
- 📊 Reports — Generate beautiful HTML reports
- 📋 Inventory — Display product catalogs
- 👥 Contact Lists — Manage customer databases
- 💰 Financial Data — Present sales and revenue
- 🔌 Salesforce — Visualize SOQL query results
- 🗄️ Database Exports — View database query results
- 📊 API Responses — Convert JSON/API data to tables
- 📝 Log Analysis — Visualize parsed log files
- 🤖 AI-assisted Analysis — Ask natural language questions about your data
🛠️ Technical Details
Dependencies
- DataTables.js v2.0.8 — Table enhancement
- Monaco Editor v0.44.0 — SQL editor (CDN, no install)
- sql.js v1.10.2 — In-browser SQLite engine
- jQuery v3.7.1 — DOM manipulation
- Papa Parse — CSV parsing
- Commander — CLI argument parsing
- JSZip — Excel export support
- PDFMake — PDF generation
Browser Compatibility
- ✅ Chrome 90+
- ✅ Firefox 88+
- ✅ Safari 14+
- ✅ Edge 90+
Performance
- Load Time: < 2s for files up to 5MB
- Search: Real-time with < 50ms delay
- Export: < 5s for 10,000 rows
- SQL: In-browser SQLite — sub-millisecond for most queries
🔧 Advanced Usage
Custom Page Sizes
# Small increments for detailed analysis
csv-datatable data.csv -s "5,10,15,20"

# Large increments for quick overview
csv-datatable data.csv -s "100,250,500,1000"

# Include "Show All" option
csv-datatable data.csv -s "25,50,100,-1"
Piping Workflows
Data Transformation Pipeline
cat raw_data.csv | \
  grep -v "^#" | \
  cut -d',' -f1,3,5 | \
  sort -t',' -k2 | \
  csv-datatable -t "Processed Data" -T ocean
Multi-stage Processing
curl -s https://api.example.com/export.csv | \
  grep "2024" | \
  csv-datatable -t "2024 Data" -T purple -o report.html
Database to Web Report
psql -d production -t -A -F"," \
  -c "SELECT * FROM sales WHERE date > '2024-01-01'" | \
  csv-datatable -t "Sales Report Q1 2024" -T light -p 100
SF data query to Web Report
sf data query -q "SELECT Id, Name FROM Account" -o af102 -r csv | csv-datatable --enable-ai --serve --port 7890 Real-World Examples
Customer Database
csv-datatable customers.csv \
  -t "Customer Database - 2024" \
  -T light \
  -p 25 \
  -s "10,25,50,100" \
  -o customers-report.html
Financial Report with AI
csv-datatable transactions.csv \
  -t "Q4 Financial Transactions" \
  -T purple \
  -p 50 \
  --enable-ai \
  --serve \
  -o finance-report.html
Salesforce Account Analysis
sf data query \
  -q "SELECT Id, Name, Industry, Type, AnnualRevenue, NumberOfEmployees FROM Account WHERE Industry != null ORDER BY AnnualRevenue DESC LIMIT 500" \
  -o myorg -r csv | \
  csv-datatable -t "Top Accounts by Revenue" -T dark -p 50 \
  --enable-ai --serve -o accounts-analysis.html
📄 License
This project is licensed under the MIT License — see the LICENSE file for details. (c) Mohan Chinnappan
🙏 Acknowledgments
- DataTables — Amazing table plugin
- Monaco Editor — VS Code's editor, in the browser
- sql.js — SQLite compiled to WebAssembly
- Papa Parse — Fast CSV parser
- Commander.js — CLI framework
- jQuery — JavaScript library
- Ollama — Local LLM runtime
🗺️ Roadmap
- [x] stdin support for piping
- [x] Monaco SQL editor with autocomplete
- [x] Dotted field name support (
a.b.c) - [x] SQL results as sortable/searchable DataTable
- [x] AI Sidekick (Anthropic, OpenAI, Ollama)
- [x] Built-in HTTP server (
--serve) with CORS headers - [x] SQL query history
- [ ] Add column filtering
- [ ] Support for JSON input
- [ ] Custom column width control
- [ ] Chart integration (bar, line, pie from SQL results)
- [ ] Row grouping
- [ ] Column visibility toggle
- [ ] Save/load table state
- [ ] More export formats (XML, SQL INSERT)
- [ ] API endpoint generation
🎓 Tutorial
Step 1: Prepare Your CSV
Name,Email,Department,Salary
John Doe,[email protected],Engineering,120000
Jane Smith,[email protected],Marketing,95000
Step 2: Generate Table
csv-datatable employees.csv -t "Employee Directory"Step 3: Customize
csv-datatable employees.csv \
  -t "Employee Directory" \
  -T purple \
  -p 10 \
  -s "5,10,20,50"
Step 4: Add AI + HTTP Server
# Start Ollama (optional, for local AI)
OLLAMA_ORIGINS=* ollama serve &

# Generate with full features
csv-datatable employees.csv \
  -t "Employee Directory" \
  -T purple \
  --enable-ai \
  --serve
# Opens http://localhost:7070/table.html automatically
Step 5: Use the SQL Editor
- Click SQL Query in the toolbar
- Type your query — columns autocomplete as you type
- Press
Ctrl+Enterto run - Results appear as a sortable DataTable below the editor
- Click ⬇ CSV to export results
Step 6: Use the AI Sidekick
- Click AI Sidekick in the toolbar
- Select your provider (Anthropic, OpenAI, or Ollama)
- Enter your API key (or leave blank for Ollama)
- Ask anything: "Which department has the highest average salary?"
- The AI knows your column names and row count automatically
Step 7: Share
Share the generated table.html — or keep the server running and share the http://localhost URL with your team on the same network.
📱 Mobile Support
The tables are fully responsive and work great on mobile devices:
- Horizontal scrolling for wide tables
- Touch-friendly controls
- Optimized button sizes
- Responsive page size selector
🔗 Integration Examples
Shell Scripts
#!/bin/bash
# Generate daily report with AI
sf data query -q "SELECT Id, Name, Status FROM Case WHERE CreatedDate = TODAY" \
  -o production -r csv | \
  csv-datatable \
    -t "Daily Cases - $(date +%Y-%m-%d)" \
    -T dark \
    --enable-ai \
    --serve \
    -o "reports/daily-$(date +%Y%m%d).html"
Cron Jobs
# Add to crontab for automated reports
0 9 * * * /usr/local/bin/sf data query -q "SELECT * FROM DailyMetrics__c" \
  -o myorg -r csv | \
  /usr/local/bin/csv-datatable -t "Daily Metrics" -o /var/www/html/reports/daily.html
CI/CD Pipeline
# GitHub Actions example
- name: Generate Report
  run: |
    sf data query -q "SELECT * FROM TestResults__c" -o ci-org -r csv | \
    csv-datatable -t "Test Results" -T light -o test-report.html

- name: Upload Report
  uses: actions/upload-artifact@v3
  with:
    name: test-report
    path: test-report.html
Made with ❤️ for data enthusiasts · Last Updated: April 2026