
d3-line-chart
v0.1.2
Published
A d3.js library to draw line charts easily


Readme
d3-line-chart
A d3.js library to help you draw line charts easily.
How to use it
- include
d3.js,d3-line-char.js
<script type="text/javascript" src="./d3.js" charset="utf-8"></script>
<script type="text/javascript" src="./d3-line-chart.js" charset="utf-8"></script>- simplest way to draw the graph
	var data = {
		name: 'series',
		values: [{x: 1, y: 2}, {x: 2, y : 4}, {x:3, y: 3}]
	};
	new LineChart().for([data]).plot();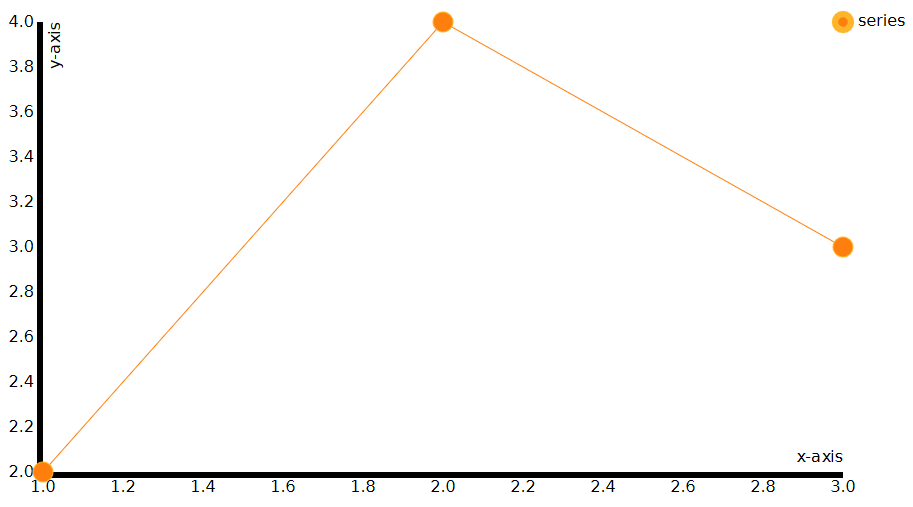
This library uses UMD to export a single name to the browser window: "LineChart". It has a single dependency on d3 and expects it to be exported to the browser window as well, include d3 using the <script> tag and you will be fine.
If you ever use this on nodejs, you can use require as such
var LineChart = require('./d3-line-chart.js');API
d3-line-chart actually provides a lot more options for drawing line chart, you can customize the following things.
idof the svg chart, defaults to no idparentof the chart, defaults tobodyall_seriesan array of series that will be plottedgraph-width, width of the entire graph, defaults to 960graph-height, height of the entire graph, defaults to 500margin, margins around the chart, this can be used to draw axis and legent, defaults to (20, 100, 30, 60)x_axis_texttext that is printed beside the x-axisy_axis_texttext that is printed beside the y-axisx_parsefunction that is used to parse thexvalues of each data point, defaults to identity functiony_parsefunction that is used to parse theyvalues of each data point, defaults to identity functionx_scalescale function forxvalues, defaults tod3.scale.linear()y_scalescale function foryvalues, defaults tod3.scale.linear()widththe maximum width the line chart can appear in, equals tograph_width - margin.left - margin.right, defaults to 960 - 100 - 60heightthe maximum height the line chart can appear in, equals tograph_height - margin.right - margin.bottom, defaults to 500 - 20 - 30tooltipa function that is called with the tooltip div and the current data point that is hovered to allow you to display your custom div
More advanced stuff
Specify colours
The color for reach series is taken from d3.scale.category10(), which is used to provide a mapping from the name of a series to one of ten available colours. If more colours are needed, you need to edit the source, to use d3.scale.category20() perhaps.
Tooltips on hover
By default tooltips are shown on hover, with some simple styling. x-axis values are underlined, followed by y-axis values.
You can display your own custom tooltip by providing a function called tooltip to the constructor. This function must take in 2 parameters, div, which is the div of the tooltip, and point which is the point that is hovered over.
Date on the x axis
You can specify other scales besides d3.scale.linear() by passing the function into LineChart()
lc = new LineChart({
	x_scale: d3.time.scale()
});
var data = {
	name: 'series',
	values: [{x: new Date(2014, 4, 1, 0, 0, 0, 0), y: 9},
	{x: new Date(2014, 4, 3, 0, 0, 0, 0), y: 2},
	{x: new Date(2014, 4, 9, 0, 0, 0, 0), y: 3}]
};
lc.for([data]).plot();