
d3-pivots
v1.0.2
Published
D3 plugin allowing to create pivot bar chart from a flat data set.
Downloads
16

Readme
d3-pivots
D3 plugin allowing to create pivot bar chart from a flat data set.
The plugin aims to follow the convention for developing D3 plugins described in Towards Reusable Charts by Mike Bostock.
Installing
If you are using NPM, you can install the plugin via:
$ npm install d3-pivotsOtherwise, download the latest release and include it in your page using the script tag.
Dependencies
The plugin depends on the Underscore JavaScript library. Hence, it must also be included in the script tag of your page.
<script src="../build/d3-pivots.min.js"></script>
<script src="https://d3js.org/d3.v4.js"></script>

<!-- Don't forget to include underscore.js -->
<script src="assets/js/underscore-min.js"></script>
Examples
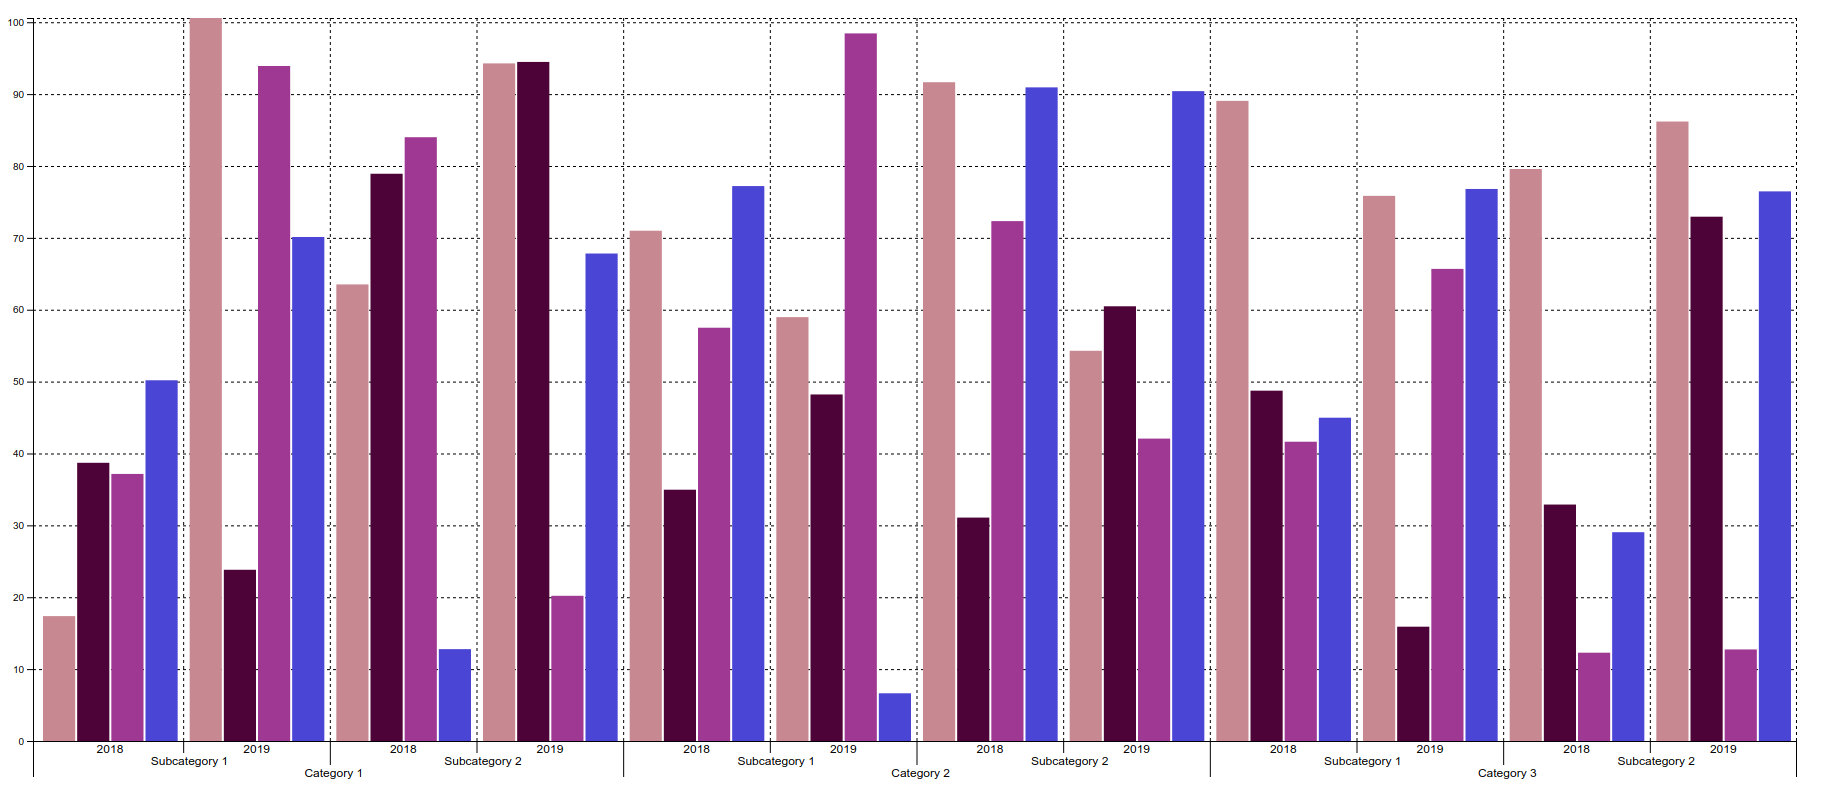
Check out the examples/example01.html and the corresponding data.js to see the plugin in practice.
Below is listed the snippet that's used for initializing the pivot bar chart with the sample data set:
let pivot = {
    columns: ['category', 'subcategory', 'year'],
    rows: ['country', 'gender'],
    value: 'value'
};

let pivotBarChart = d3.pivotBarChart()
    .data(data)
    .width(1800)
    .pivot(pivot)
    .axis({xTicks: true, xLabels: true, yTicks: true, yLabels: true})
    .grid({horizontal: true, vertical: true});

d3.select('#chart')
    .call(pivotBarChart);
API Reference
d3.pivotBarChart()
Initializes and returns a new pivot bar chart instance.
chart.width([width])
Sets or returns the width of the chart.
chart.height([height])
Sets or returns the height of the chart.
chart.margin([margin])
Sets or returns the margins of the chart.
margin is an object that has the following format and default values:
{top: 10, right: 25, bottom: 10, left: 25}chart.data([data])
Sets or returns the data to be rendered on the chart.
chart.pivot([pivot])
Sets or returns the pivot configuration.
This configuration object specifies the pivot structure of the original flat data set.
pivot is an object that has the following format:
{
    columns: [],
    rows: [],
    value: ''
}
The following is included in the pivot configuration object:
columns: Array of fields to use as pivot columns. Field values will be sorted in natural sort order when rendering the chart.rows: Array of fields to use as pivot rows. Field values will be sorted in natural sort order when rendering a chart.value: Field that corresponds to the actual data point value. Defaults tovaluefield.
NOTE: Fields specified in the pivot object must match the actual fields from the original data set.
chart.colors([colors])
Sets or returns the color palette to use for rendering chart.
The palette has the form of an array of hex color values. By default, the chart is initialized with the palette of random colors.
chart.axis([axis])
Sets or returns the axis configuration.
This configuration object defines whether tick marks and labels on both x- and y-axis should be displayed.
axis has the following format and default values:
{
    xTicks: true,
    xLabels: true,
    yTicks: true,
    yLabels: true
}
chart.grid([grid])
Sets or returns the grid configuration.
This configuration object defines whether horizontal and/or vertical grid lines should be displayed.
grid has the following format and default values:
{
    horizontal: true,
    vertical: true
}
Authors
Name | E-mail address | Skype ID :-------------------:|---------------------------|---------------- Kemal Sokolović | [email protected] | kemal.sokolovic Miloš Panasiuk | [email protected] | milos.panasiuk
License
This project is licensed under the MIT license. See the LICENSE for details.