
dash-table
v7.4.0
Published
Dash table
Maintainers
 chriddyp
 bpostlethwaite
 antrg
antrg hammadtheone
 bronsolo
 t4rk
t4rk alexshoe
 lconnors
 ndrezner
 farkites
 alexcjohnson
 emilykl-plotly
 marthacryan
 packages-team-plotly
 marivet
Keywords
Readme
Dash Table
An interactive DataTable for Dash.
:point_right: Documentation
Quickstart
pip install dashfrom dash import Dash, dash_table
import pandas as pd
df = pd.read_csv('https://raw.githubusercontent.com/plotly/datasets/master/solar.csv')
app = Dash(__name__)
app.layout = dash_table.DataTable(
id='table',
columns=[{"name": i, "id": i} for i in df.columns],
data=df.to_dict('records'),
)
if __name__ == '__main__':
app.run(debug=True)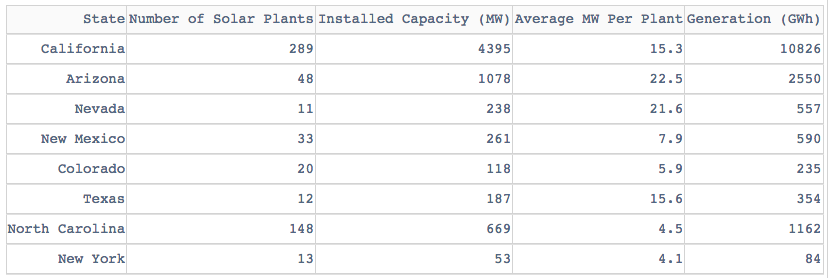
Background
Dash DataTable is an interactive table component designed for viewing, editing, and exploring large datasets.
DataTable is rendered with standard, semantic HTML <table/> markup, which makes it accessible, responsive, and easy to style.
This component was written from scratch in React.js and Typescript specifically for the Dash community. Its API was designed to be ergonomic and its behavior is completely customizable through its properties.
DataTable was designed with a featureset that allows that Dash users to create complex, spreadsheet driven applications with no compromises. We're excited to continue to work with users and companies that invest in DataTable's future.
Note: DataTable is currently supported in Chrome, Firefox, Safari, Edge (version 15+), and Internet Explorer 11.
Share your DataTable Dash apps on the community forum!
Contributing
See CONTRIBUTING.md