
data-forge-indicators
v0.2.7
Published
Financial indicators for use with Data-Forge.
Maintainers
 ashleydavis
Keywords
Readme
data-forge-indicators
Financial and quantitative trading indicators for use with Data-Forge.
Please click here for a graphical example of all indicators.
Need to learn data wrangling? See my book Data Wrangling with JavaScript or blog The Data Wrangler.
Do prototyping and data analysis in JavaScript with Data-Forge Notebook.
Indicators supported
- Simple moving average (
sma) - Exponential moving average (
ema) - Bollinger bands (
bollinger) (includingpercentBandbandwidth) - Gaps (
gaps) - Market direction (
direction) - Market extrema (
extrema) - Market trends (
trends) - Momentum (
momentum) - Rate of change (
roc) - Relative strength index (
rsi) - Streaks (
streaks) - Connor's RSI (
crsi) - Stochastic (
stochasticSlowandstochasticFast)
MORE INDICATORS COMING SOON
Setup
Install Data-Forge, Data-Forge Indicators and auxilary modules via npm:
npm install --save data-forge data-forge-fs data-forge-plot data-forge-indicators Import into your script (JavaScript):
const dataForge = require('data-forge');
require('data-forge-fs'); // Add file system functions to Data-Forge.
require('data-forge-plot'); // Add chart plotting functions to Data-Forge.
require('data-forge-indicators'); // Add financial indicator functions to Data-Forge.
Import into your script (TypeScript):
import * as dataForge from 'data-forge';
import 'data-forge-fs'; // Add file system functions to Data-Forge.
import 'data-forge-plot'; // Add chart plotting functions to Data-Forge.
import 'data-forge-indicators'; // Add financial indicator functions to Data-Forge.
Loading some data
To compute some indicators you'll need to load some data. You can load your data from whatever source you want, you might load it from a database or a REST API. For this example we'll load our data from a CSV data file:
let inputSeries = dataForge.readFileSync("STW.csv")
    .parseCSV()
    .parseDates("date", "DD/MM/YYYY")
    .parseFloats(["open", "high", "low", "close", "volume"])
    .setIndex("date") // Index so we can later merge on date.
    .bake();
Moving average
Use the sma function to compute a simple moving average of a data series:
const movingAverage = inputSeries
    .deflate(bar => bar.close)  // Extract closing price series from input data.
    .sma(30)                    // 30 day moving average.
    .bake();                    // Force lazy evaluation to complete.
To compare the moving average against your input data you'll need to merge it back into your source data:
const withMovingAverage = inputSeries
    .skip(30)                           // Skip blank sma entries.
    .withSeries("sma", movingAverage)   // Integrate moving average into data, indexed on date.
    .bake();
You can preview your data in Data-Forge Notebook using the display function:
display(withMovingAverage.tail(5));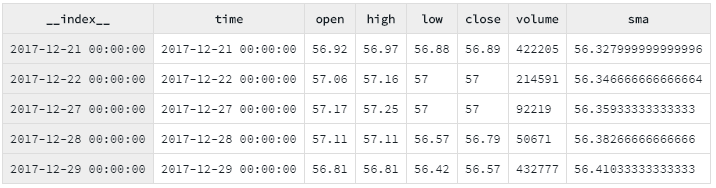
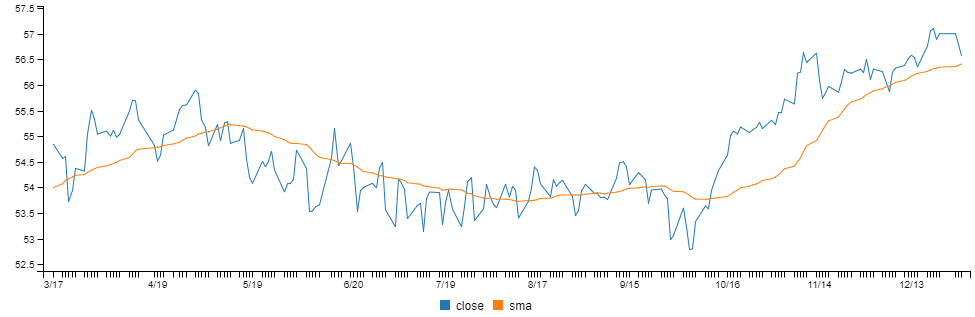
You can plot the moving average and compare to the source data using Data-Forge Plot:
const plot = withMovingAverage.plot({}, { y: ["close", "sma"] }));
plot.renderImage("sma.png");
Or plot with the Data-Forge Notebook display function:
display(plot);The rendered chart looks like this:
Also available is an ema function that works in the same way as sma.
Bollinger bands
Use the bollinger function to compute Bollinger Bands from a data series:
const bollingerBands = inputSeries
    .deflate(bar => bar.close)  // Extract closing price series from input data.
    .bollinger(20, 2, 2)        // 20 days with bands at 2 standard deviations.
    .bake();
You can preview your data in Data-Forge Notebook using the display function:
display(bollingerBands.tail(5));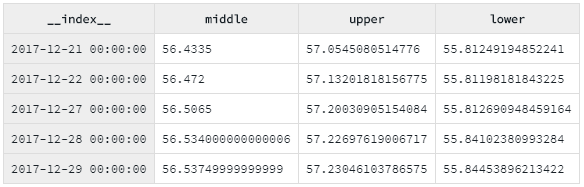
To compare Bollinger Bands to the closing price, merge the closing price data series into the bollinger bands dataframe:
const withBollingerBands = bollingerBands
.withSeries("close",
inputSeries.deflate(row => row.close)
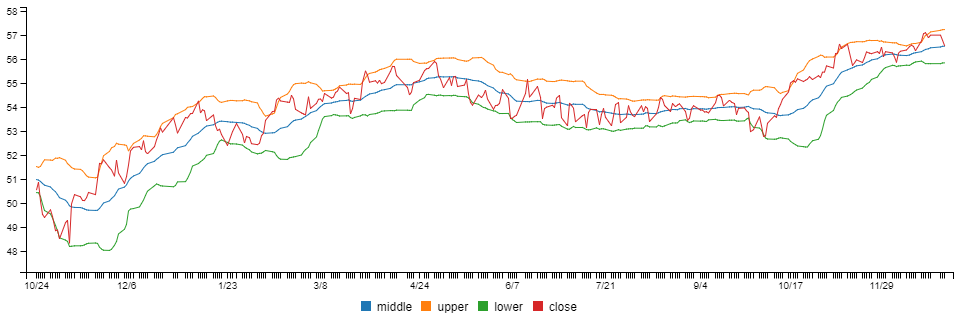
);You can render a chart using Data-Forge Plot or Data-Forge Notebook.
The chart looks like this:
Percent b and bandwidth
Percent b (%b) and bandwidth are indicators derived from Bollinger Bands.
%b shows where price is in relation to the bands with values at 1 for the upper band and 0 for the lower band:
const percentB = = inputSeries
    .deflate(bar => bar.close)
    .bollinger(20, 2, 2)        // Need Bollinger Bands first.
    .percentB();
Bandwidth shows the normalised width of the bands:
const bandwidth = = inputSeries
    .deflate(bar => bar.close)
    .bollinger(20, 2, 2)        // Need Bollinger Bands first.
    .bandwidth();
Gaps
Use the gaps function to compute percentage gap between close and open of subsequent days/bars.
To use this functon your input dataframe must have open, high, low and close (OHLC) fields.
const gaps = inputSeries.gaps();
console.log(gaps.toArray());
Market direction
The direction function allows you test the direction of a series.
const dailyDirection = inputSeries
    .deflate(row => row.close)
    .direction(2);
const monthlyDirection = inputSeries
.deflate(row => row.close)
.direction(30);The result is a series of -1, 0 and 1 values that indicate the direction of the value (down, flat or up) for the particular time period.
Market extrema
The extrema function builds on the direction function to pick out minima (troughs) and maxima (peaks) in the series.
const extrema = inputSeries
    .deflate(row => row.close)
    .extrema();
Market trends
The trends function builds on the extrema function to detect trends in the market. It returns a series of -1 and 1 values to tell you when the series is in downtrend or uptrend.
const trends = inputSeries
    .deflate(row => row.close)
    .trends();
An uptrend is defined as a series of higher troughs.
A downtrend is defined as a series of lower peaks.
Momentum
Compute momentum using the momentum function.
const momentum = inputSeries.deflate(row => row.close).momentum(30);Rate of change
Compute rate of change using the rateOfChange function.
const rateOfChange = inputSeries.deflate(row => row.close).roc(30);Relative strength index
Use the rsi function to compute relative strength.
const rsi = inputSeries.deflate(row => row.close).rsi(14);Streaks
Use the streaks function to count streaks of up days and down days.
Up day streaks are counted with positive numbers, down day streaks with negative numbers.
This function is used by Connor's RSI (csri).
const streaks = inputSeries.deflate(row => row.close).streaks();
display(streaks.plot());
Connor's RSI
Use the csri function for Connor's updated RSI indicator.
const crsi = inputSeries.deflate(row => row.close).crsi(3, 2, 100);
display(crsi.plot({ y: { min: 0, max: 99 } }));
MACD
Use the macd function to compute moving average convergence divergence:
const macd = inputSeries.deflate(row => row.close).macd(12, 26, 9); // Inputs are short ema period, long ema period and signal line period.
display(macd.plot({}, { y: "histogram" }));
Stochastic
Compute Stochastic using the stochasticSlow or stochasticFast function.
const stochasticSlow = inputSeries.stochasticSlow(20, 12, 12)
    .withSeries('stoch slow', stochasticSlow)

const stochasticFast = inputSeries.stochasticSlow(20, 12)
    .withSeries('stoch fast', stochasticFast)