
dsssp
v0.8.0
Published
React components for audio equalizers and filter visualization: SVG frequency-response graphs, interactive biquad filters, and Web Audio curve math.

Maintainers
 numberonebot
Readme
DSSSP





React Library for Audio Equalizers & Filter Visualization
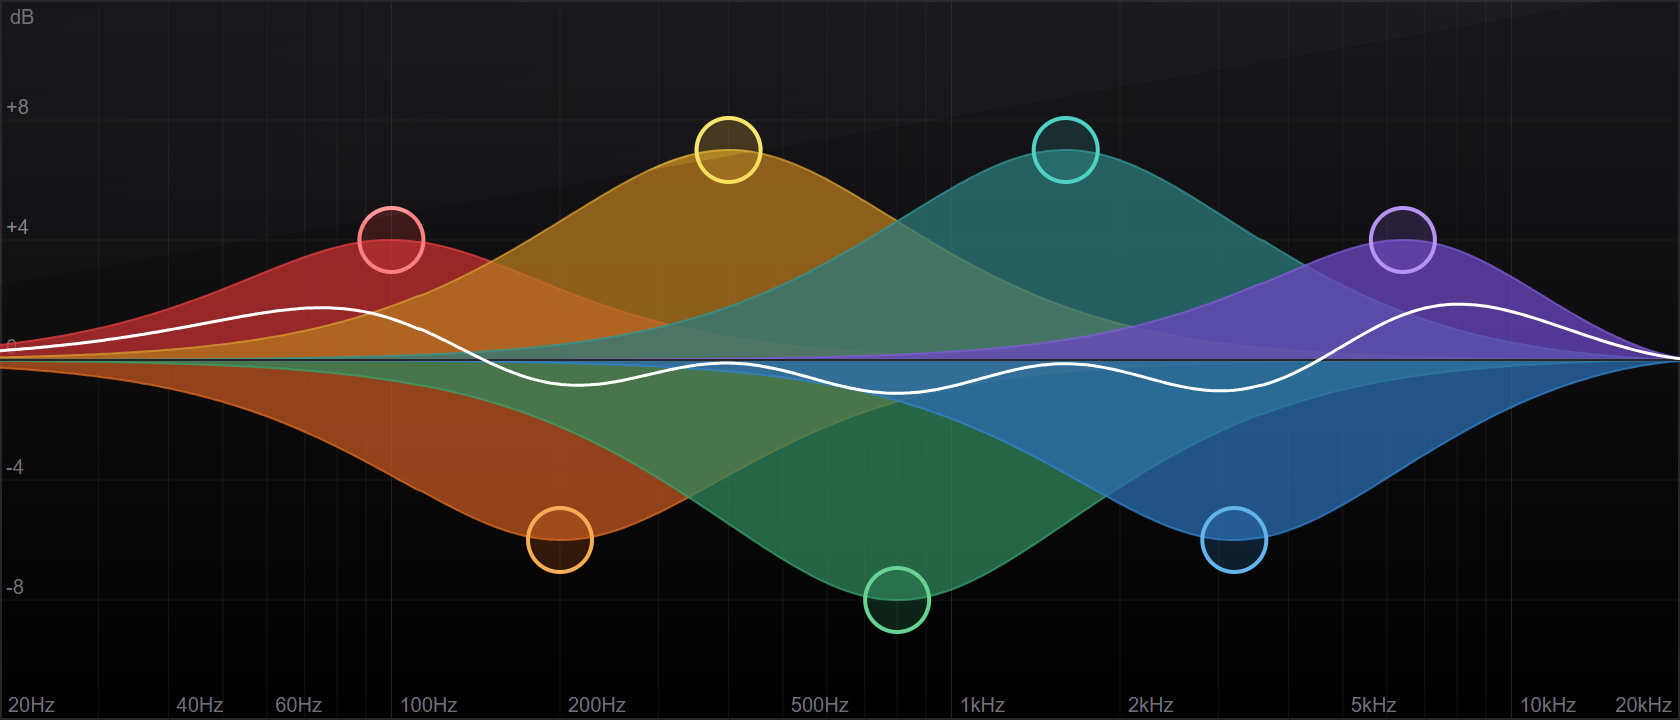
DSSSP is a React component library for visualizing and editing audio filters. These components are designed to serve as the core UI elements of audio production tools and interfaces, enabling users to interactively configure all filter parameters. Essentially, it is a conversion of proprietary audio processing and visualization tools from professional desktop software to a web-based environment.
The library's rendering system is based on SVG and provides a logarithmic frequency graph for audio spectrum representation, a set of components to render and manipulate biquad filters, and mathematical functions to calculate the resulting signal curve. Filters support drag-and-drop and mouse wheel interactions, direct property updates (Gain, Frequency, Q-Factor), animated transitions between curves, and implement common audio filter types.
Features
- SVG frequency-response graph — logarithmic frequency axis and dB gain grid
- Interactive biquad filters — drag-and-drop and mouse-wheel control of Gain, Frequency, and Q
- Full set of filter types — peaking, low/high shelf, low/high pass, band-pass, notch, and gain
- Composite curve — the summed response of all filters, updated in real time
- Animated transitions between filter curves (
animate/easing/durationprops) - Themeable and TypeScript-first
- Works with React 18 and 19 (the only peer dependency)
Components
FrequencyResponseGraph— SVG container and context (scale, theme, dimensions) for everything belowFilterCurve— the response curve of a single filterCompositeCurve— the summed response of all filtersFilterPoint— draggable control point for a filter's frequency, gain and QFilterGradient— gradient fill under a curveFilterIcon— filter-type icon glyphFrequencyResponseCurve— render a precomputed magnitude arrayPointerTracker— crosshair readout that follows the cursor
Use cases
Parametric EQ interfaces, audio-plugin and DAW-style tools, crossover and filter designers, and teaching DSP — anywhere you need an interactive frequency-response graph on the web.
Installation
Install the package in your project directory with:
npm install dssspQuick start
import {
  FrequencyResponseGraph,
  FilterCurve,
  CompositeCurve,
  type GraphFilter
} from 'dsssp'
import 'dsssp/font'

const filters: GraphFilter[] = [
  { freq: 400, gain: 6, q: 1, type: 'PEAK' },
  { freq: 600, gain: -8, q: 3, type: 'PEAK' },
  { freq: 1200, gain: 2, q: 0.7, type: 'HIGHSHELF2' }
]

const App = () => (
  <FrequencyResponseGraph
    width={800}
    height={480}
  >
    <FilterCurve
      filter={filters[0]}
      color="#FF9966"
    />
    <FilterCurve
      filter={filters[1]}
      color="#6699FF"
    />
    <FilterCurve
      filter={filters[2]}
      color="#66FF66"
    />
    <CompositeCurve filters={filters} />
  </FrequencyResponseGraph>
)
Documentation
Visit dsssp.io/docs to view the full documentation.
Examples
Our documentation includes a full-scale demo project that showcases each library component across various use cases and provides a starting point for your own projects.
Visit the dsssp.io/demo to see it live.
License
MIT © Oleksiy Strelets — free to use in personal, open-source, and commercial projects.
Contact
If you have any questions or feedback, reach out to the author at [email protected].