
dtr
v0.0.1
Published
Node.JS wrapper around useful D scripts to lower the bar for entry for using DTrace

Readme
dtr - DTrace Runner
Node.JS wrapper around useful D scripts to lower the bar for entry for using DTrace
Installation
Install Node.JS first, then install dtr
[sudo] npm install -g dtrHow To
Simply run dtr to get an interactive menu of scripts to run
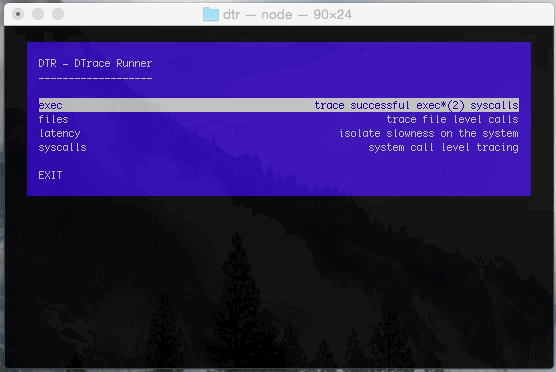
dtr will show D scripts broken down by section that you can call
simply by clicking enter.
Some scripts require a process ID (pid) to run, in which case dtr will
prompt you for that before running the script.
Advanced
dtr is meant to be a convenient way to use DTrace for those that may have
never used it before, and perhaps found it a little intimidating. However,
navigating the interactive menu can become tiresome after you know exactly
which script you want to run. dtr also supports command line arguments for
ease of use.
List available scripts in the exec section
$ dtr ls
exec                                trace successful exec*(2) syscalls
  exec/exec.d                       print all successful exec(2) call details
Or just list them all
$ dtr ls
exec                                trace successful exec*(2) syscalls
  exec/exec.d                       print all successful exec(2) call details

files                               trace file level calls
  files/opened-files.d              print all filenames opened on the system
  files/pid-opened-files.d          print all filenames opened on the system by <pid>

latency                             isolate slowness on the system
  latency/read-latency-5sec.d       summarize latency of read(2) calls for 5 seconds
  latency/read-latency.d            summarize latency of read(2) calls, exit after ctrl-c

syscalls                            system call level tracing
  syscalls/count-10sec.d            count syscalls per process, exit after 10 seconds
  syscalls/count.d                  count syscalls per process, exit after ctrl-c
  syscalls/pid-count.d              count syscalls by name on <pid>, exit after ctrl-c
  syscalls/syscall.d                count syscalls per process and name, exit after ctrl-c
You can run a script using dtr run
# dtr run syscalls/pid-count.d
enter PID to trace: 76498
dtrace: script '/dev/stdin' matched 491 probes
CPU     ID                    FUNCTION:NAME
  2      1                           :BEGIN tracing, ctrl-c to exit...
...
Also, if the script you are running takes a PID, you can specify it as an argument to skip the interactive prompt
# dtr run syscalls/pid-count.d 76498
dtrace: script '/dev/stdin' matched 491 probes
CPU     ID                    FUNCTION:NAME
  2      1                           :BEGIN tracing, ctrl-c to exit...
...
And for the paranoid/curious, you can dump the contents of the D script that
would run using dtr cat
$ dtr cat syscalls/pid-count.d
#!/usr/sbin/dtrace -s
BEGIN {
        printf("tracing, ctrl-c to exit...\n");
}
syscall:::entry
/$target == pid/
{
        @[execname, probefunc] = count();
}
Finally, you can enable debug output to see the exact command and script that will
be executed with -d
# dtr -d run syscalls/pid-count.d 76498
[DEBUG] spawning: ["dtrace","-s","/dev/stdin","-p",76498]
[DEBUG] script loaded from file: /Users/dave/dev/dtr/scripts/syscalls/pid-count.d
[DEBUG]

#!/usr/sbin/dtrace -s
BEGIN {
        printf("tracing, ctrl-c to exit...\n");
}
syscall:::entry
/$target == pid/
{
        @[execname, probefunc] = count();
}


dtrace: script '/dev/stdin' matched 491 probes
CPU     ID                    FUNCTION:NAME
  1      1                           :BEGIN tracing, ctrl-c to exit...
How
Scripts are stored in the /scripts directory in this repository. Inside
there are directories for each section (syscalls, exec, files, etc.) which contain 1. the
actual D scripts that will be executed and 2. a manifest.json file explaining the scripts.
Adding scripts to dtr is as simple as placing them in /scripts/<section> in this repository
Also, for security, no D scripts are "templates", meaning they are NOT generated at runtime. Instead,
they have already been written, and only take user information in the form of a pid, which is passed safely
as ['-p', pid] as part of the arguments to child_process.spawn.
Problems
dtrace: failed to initialize dtrace: DTrace requires additional privileges
dtr can run as a non-root user, but dtrace(1M) needs full super user privileges.
You can run dtr as root using sudo or similar, or specify a prefix command to the invocation
of dtr. Example:
dtr -p sudoWill tell dtr to invoke the DTrace command using sudo
dtr -p pfexecWill do the same using pfexec
dtr -p echoAnd for fun, this will have dtr just print the command it would execute
Usage
$ dtr -h
Usage: dtr [options] [command]

Node.JS wrapper around useful D scripts to lower the bar for entry for using DTrace

options
  -d, --debug           turn on debugging information, defaults to false
  -h, --help            print this message and exit
  -p, --prefix <cmd>    prefix dtrace with cmd when run, ie. "sudo" or "pfexec", defaults to nothing
  -u, --updates         check for available updates
  -v, --version         print the version number and exit
  -w, --width <width>   the width to use for the interactive menu, defaults to 80
License
MIT License