easy-profiler
v2.0.0
Published
easy profiler for node.js application. Debug and find out which part of your code is taking more time, more cpu in an organized way.
Maintainers
 somnathpanja
Readme
easy-profiler | V2.0.0

Simple profiler for your node.js application. Debug and find out which part of your code is taking more time, more cpu in an organized way.
How to install?
npm install easy-profilerAPI List
<returns Null> EP.begin(<key>);
Call this function whenever you want to begin a task
<returns Object> EP.end(<key>, <doPrintInConsole>);
You just need to call EP.end(key) once your task ends. You can call this function only after calling EP.begin(key). You can pass second params as true/false if you want to print the report immediately.
<returns Array of Object> EP.report(true);
If you plan to get consolidated profiling report at one once then call EP.report(true) once everything ends
EP.isEnabled = false;
Disable it in production
How to use?
Basic example
In the example below we will find out how much time it takes to read the file. We need to call EP.begin(String) at the beginning and call EP.end(String) once reading completes is done
require('easy-profiler');

var readFile = EP.begin("READ-FILE");

fs.readFile('/etc/hosts', 'utf8', function (err,data) {
    if (err) {
     return console.log(err);
    }

    console.log(data);
    readFile.end("READ-FILE", true); // second param is true that means it will print the info immediatly
});
Nice way
In the example below we will find out how much time it takes to read the file.
require('easy-profiler');
var fs = require('fs');

// Keep all the keys at one place, plan what are the functions you are going to profile
EP.keys.add({
   READ_FROM_HOST_FILE: "Read from host file",
   HTTP_CALL_TO_WIKI_PAGE: "Http call to wiki page"
})

// SAVE_IN_ORACLE_DB job starts here logically right?
var readFromHost = EP.begin(EP.keys.READ_FROM_HOST_FILE);
fs.readFile('/etc/hosts', 'utf8', function (err,data) {
    if (err) {
     return console.log(err);
    }

    console.log(data);

    // SAVE_IN_ORACLE_DB job ends here
    readFromHost.end(true);
});
Want profiling report at the end only
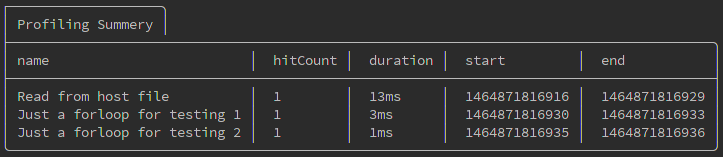
In the example below we will find out how much time it takes to read the file. Also find out how much time is taken by two consecutive for loop
require('easy-profiler');
var fs = require('fs');

// Keep all the keys at one place, plan what are the functions you are going to profile
EP.keys.add({
  READ_FROM_HOST_FILE: "Read from host file",
  JUST_FOR_LOOP_1: "Just a forloop for testing 1",
  JUST_FOR_LOOP_2: "Just a forloop for testing 2"
});

// SAVE_IN_ORACLE_DB job starts here logically right?
var readFromHost = EP.begin(EP.keys.READ_FROM_HOST_FILE);

fs.readFile('/etc/hosts', 'utf8', function (err, data) {
  if (err) {
    return console.log(err);
  }

  console.log(data);

  // SAVE_IN_ORACLE_DB job ends here
  readFromHost.end(EP.keys.READ_FROM_HOST_FILE);


  var loop1 = EP.begin(EP.keys.JUST_FOR_LOOP_1);
  for (var i = 0; i < 1000000; i++) {
    var j = 0 + 9; // Just time pass
  }
  loop1.end();

  var loop2 = EP.begin(EP.keys.JUST_FOR_LOOP_2);
  for (var i = 0; i < 1000000; i++) {
    var j = 0 + 9; // Just time pass
  }
  loop2.end();

  // Yes final report is here
  EP.report(true);
});
Output