
echarts-ng
v0.1.5
Published
Simple angularjs wrap for Baidu echarts.
Downloads
76

Readme
echarts-ng


百度echarts为优秀的图表库,在使用angular封装为指令的时候,发现了部分并不适用于自身项目的地方,在封装中做调整。https://github.com/bornkiller/echarts-ng
运行环境
- angularjs - 1.3+
- echarts - 3.0+
项目使用
bower install echarts-ng --saveangular.module('application', ['echarts-ng']);此封装由$echarts服务与echarts属性指令组成,需配合使用。
基础全局配置如下:
{
  theme: 'macarons',
  driftPalette: true,
  title: {
    left: 'center',
    top: 'top',
    padding: [20, 10, 10, 10]
  },
  backgroundColor: 'rgba(255, 255, 255, .5)',
  legend: {
    left: 'center',
    top: 'top',
    padding: [20, 10, 10, 10]
  },
  tooltip: {
    trigger: 'axis',
    axisPointer: {
      type: 'shadow'
    }
  }
}
可通过以下方式修改默认全局配置方式。
angular.module('application').config(function($echartsProvider) {
  $echartsProvider.setGlobalOption(newGlobalOption)
});- 生成echarts示例标示ID
$scope.DISTRIBUTION_ID = $echarts.generateInstanceIdentity();- 声明echarts必须数据
$scope.distribution = {
    xAxis : [
      {
        type : 'category',
        data : ['周一','周二','周三','周四','周五','周六','周日']
      }
    ],
    yAxis : [
      {
        type : 'value'
      }
    ],
    series : [
      {
        name:'联盟广告',
        type:'bar',
        data:[220, 182, 191, 234, 290, 330, 310]
      }
    ]
};- 使用指令绘制实例
<div echarts="DISTRIBUTION_ID" config="distribution"></div>FAQ
- 当
ID缺失, 指令会直接抛出异常 - 实例容器高度缺失,会导致echarts绘制错误,并不会直接抛出。如果数据正常,绘制异常,务必检查高度问题。
- 在控制器或服务中,可以直接获取到echarts实例,用于
connect,group等操作。
// the param is the instance id generated before
// the method return promise with the instance object
$echarts.queryEchartsInstance($scope.DISTRIBUTION_ID);- 性能考量,指令内部并没有过多
watch,当series为空,实例自动进入loading,当series改变,会自动重绘。 但其他选项并不会触发重绘,如xAxis,tooltip等等,需要显式更新.
// start the specific instance loading
// which triggered automatically when you empty the series
// also, manually operate just fine
$echarts.updateEchartsInstance($scope.DISTRIBUTION_ID);

// update the specific instance
$echarts.updateEchartsInstance($scope.DISTRIBUTION_ID, $scope.distribution);
调色板增强
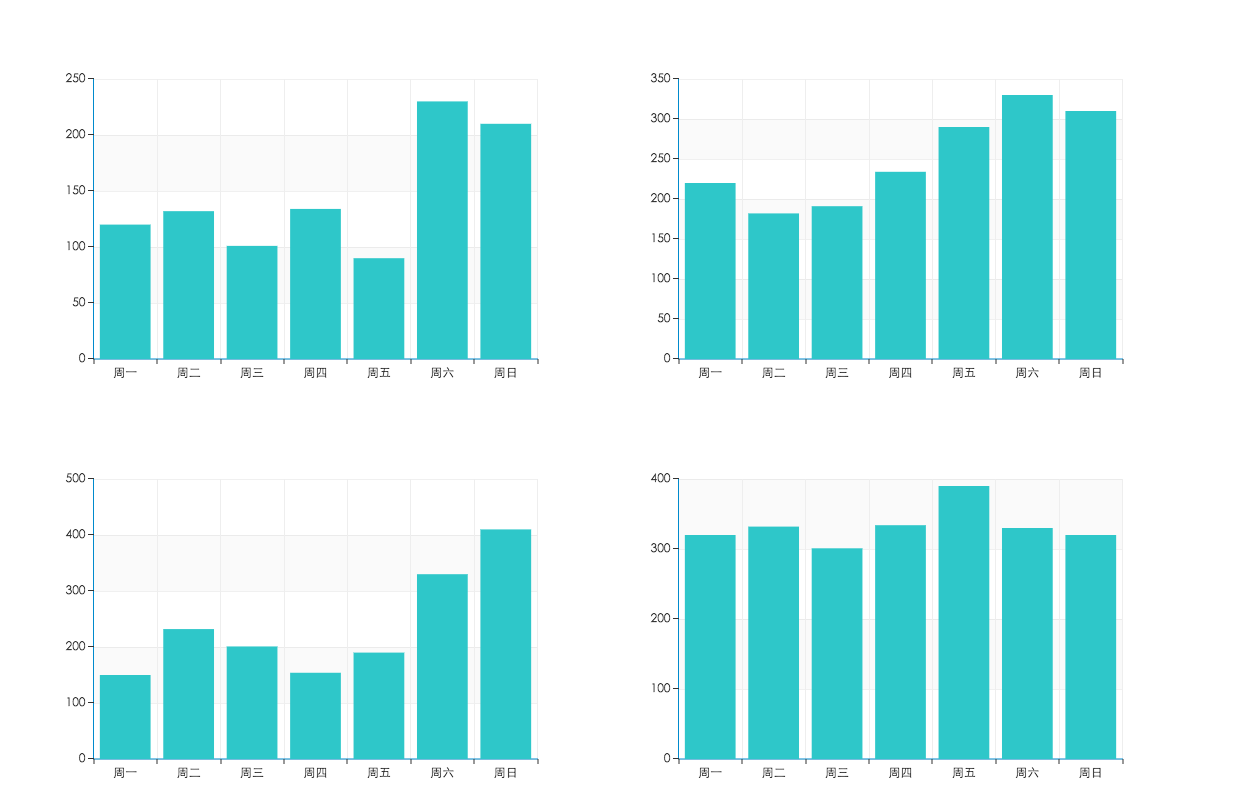
调色板为单实例方式,在实例内部依据顺序选取不同色调。但是不同实例之间并不遵循此原则。在多个类型相似,数据相似,却又无法合并为一个实例时,色彩效果说不上人性化。(此处仅为个人使用偏好)
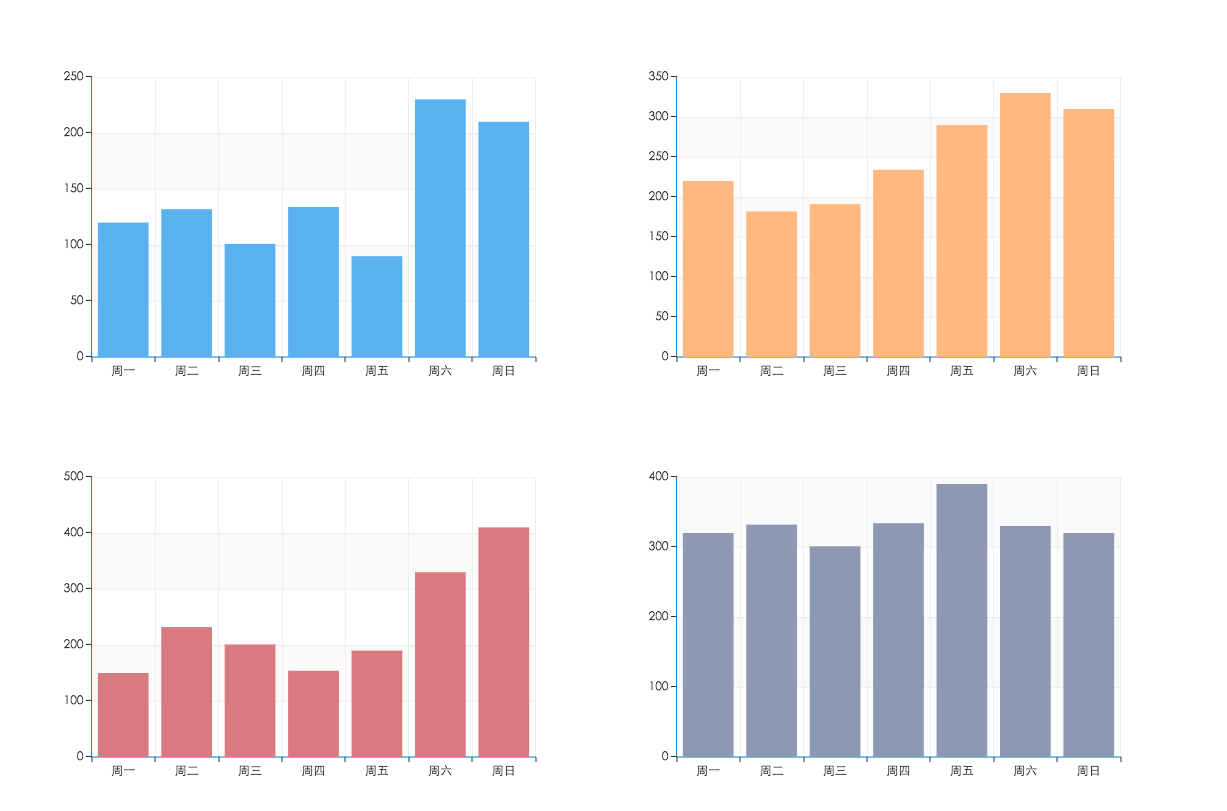
可以修改默认配置driftPalette来修改默认行为。
原始效果
指令封装调整效果
关于tooltip设置
之前使用highcharts作为图表库,tooltip在配置对象直接设置外,另外存在plotOption选项,可以依据不同图表类型,启用不同的tooltip。这个可能存在部分不便,但影响不大。
关于容器盒高度初始化
众所周知,echarts主要实现方式为canvas,从而要求初始化之时容器尺寸必须可知,否则会直接导致错误,且3.0+版本后,会形成静默错误(此处错误为绘制错误,高度为1px)。基于封装,一般容器元素宽度确定,基于此前提,设定echarts-dimension属性,用以传递宽高比,在指令内部设定内嵌样式声明容器高度,保障图表绘制正确。此属性非必须,可以通过CSS方式控制,仅为快捷控制方式。
$scope.distribution = {
  identity: $echarts.generateInstanceIdentity(),
  dimension: '16:9',
  config: {
    xAxis: {
      type: 'category',
      data: ["日用品数", "伙食费", "交通费", "水电费", "房租"]
    },
    yAxis: {
      type: 'value'
    },
    series: [{
      name: '生活费',
      type: 'bar',
      data: [300, 900, 200, 300, 1200]
    }]
  }
};
<div echarts="distribution.identity" echarts-dimension="distribution.dimension" config="distribution.config"></div>关于容器盒高度动态调整
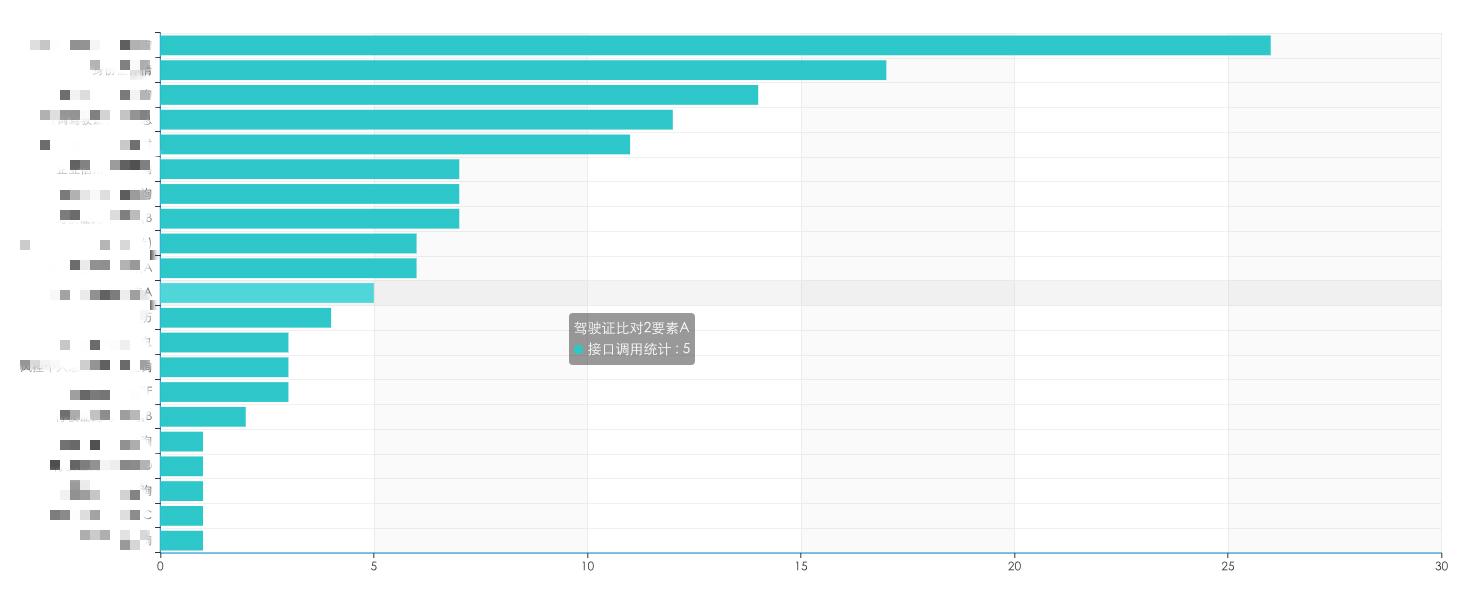
在实际项目中,默认准许宽度固定,但是碰到比较棘手的问题(主要为条形图)。基于不同条件统计,会出现不同的统计项(category数据不同),如果高度保持定高,便会出现单个条块过高的现象。
如果以多条目为准设定高度,效果符合预期。
但切换条目较少的数据源后,效果勉强可以接受。
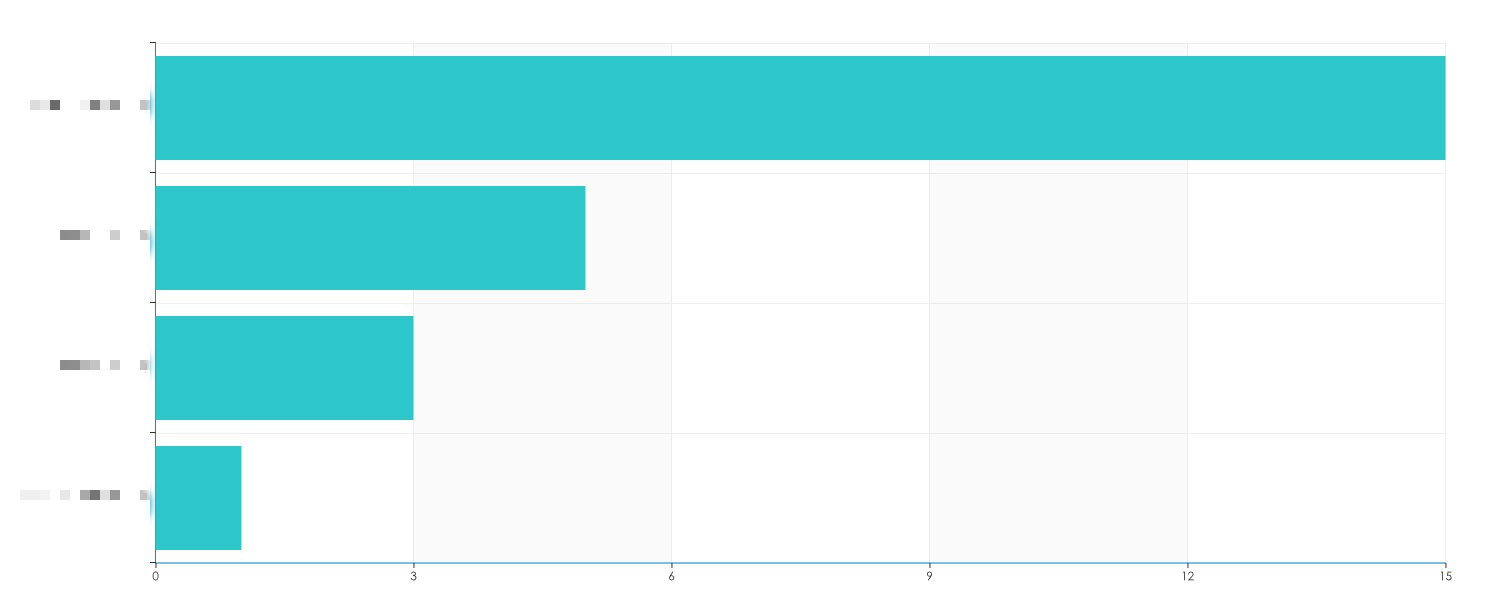
当存在单条目极端值,效果几乎惨不忍睹。
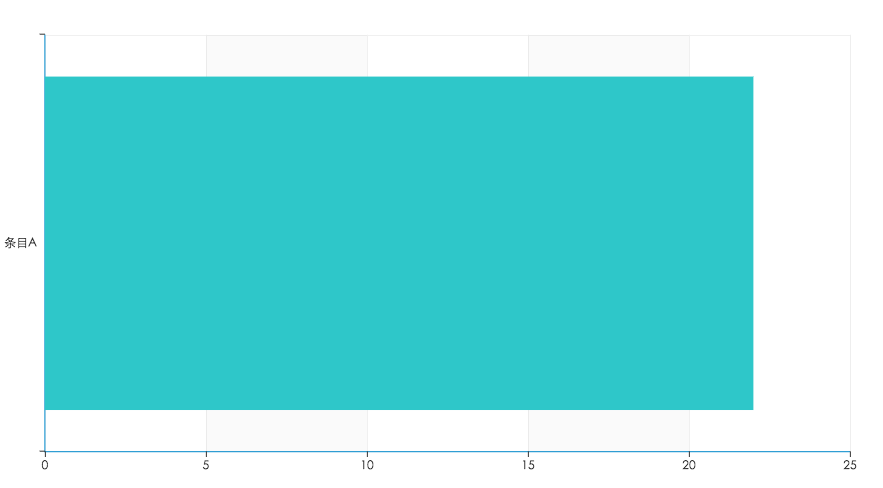
所以需要根据series数据动态调整容器高度的能力。在实际项目中,为了应对这种情况,大量使用ng-style,获取数据后,在控制器或服务内部计算相应的高度。当然这种方案并无不妥,但是自以为动态调整高度的事情应该交给图表来实现,所以在封装中添加动态调整高度。目前实现的方式有很大限制,图表类型必须为bar,而且Y坐标轴为category, 在config中指定dynamic: true即可,否则可能出现异常结果。简单测试效果如下:
极端单项表现:
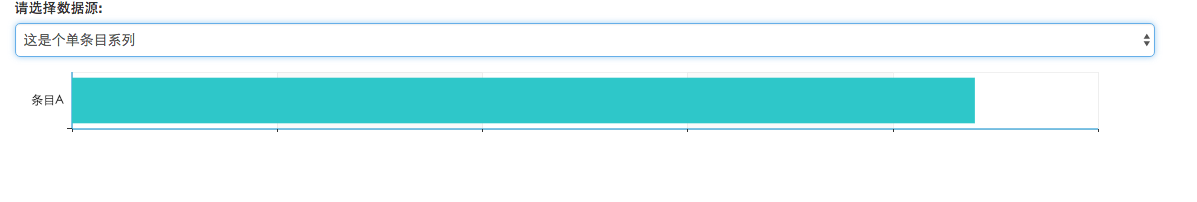
较少三项表现:
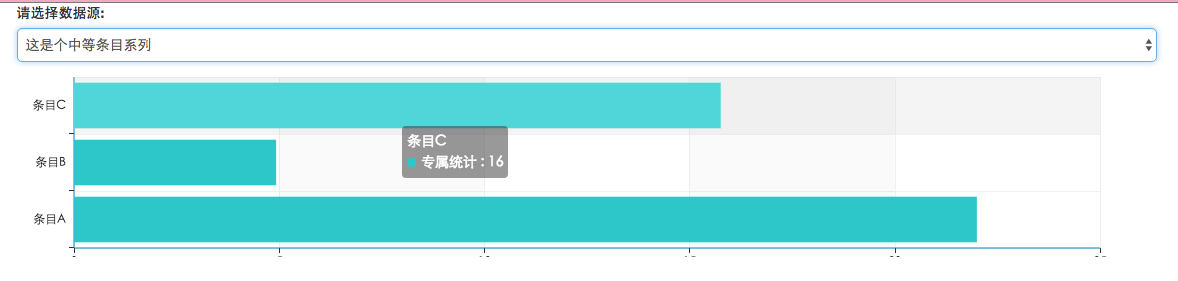
正常多项表现:
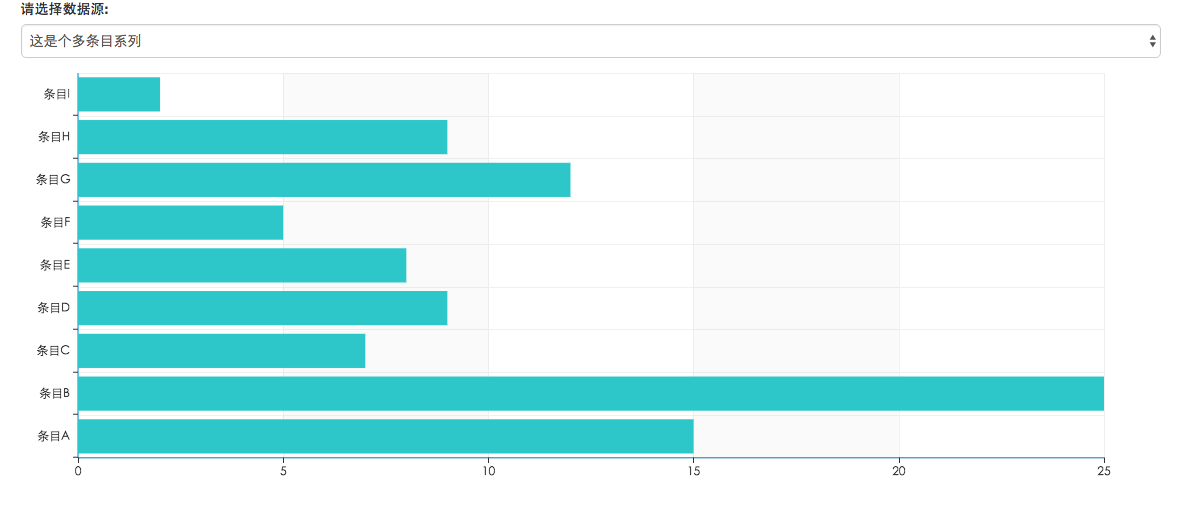
全部代码如下:
<form class="form">
  <div class="form-group">
    <label class="control-label" for="data-source">请选择数据源:</label>
    <select class="form-control" id="data-source"
          ng-options="item as item.description for item in optionalDistributionList" ng-model="chosenDistribution"
      ng-change="handleDistributionChange(chosenDistribution)">
      <option value="">请选择数据源:</option>
    </select>
  </div>
</form>
<section class="row">
  <div echarts="distribution.identity" echarts-dimension="distribution.dimension" config="distribution.config"></div>
</section>
$scope.optionalDistributionList = [
{
account: 'World',
description: '这是个多条目系列',
config: {
xAxis: {
type: "value"
},
yAxis: {
type: "category",
data: ["条目A", "条目B", "条目C", "条目D", "条目E", "条目F", " 条目G", "条目H", "条目I"]
},
dynamic: true,
series: [{
name: "专属统计",
type: "bar",
data: [15, 25, 7, 9, 8, 5, 12, 9, 2]
}]
}
},
{
account: 'Medium',
description: '这是个中等条目系列',
config: {
xAxis: {
type: 'value'
},
yAxis: {
type: 'category',
data: ["条目A", "条目B", "条目C"]
},
dynamic: true,
series: [{
name: '专属统计',
type: 'bar',
data: [22, 5, 16]
}]
}
},
{
account: 'Single',
description: '这是个单条目系列',
config: {
xAxis: {
type: 'value'
},
yAxis: {
type: 'category',
data: ["条目A"]
},
dynamic: true,
series: [{
name: '专属统计',
type: 'bar',
data: [22]
}]
}
}
];
$scope.chosenDistribution = $scope.optionalDistributionList[0];
$scope.distribution = {
identity: $echarts.generateInstanceIdentity(),
dimension: '16:9',
config: $scope.chosenDistribution.config
};
$scope.handleDistributionChange = function(item) {
$scope.distribution.config = item.config;
};关于瀑布流
highcharts存在专用的{type: 'waterfall'},echarts并没有专用类型,一般通过条形图+辅助条形图配合stack属性来实现,此处会进行简化增强。部分代码如下所示:
<div echarts="distribution.identity" config="distribution.config"></div>$scope.distribution = {
identity: $echarts.generateInstanceIdentity(),
config: {
xAxis: {
type: 'category',
splitLine: {show: false},
data: ["日用品数", "伙食费", "交通费", "水电费", "房租", "总费用"]
},
yAxis: {
type: 'value'
},
series: [{
name: '生活费',
type: 'waterfall',
data: [300, 900, 200, 300, 1200, 2900]
}]
}
};瀑布流对series要求仅含有单项数据,且图表类型必须为waterfall,表示开启waterfall处理方式。如上述代码所示。否则不会进行增强处理。
未开启瀑布流效果如下所示:
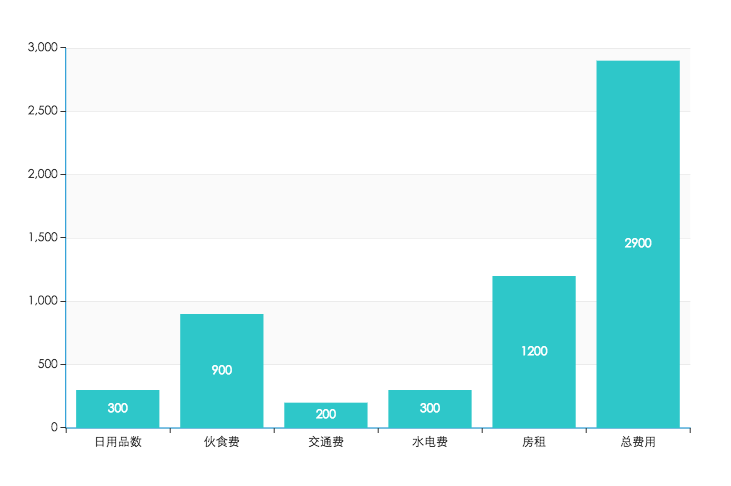
开启瀑布流效果如下所示:

同时需要注意,在显示调用对应方法更新图表时,必须注明waterfall选项,如下所示:
$echarts.updateEchartsInstance($scope.distribution.identity, {
  series: [{
    name: '生活费',
    type: 'waterfall',
    data: [400, 1000, 100, 400, 1100, 3000]
  }]
})
distribution
// dependencies for Subsequent example
bower install;
npm install
license
MIT