
echarts-pie3d-gl
v1.0.2
Published
把 echarts 环形图配置直接渲染成 3D 立体环形图(基于 echarts-gl surface 参数方程)

Maintainers
 lvminjie
Readme
echarts-pie3d-gl
当前版本 v1.0.2 · 更新日志 · MIT 许可
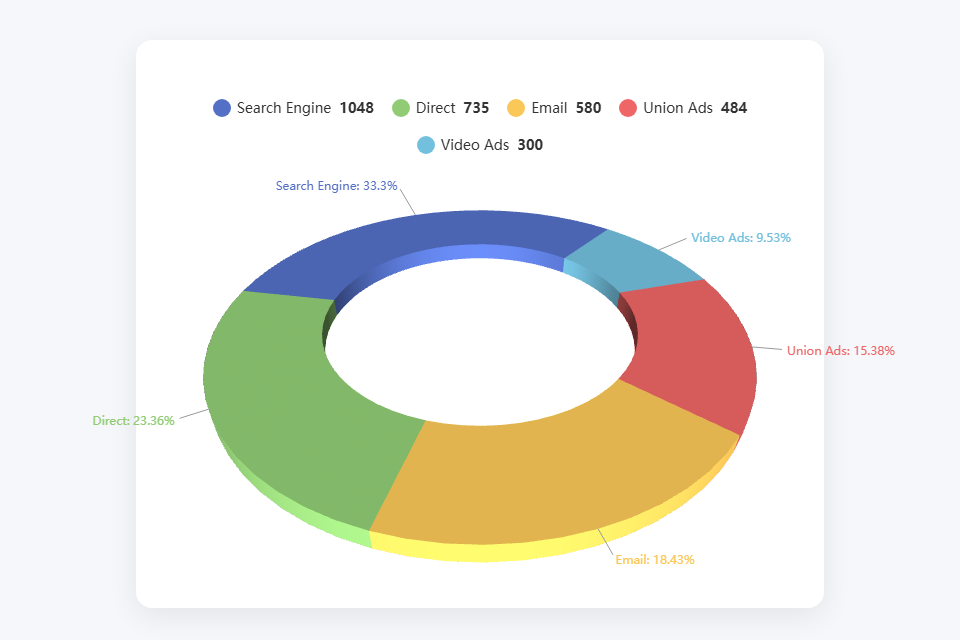
把一份普通的 echarts 环形图配置直接渲染成 3D 立体环形图。你基本不用改原来的 echarts pie 配置,createRing3D(el, option) 一包就出 3D。
特性
- 入参长得像 echarts 环形图:
color/tooltip/legend/series[0].data / radius / label / itemStyle / emphasis都能用 - 扇区上下四条棱支持圆角(
borderRadius);扇区之间是否留缝由gap控制 - hover 时扇区抬升、标签放大,带 220ms 缓动(扇区之间切换时新旧动画同时进行)
autoRotate自动旋转时标签跟着转;鼠标一进扇区就暂停旋转,移开自动恢复- 图例、标签用浮层实现(echarts-gl 的 surface 吃不到原生 legend / label)
- 不打包 echarts / echarts-gl,它们是 peer 依赖
依赖
必须先加载 echarts(>=5) 和 echarts-gl(>=2)。3D 的 surface 系列由 echarts-gl 提供,少了它不出图;npm 场景必须自己 import 'echarts-gl' 一次,否则有图例没环。
安装
npm install echarts-pie3d-gl echarts echarts-gl
# pnpm add echarts-pie3d-gl echarts echarts-gl
# yarn add echarts-pie3d-gl echarts echarts-gl
用法
不用打包工具:CDN
下面这份是完整可运行的例子,存成 .html 双击就能打开,不需要起本地服务:
<!DOCTYPE html>
<html lang="zh-CN">
<head><meta charset="utf-8"><title>echarts-pie3d-gl</title></head>
<body>
  <div id="main" style="width:640px;height:520px"></div>

  <script src="https://unpkg.com/[email protected]/dist/echarts.min.js"></script>
  <script src="https://unpkg.com/[email protected]/dist/echarts-gl.min.js"></script>
  <script src="https://unpkg.com/echarts-pie3d-gl/dist/echarts-pie3d.min.js"></script>
  <script>
    var option = {
      color: ['#4a90d9', '#2dd4bf', '#f59e0b', '#ef4444', '#9a60b4'],
      tooltip: { trigger: 'item', formatter: '{b}: {c} ({d}%)' },
      legend: { show: true, top: '5%', left: 'center', icon: 'circle', showValue: true },
      series: [{
        type: 'pie',
        radius: ['40%', '70%'],
        label: { show: true, position: 'outside', formatter: '{b}: {d}%' },
        emphasis: { label: { show: true, fontSize: 40, fontWeight: 'bold' } },
        data: [
          { value: 1048, name: 'Search Engine' },
          { value: 735, name: 'Direct' },
          { value: 580, name: 'Email' },
          { value: 484, name: 'Union Ads' },
          { value: 300, name: 'Video Ads' }
        ]
      }]
    };

    // 全局名是 EChartsPie3D
    var chart = EChartsPie3D.createRing3D(document.getElementById('main'), option);
    window.addEventListener('resize', function () { chart.resize(); });
  </script>
</body>
</html>
CDN 用法下 echarts 从 window.echarts 取,不会走动态 import。想换源用 jsdelivr:
<script src="https://cdn.jsdelivr.net/npm/[email protected]/dist/echarts.min.js"></script>
<script src="https://cdn.jsdelivr.net/npm/[email protected]/dist/echarts-gl.min.js"></script>
<script src="https://cdn.jsdelivr.net/npm/echarts-pie3d-gl/dist/echarts-pie3d.min.js"></script>
用打包工具:ESM
import * as echarts from 'echarts';
import 'echarts-gl';                       // 必须引一次,否则有图例没环
import { createRing3D } from 'echarts-pie3d-gl';

const option = { /* 同上 */ };

const chart = createRing3D(document.getElementById('main'), option);
window.addEventListener('resize', () => chart.resize());
<script type="module">在file://协议下会被浏览器 CORS 策略拦住,必须起本地服务:npx serve .或python -m http.server 8080。
API
createRing3D(container, option, config?)
函数式入口,内部就是 new Ring3D(container, option, config)。
container:HTMLElement 或选择器字符串option:见下方参数表config.echarts:手动注入 echarts 实例(模块化环境不想全局引时用)
实例方法:
| 方法 | 说明 |
| --- | --- |
| setOption(option) | 重新设置配置(会重建) |
| resize() | 容器尺寸变化后调用 |
| dispose() | 销毁,解绑所有事件与循环 |
| chart.chart | 拿到原始 echarts 实例 |
| chart.on / off | 转发 echarts 事件 |
另外还导出这些纯函数,方便二次加工:buildOption / resolveConfig / resolveItems / resolveLegend / normalizeLabel / getParametricEquation / ratioToK / normalizeRadius / radiusToGeometry / radiusToInnerRatio / radiusToOuterScale / normalizeHeight / normalizeHeightPair / normalizeNumber / startAngleToRadian / computeRatios / applyGap / midRadian / outerRadius / clampBorderRadius / resolveBorderRadius / DEFAULTS / DEFAULT_PALETTE,以及各参数的上下界常量(MAX_BORDER_RADIUS / MIN_HEIGHT / MAX_HEIGHT / MIN_HOVER_SCALE / MAX_HOVER_SCALE / MIN_DISTANCE / MAX_DISTANCE / MIN_ALPHA / MAX_ALPHA / MIN_BOX_HEIGHT / MAX_BOX_HEIGHT / MIN_AUTO_ROTATE_SPEED / MAX_AUTO_ROTATE_SPEED)。
参数
顶层
| 参数 | 类型 | 默认 | 说明 |
| --- | --- | --- | --- |
| color | string[] | echarts 默认调色板 | 调色板,数据项没写色时按索引取 |
| tooltip | object | { trigger:'item' } | 透传 echarts 原生 tooltip。formatter 支持函数和字符串模板({a}系列名 / {b}数据名 / {c}数值 / {d}百分比);另有 valueFormatter、backgroundColor、borderColor、borderWidth、textStyle、extraCssText、confine、padding 等样式项。注意 trigger 被强制为 'item' |
| legend | object | — | 见「legend」表 |
| height | number | 15 | 扇区厚度(同时决定顶面高度)。范围 0 ~ 200,越界/非法自动钳制并 console.warn。series 上写同名参数优先 |
| hoverHeight | number | 18 | hover 时的厚度。范围 0 ~ 200,且必须 >= height(写小了会被抬到 height) |
| hoverScale | number | 1.05 | hover 时的径向放大倍数。范围 0.5 ~ 1.3 |
| alpha | number | 35 | 俯视角,越大越俯视。范围 -90 ~ 90 |
| distance | number | 220 | 相机距离,越大环形越小。范围 100 ~ 400(box 单位,不是像素) |
| boxHeight | number | 6 | grid3D.boxHeight,z 轴盒子尺寸。范围 1 ~ 100 |
| autoRotate | boolean | false | 自动旋转。只有字面 true 才生效(1 / 'true' 都算关闭)。打开后 hover 扇区会暂停旋转、标签会跟随旋转 |
| autoRotateSpeed | number | 10 | 自动旋转速度(度/秒)。范围 -360 ~ 360,保留符号(负值反向旋转) |
| light | object | echarts-gl 默认 | 透传 grid3D.light |
| viewControl | object | — | 覆盖 grid3D.viewControl(如自定义 rotateSensitivity) |
legend
| 参数 | 类型 | 默认 | 说明 |
| --- | --- | --- | --- |
| show | boolean | true | 关掉后不渲染图例浮层 |
| orient | 'horizontal' \| 'vertical' | 'horizontal' | 排布方向 |
| left / right / top / bottom | number \| string | — | 数字按 px;'center' / 'middle' 表示该方向居中 |
| icon | 'circle' \| 'rect' \| 'roundRect' | 'circle' | 色块形状 |
| itemWidth / itemHeight | number | 18 | 色块尺寸 |
| itemGap | number | 18 | 项间距 |
| formatter | string \| function | — | 名称格式化,'{name}' 模板或 (name, item) => string |
| showValue | boolean | true | 图例是否带数值(原生 echarts 不带,本库默认带) |
| valueFormatter | function | — | (value, item) => string |
| selectedMode | boolean \| 'single' | true | 点击图例切换显示;'single' 单选 |
| textStyle | object | {color:'#333',fontSize:14} | 文字样式 |
series[0]
| 参数 | 类型 | 默认 | 说明 |
| --- | --- | --- | --- |
| type | 'pie' | — | 接受 pie,内部转 surface |
| name | string | — | 系列名,tooltip 的 params.seriesName 取它 |
| data | Array | — | { value, name, itemStyle: { color } } |
| radius | array \| string \| number | ['40%','70%'] | [内, 外]。画实心饼:给单值('70%')或内径给 0(['0%','70%'])。数字按百分比口径(50 和 '50%' 都是 50%);内外写反会自动交换;越界钳制并 warn |
| startAngle | number | 90 | 起始角(度)。方向为逆时针,与 echarts 环形图默认相反 |
| itemStyle.opacity | number | 1 | 扇区透明度。建议保持 1:小于 1 时 echarts-gl 对透明网格按距离排序,扇区会出现互相覆盖的渲染错觉 |
| itemStyle.borderColor | color | — | 不生效:缝里看到的是扇区自己的端面。想要"缝隙感"用 gap |
| gap | number | 0 | 3D 独有:扇区之间的缝隙(占整圈比例,0~0.9)。如 0.01 ≈ 3.6° |
| borderRadius | number | 0 | 3D 独有:扇区截面圆角半径,范围 0 ~ 0.5,超出自动钳制,0 = 直角。见下方「圆角」 |
| label | object | — | 标签配置,字段见下方「label」 |
| labelLine | object | — | 引导线配置,字段见下方「labelLine」 |
| emphasis | object | — | hover 态配置,字段见下方「emphasis」 |
| height 等所有 3D 参数 | — | — | 同顶层,series 上写优先 |
label
| 字段 | 类型 | 默认 | 说明 |
| --- | --- | --- | --- |
| show | boolean | true | 是否显示标签 |
| position | 'outside' \| 'inside' \| 'center' | 'outside' | 标签位置。'inside' / 'center' / 'inner' 都按环中线处理;'left' / 'right' / 'top' / 'bottom' 按普通 outside 处理 |
| formatter | string \| function | {name}: {percent}% | 字符串模板或函数。模板可用 {a}=系列名(没给则回退数据名)、{b}=数据名、{c}=数值、{d}=百分比,另有具名写法 {name} / {value} / {percent} / {seriesName};函数形式入参为 { name, value, percent, seriesName, color, dataIndex, data } |
| color | color | 该扇区的颜色 | 文字颜色 |
| fontSize | number | 12 | 字号 |
| fontWeight | string \| number | 'normal' | 字重 |
| distance | number | 5 | 标签末端与引导线终点的间距(px) |
labelLine
| 字段 | 类型 | 默认 | 说明 |
| --- | --- | --- | --- |
| show | boolean | true | 是否显示引导线 |
| length | number | 15 | 第一段长度(px) |
| length2 | number | 15 | 第二段长度(px) |
| lineStyle.color | color | '#999' | 引导线颜色 |
| lineStyle.width | number | 1 | 引导线粗细 |
emphasis
| 字段 | 类型 | 默认 | 说明 |
| --- | --- | --- | --- |
| disabled | boolean | false | 为 true 时该系列不参与 hover(不抬升、不套 emphasis 样式) |
| label | object | — | hover 时的标签配置,字段同「label」,差别见下方 |
| itemStyle | object | — | hover 时盖在扇区上的样式(3D 里没有原生 emphasis.itemStyle,由本库手动盖上) |
emphasis.label 的字段与「label」完全相同,差别在两点:
show是三态语义(这是最容易搞混的地方):|
emphasis.label.show| 行为 | | --- | --- | | 显式true| hover 时套 emphasis 样式。即使label.show: false也能把标签"救"回来 | | 显式false| 完全不套 emphasis 样式,hover 时退回普通标签(注意:这不是"hover 隐藏标签") | | 不给 | 不干预显隐,只提供 hover 的样式放大;显隐继承label.show|没写的字段继承
label:fontSize没写时继承label.fontSize(不会把 20px 的标签缩回默认 12px),position/formatter/color同理。只有你显式写了的项才在 hover 时生效。
圆角(borderRadius)
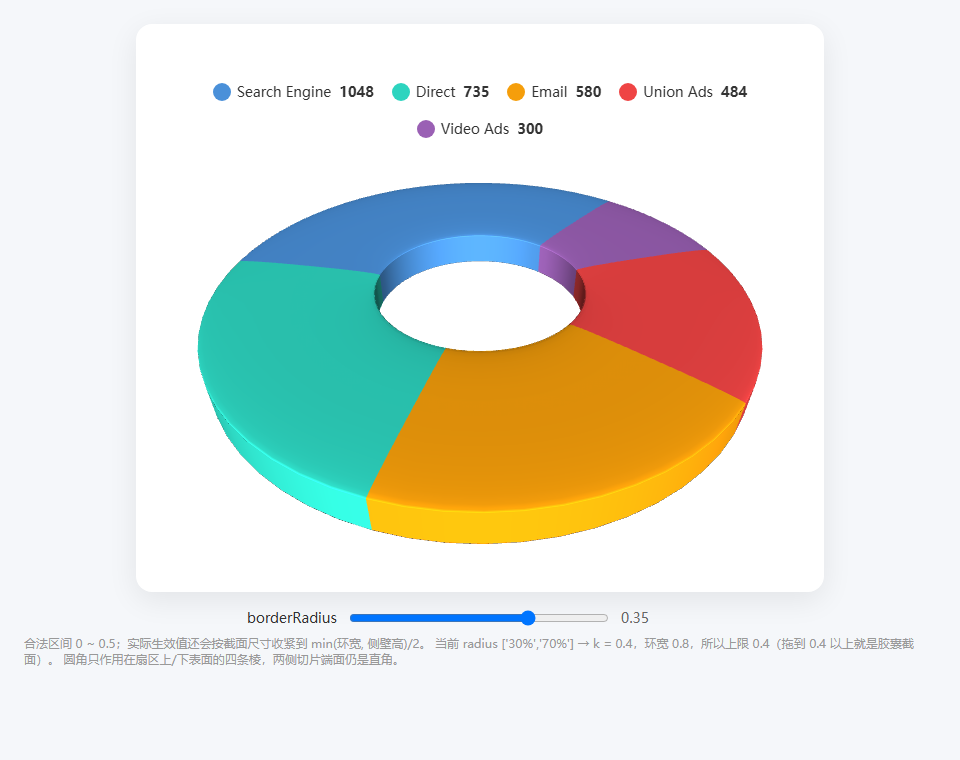
- 只作用在上/下表面的四条棱(截面圆角),不作用于扇区两侧的切片端面。周向倒角会让扇区在角方向上收缩或外扩、有互相重叠/露缝的风险,所以不做;想要"缝隙感"用
gap。 - 圆角只削掉角上的材料、绝不外扩:外沿最大半径仍等于外径、内沿仍等于内径,相邻扇区不会互相重叠。
- hover 时
hoverScale是在截面算完之后才乘上去的,圆角会被同比放大(视觉上跟着扇区一起放大)。
已知限制
- 必须在支持 WebGL 的环境跑,纯 Canvas 或老浏览器不行。
center不生效,环形在 3D 盒子里固定居中。label.position的'left' / 'right' / 'top' / 'bottom'按普通outside处理(沿扇区中角向外)。- 标签和图例是叠在图表上的浮层。标签位置优先用
grid3D坐标系 + 相机矩阵投影,不可用时降级为正交投影;越界的标签会夹回容器边缘。 itemStyle.opacity < 1会有渲染错觉(见参数表);itemStyle.borderColor不生效;开了gap > 0才会补端面。- 图例浮层依赖父容器有定位(库会自动把
position: static的容器设成relative)。 - 开了
autoRotate时,鼠标在容器内但没压着扇区(环外空白、甜甜圈中间的洞)时 hover 的收尾可能有 1~2 帧延迟;扇区边缘 1~2px 的过渡带在极端视角(alpha接近 ±90)下理论上可能有一次误判。
开发
npm install
npm run build   # 产出 dist 三形态
npm test # 279 条src/7 个模块:index.js入口、geometry.js参数方程、option.jsoption 构建、chart.js主类、overlay.js浮层、defaults.js默认值、util.js工具- ⚠️
demo/只在 GitHub 仓库里有,npm 包不含demo/(files只发布dist/src/README.md/CHANGELOG.md/LICENSE)
从 0.2.x 升级
1.0.0 是第一个稳定版本。从 0.2.x 升级有若干行为变更(如 emphasis.label.fontSize 改为继承 label.fontSize、autoRotate 打开后 hover 会暂停旋转),完整清单见 CHANGELOG.md。