
eventflowviz
v1.0.2
Published
Event flow visualization based on D3.js time scale
Maintainers
 sujitkulkarni
Readme


Table Of Contents
About The Project
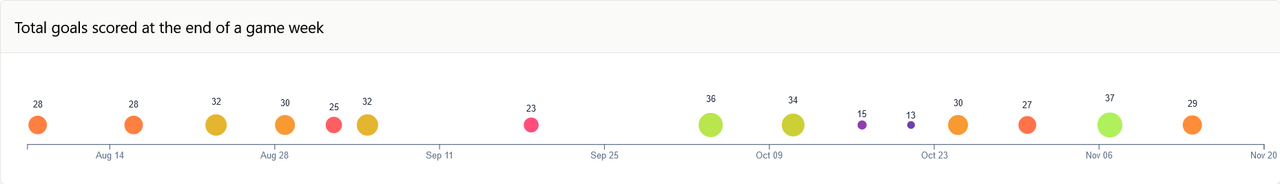
This is a npm package that allows you to create a time scale based visualization using the d3.js library. The visualization consists of a time scale on the x-axis and colored circles on the y-axis, representing events at a specific point in time. The radius of the circles is proportional to the size of the event as provided in the data.
Built With
- d3's time scale
- Typescript
Getting Started
It's pretty simple to consume this package.
Prerequisites
NPM Package
npm install eventflowviz@latest --saveUsage
To start with, the following block of HTML is required for the library to inject the DOM generated to render the visualization.
<div id="{yourId}" class="d3-event-flow">
  <svg class="svg"></svg>
</div>
The id attribute can be dynamic, whereas the class values should not be the same as given here.
Next, in your .js|x or ts|x file,
import D3EventFlowViz from "eventflowviz";

const data = [{
    time: "2022-06-14T12:34:56Z",
    event: "Annual Meeting",
    label: "Business",
    size: 86
  },
  {
    time: "2022-07-28T09:15:00Z",
    event: "Charity Walk",
    label: "Community",
    size: 37
  },
...
];
...
const viz = new D3EventFlowViz({
  width:500,
  height:300,
  margin: {
    top: 15,
    left: 15,
    right: 15,
    bottom: 15,
  },
  id:'yourID', // must be exactly what specified in the HTML
  data,
  dot: {
    radius: 15,
  }
});

viz.draw(); // job=done
...
}
Roadmap
To-dos:
- [ ] Responsive to viewport
- [ ] Make it data aware at the runtime (currently does not go well with the live data changes such as data passed from React states that would change some time later)
- [ ] Allow user to make event marker customizations
Contributing
Contributions are what make the open source community such an amazing place to be learn, inspire, and create. Any contributions you make are greatly appreciated.
- If you have suggestions for adding or removing projects, feel free to open an issue to discuss it, or directly create a pull request after you edit the README.md file with necessary changes.
- Please make sure you check your spelling and grammar.
- Create individual PR for each suggestion.
- Please also read through the Code Of Conduct before posting your first idea as well.
Creating A Pull Request
- Fork the Project
- Create your Feature Branch (
git checkout -b feature/AmazingFeature) - Commit your Changes (
git commit -m 'Add some AmazingFeature') - Push to the Branch (
git push origin feature/AmazingFeature) - Open a Pull Request
License
Distributed under the MIT License. See LICENSE for more information.
Authors
- Sujit Kulkarni - Cloud Consultant at Rapid Circle - Sujit Kulkarni - I created this while still deep diving into D3.js