
expo-redux-logger
v2.0.0
Published
redux logger for Expo project


Readme
Redux Logger for Expo
- super simple redux logger specifically designed for Expo projects
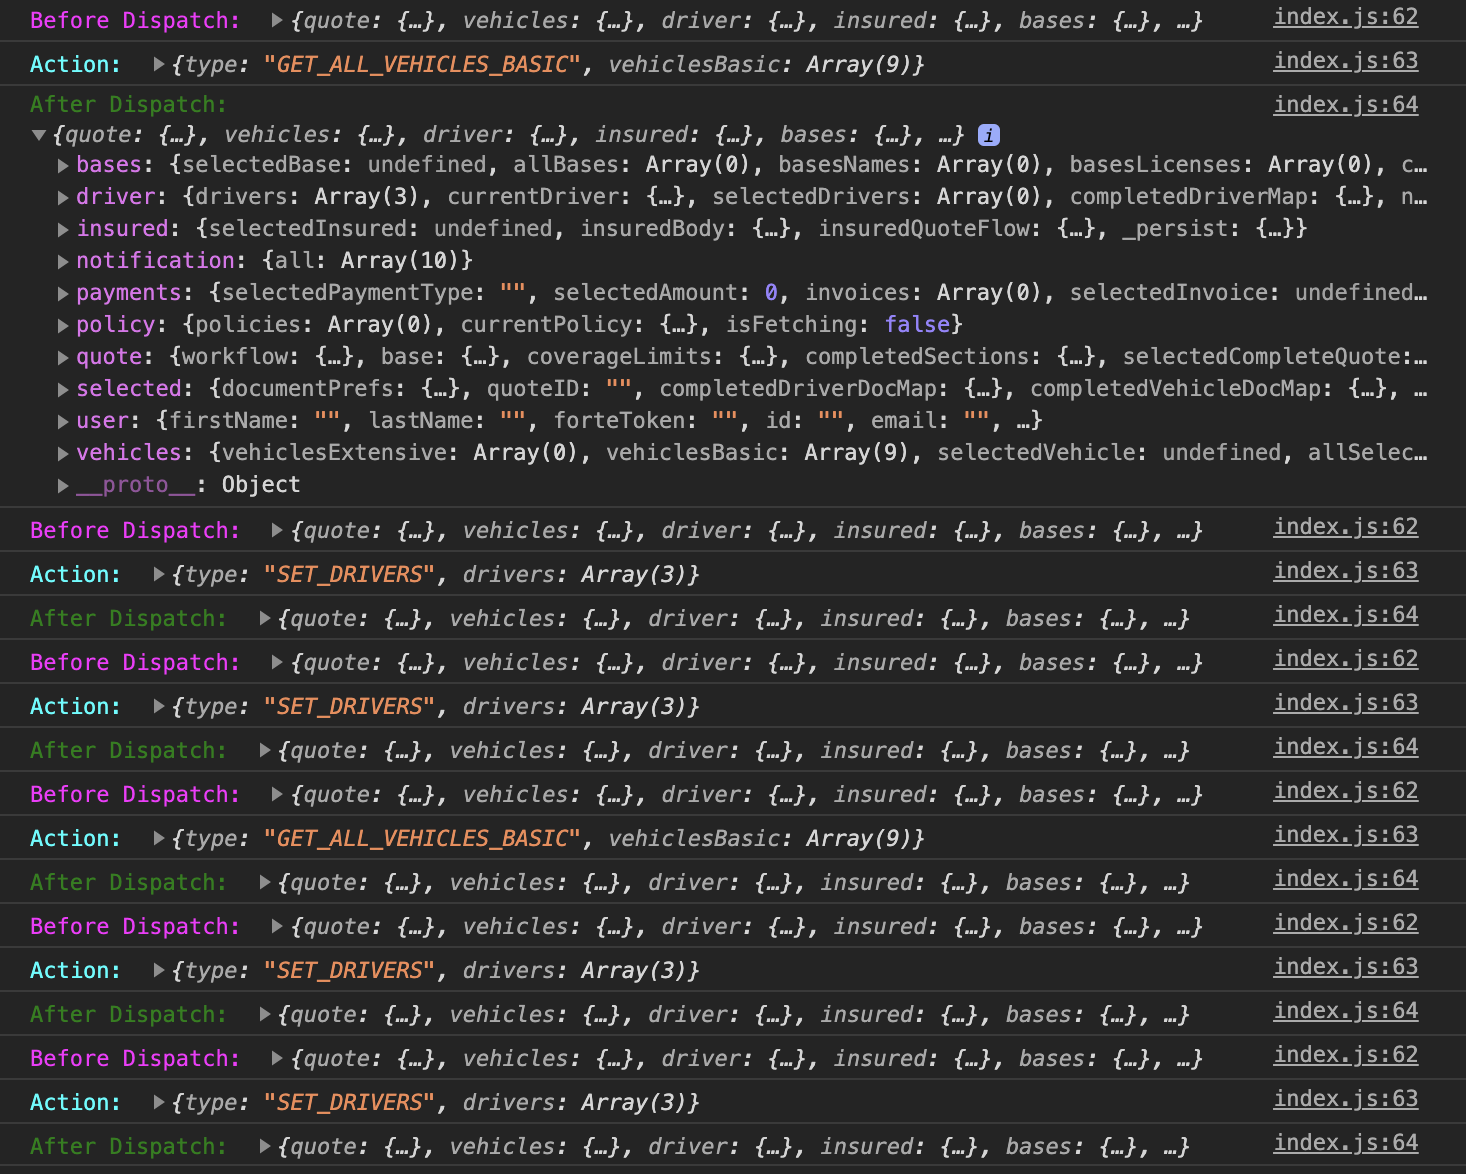
- the main advantage of using this logger over other redux loggers, is it allows you to separate your redux logs from your other logs
Why Use this Package?
- separate your redux logs from other logs when remote debugging
- prevent your console from being overrun with redux logs!
Install
`npm i expo-redux-logger
Basic Usage
First, enable remote debugging when you are running your Expo project. If you don't know how see 'How To Enable Remote Debugging With Chrome' section below. Now, when your redux state changes, you will see those logs in the remote console, but your terminal will only display your non-redux console.log statements. This makes it much easier to find logs you are looking for without having to entirely remove logging middleware.
import { applyMiddleware, createStore } from "redux";
import { expoLogger } from "expo-redux-logger";

const store = createStore(reducer, applyMiddleware(expoLogger));
Helpful iOS Simulator Shortcuts for mac
This isn't specific to this package, but I thought I would include these shortcuts because sometimes enabling remote debugging causes some strange errors when using expo and you just need to restart it.
- normal restart - cmd+ctrl+z to reveal dev menu, then press Reload
- if normal restart isn't working - press shitf+ctrl+cmd+h to open app-switcher, swipe up to close expo app, re-open expo app
How To Enable Remote Debugging With Chrome
This package also works with the normal React-Native remote debugger as long as your project is managed by Expo https://docs.expo.io/workflow/debugging/
You can debug Expo apps using the Chrome debugger tools. Rather than running your app's JavaScript on your phone, it will instead run it inside of a webworker in Chrome. You can then set breakpoints, inspect variables, execute code, etc, as you would when debugging a web app.
To ensure the best debugging experience, first change your host type in Expo Dev Tools to LAN or localhost. If you use Tunnel with debugging enabled, you are likely to experience so much latency that your app is unusable. While here, also ensure that Development Mode is checked.
If you are using LAN, make sure your device is on the same wifi network as your development machine. This may not work on some public networks. localhost will not work for iOS unless you are in the simulator, and it only work on Android if your device is connected to your machine via usb.
Open the app on your device, reveal the developer menu (cmd+ctrl+z for iOS simulator) then tap on Debug JS Remotely. This should open up a Chrome tab with the URL http://localhost:19000/debugger-ui. From there, you can set breakpoints and interact through the JavaScript console. Shake the device and stop Chrome debugging when you're done.
Line numbers for console.log statements don't work by default when using Chrome debugging. To get correct line numbers open up the Chrome Dev Tools settings, go to the "Blackboxing" tab, make sure that "Blackbox content scripts" is checked, and add expo/build/logs/RemoteConsole.js as a pattern with "Blackbox" selected.
License
MIT