
express-dev-panel
v1.0.1
Published
Zero-config dev panel for Express: live SSE logs, route inspector with editor deep-links, system stats, and DB health all in one beautiful page.

Maintainers
 dvsxdev
Readme
express-dev-panel
A zero-config developer panel for Express applications. Drop-in middleware that gives you a beautiful single-page dashboard with:
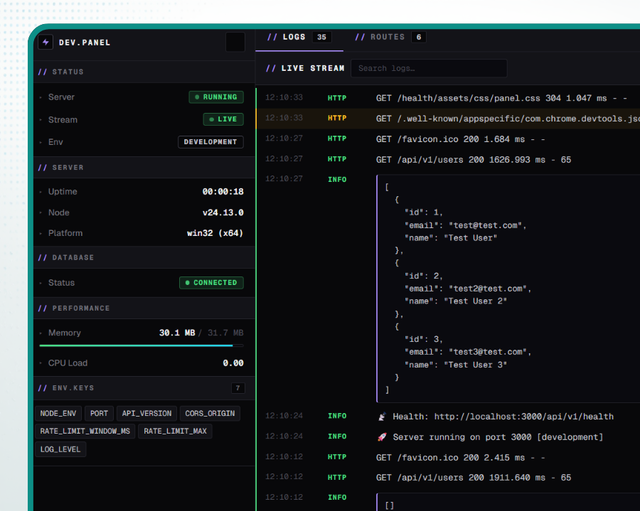
- Live log stream over Server-Sent Events with level filters and full-text search
- Route inspector that walks your Express app and lists every route with its HTTP method, path, parameters, handler chain, and mount breadcrumb
- Editor deep-links - click any route or handler name to jump straight to the source file at the exact line in VS Code, Cursor, WebStorm, IntelliJ, PhpStorm or PyCharm
- System stats - uptime, Node version, platform, memory, CPU load, env keys
- Optional DB health pill when you wire up a
getDbStatuscallback
Install
npm install express-dev-panelQuick start
import express from 'express';
import { createPanel } from 'express-dev-panel';

const app = express();

// ... your routes

if (process.env.NODE_ENV !== 'production') {
  app.use(
    createPanel(app, {
      prefix: '/__panel', // default value
    }),
  );
}

app.listen(3000);
Open http://localhost:3000/__panel.
Options
createPanel(app, {
  /** URL prefix the panel is mounted under. Default: '/__panel' */
  prefix: '/__panel',

  /** Optional async DB health check; if omitted the DB pill is hidden. */
  getDbStatus: async () => {
    try {
      await prisma.$queryRaw`SELECT 1`;
      return 'connected';
    } catch {
      return 'disconnected';
    }
  },

  /** Env keys to display in the sidebar. Array of names or a function returning names.
   *  Default: all keys from process.env. */
  envKeys: ['NODE_ENV', 'PORT', 'DATABASE_URL'],

  /** Max number of in-memory log entries kept for replay on connect. Default 200. */
  maxLogs: 200,

  /** How frequently (ms) to push system stats over SSE. Default 1000. */
  statsIntervalMs: 1000,

  /**
   * Auto-route `console.log` / `console.info` / `console.warn` / `console.error`
   * into the panel logs. Original stdout/stderr output is preserved - this only
   * adds capture, it does not replace the streams. Default `true`.
   * Set to `false` to opt out (e.g. if you wire your own capture via `captureConsole()`
   * or feed logs exclusively through the built-in `logger` / a winston transport).
   */
  captureConsole: true,
});
Feeding logs into the panel
The panel keeps an in-memory ring buffer of log entries and pushes them to connected browsers via SSE. Pick whichever feeder fits your stack:
Option A - built-in logger (recommended, zero config)
The package ships with a panel-aware logger. Anything you log is mirrored to your console and to the dev panel automatically - no winston, no transport wiring.
import { logger } from 'express-dev-panel';

logger.info('Server started on port 3000');
logger.warn('Cache miss', { key: 'user:42' });
logger.error('DB query failed', new Error('connection refused'));
Optional configuration:
import { configureLogger } from 'express-dev-panel';

configureLogger({
  level: 'http',                    // 'error' | 'warn' | 'info' | 'http' | 'debug'
  isDev: process.env.NODE_ENV !== 'production',
  files: {                          // optional plain-text file sinks
    errorPath: 'logs/error.log',
    combinedPath: 'logs/combined.log',
  },
});
Stray
console.log/console.info/console.warn/console.errorcalls are captured into the panel automatically (see thecaptureConsoleoption above). If you turned that off but still want to opt in manually:import { captureConsole } from 'express-dev-panel'; if (process.env.NODE_ENV !== 'production') captureConsole();
Option B - winston integration
If you already have a winston logger, plug in the bundled memory transport:
import winston from 'winston';
import { createMemoryTransport } from 'express-dev-panel';

export const logger = winston.createLogger({
  level: 'http',
  transports: [
    new winston.transports.Console(),
    createMemoryTransport(), // sends every log to the dev panel
  ],
});
Option C - manual push
import { pushLog } from 'express-dev-panel';

pushLog({
  level: 'info',
  message: 'Server started',
  timestamp: new Date().toISOString(),
});
Editor deep-links
Each route path and handler name is rendered as an anchor with data-loc-file/line/column. The panel exposes a small dropdown to pick the editor URI scheme the choice is persisted in localStorage. Clicking the link triggers your editor to open the file at the exact line.
License
MIT