npm package discovery and stats viewer.

Discover Tips

  • General search

    [free text search, go nuts!]

  • Package details

    pkg:[package-name]

  • User packages

    @[username]

Sponsor

Optimize Toolset

I’ve always been into building performant and accessible sites, but lately I’ve been taking it extremely seriously. So much so that I’ve been building a tool to help me optimize and monitor the sites that I build to make sure that I’m making an attempt to offer the best experience to those who visit them. If you’re into performant, accessible and SEO friendly sites, you might like it too! You can check it out at Optimize Toolset.

About

Hi, 👋, I’m Ryan Hefner  and I built this site for me, and you! The goal of this site was to provide an easy way for me to check the stats on my npm packages, both for prioritizing issues and updates, and to give me a little kick in the pants to keep up on stuff.

As I was building it, I realized that I was actually using the tool to build the tool, and figured I might as well put this out there and hopefully others will find it to be a fast and useful way to search and browse npm packages as I have.

If you’re interested in other things I’m working on, follow me on Twitter or check out the open source projects I’ve been publishing on GitHub.

I am also working on a Twitter bot for this site to tweet the most popular, newest, random packages from npm. Please follow that account now and it will start sending out packages soon–ish.

Open Software & Tools

This site wouldn’t be possible without the immense generosity and tireless efforts from the people who make contributions to the world and share their work via open source initiatives. Thank you 🙏

© 2024 – Pkg Stats / Ryan Hefner

flexmonster

v2.9.76-1

Published

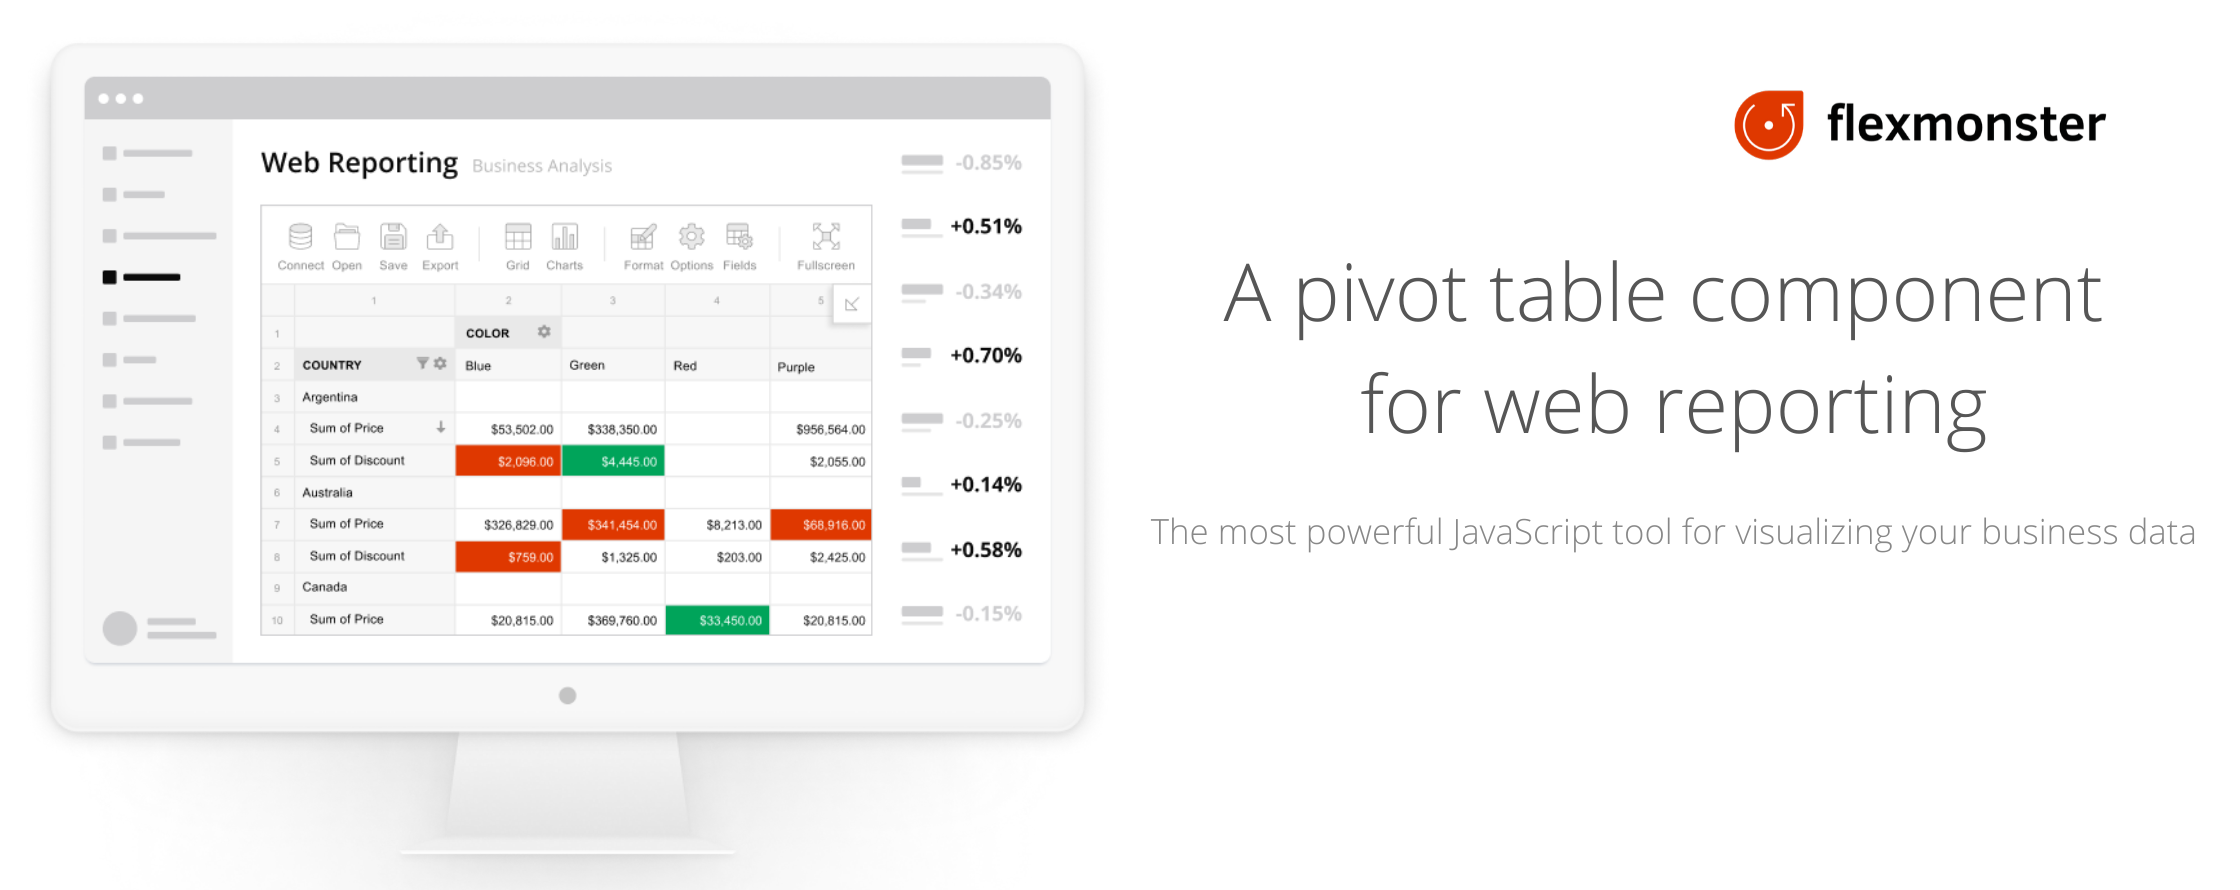
Pivot table component for web reporting. The most powerful JavaScript tool to visualize your business data.

Downloads

44,985

Readme

What is JS Pivot Table by Flexmonster?

Flexmonster Pivot Table & Charts is a component for interactive pivot reports that can be inserted to a web page or a web application. It’s a powerful JavaScript tool to visualize your business data.

Flexmonster Pivot is a cross-platform web component that seamlessly works on any browser (Chrome, Firefox, Internet Explorer, Safari or Opera) across Windows, macOS, Linux, iOS or Android.

Moreover, you have no limitation on server-side technology, no matter whether your website runs on .NET, Java, PHP, Ruby, etc.

Installation and usage

Start by installing Flexmonster as a node module and save it as a dependency in your package.json:

npm i flexmonster

Then, include the flexmonster.full.js and flexmonster.css files (for example, in the .html):

<link href="node_modules/flexmonster/flexmonster.css" rel="stylesheet"/>
<script src="node_modules/flexmonster/flexmonster.full.js" type="text/javascript"></script>

Now, you can create an instance of Pivot Table:

<div id="pivot-сontainer">The component will appear here</div>
<script>
	var pivot = new Flexmonster({
		container: "#pivot-сontainer",
		toolbar: true
	});
</script>

Refer to the Quick Start guide for more details.

Note: to use Flexmonster in production you need a license key. If you don’t have a license key, please visit www.flexmonster.com to obtain an appropriate license. Then, you can specify licenseKey in the configuration:

var pivot = new Flexmonster({
	licenseKey: "XXXX-XXXX-XXXX-XXXX-XXXX",
	container: "#pivot-сontainer",
	toolbar: true
});

Why use Flexmonster Pivot Table & Charts component?

Easy to integrate

Flexmonster Pivot can be natively used with JavaScript or TypeScript and perfectly integrates with the following client-side frameworks:

Supports the most common data sources

High speed in visualizing your data

This solution allows you to work extremely fast with really large data volumes (huge OLAP cubes, data sets from SQL DBs or files up to 140 MB).

Maximum data size is limited only by your end-users’ browsers and the capacity of their devices. The table renders multiple millions of cells immediately. If the user’s browser can handle it, we’ll display it.

Working with OLAP cubes, a browser component can communicate with the server via XMLA protocol or you can use Flexmonster Accelerator for OLAP cubes. It’s a special server-side proxy that helps you to increase data loading speed from server to customer’s browser tenfold.

Smart features to analyze and manage your data

Our pivot component provides Excel-like features which give users the interface they have always been used to. The users can easily and quickly analyze data and produce a report using different options such as:

  • Filtering
  • Sorting
  • Grouping fields in rows and columns
  • Drill-down
  • Drill-through
  • Calculated fields
  • Number formatting
  • Aggregations
  • Conditional formatting

You can find all list of the set of tools.

Customizable & flexible

Extensive API

Our component has convenient full-functional JavaScript API to embed the component into web applications. Being a developer, you can:

  • Define what features you want to enable/disable
  • Build your own scenarios around the component.

API Reference

Localizing component

Flexmonster Pivot can be easily localized: First of all, if you use one of the offered languages below, you can download the already prepared JSON files :

Set localization for Pivot Table

Compose report layout

Select which dimensions & values to show. Users can easily change a report’s layout visually and examine the data from a different perspective. The power of Pivot report composing allows you to stop guessing all possible report scenarios your end-users might require. The user will be able to tune it to their own needs on the fly.

Save & load reports

Users can create their own reports and save them to their local drive or the server and load previously saved reports with exactly the same layout, number formatting, filters, sorting and all the other settings.

This allows users to work with a predefined set of reports or create & save their own reports. Once the user has composed a report to reveal the precise data views that they need, they may want to save it for the future or share it with others.

Export & print

All table views (compact/classic/flat form) and charts view can be printed or exported. Users can export the reports into a variety of formats:

  • Microsoft Excel 7
  • PDF
  • Web page (HTML page)
  • CSV (comma separated text format)
  • Image (PNG)

You can control where to save the export data, the following methods are supported:

  • Save to local file
  • Save to server (to remote file-storage or database)

Resources

You can also get support from our Tech team by raising a ticket via Flexmonster Help Center.