
flowforge-cli
v1.3.1
Published
Turn one sentence into a staged AI engineering pipeline - specialised subagents, quality gates you approve, and a zero-dependency live dashboard.

Maintainers
 eng_mohammed_mustafa
Readme
FlowForge ⚙
Turn one rough sentence into a staged engineering pipeline — planned, analysed, implemented, tested, debugged and shipped by specialised AI subagents, with a live dashboard you actually control.






Website · Arabic README → · Install · Dashboard tour · Flow format · API
Install in one command
Windows (PowerShell):
iwr -useb https://raw.githubusercontent.com/Eng-MMustafa/FlowForge/main/get.mjs -o "$env:TEMP\ff.mjs"; node "$env:TEMP\ff.mjs"macOS / Linux:
curl -fsSL https://raw.githubusercontent.com/Eng-MMustafa/FlowForge/main/get.mjs -o /tmp/ff.mjs && node /tmp/ff.mjsThat is the whole setup. It downloads FlowForge, wires it into Devin if Devin is on the machine, and opens the dashboard. No npm install, no dependencies, no config file. Run the same command again any time to update.
Starting it again — no reinstall needed
The copy the command above installed already lives on your machine. To open the dashboard later, run the launcher inside it:
| Platform | Command |
|---|---|
| Windows | node "%LOCALAPPDATA%\FlowForge\start.mjs" |
| macOS | node "$HOME/Library/Application Support/FlowForge/start.mjs" |
| Linux | node ~/.local/share/FlowForge/start.mjs |
Or get a real flowforge (alias ff) command that works from any folder — once, not per run:
npm i -g flowforge-cli # or, inside a git clone: npm linkThis installs the latest published release. Then flowforge (or ff) starts the dashboard on whatever folder you are in — see The flowforge command.
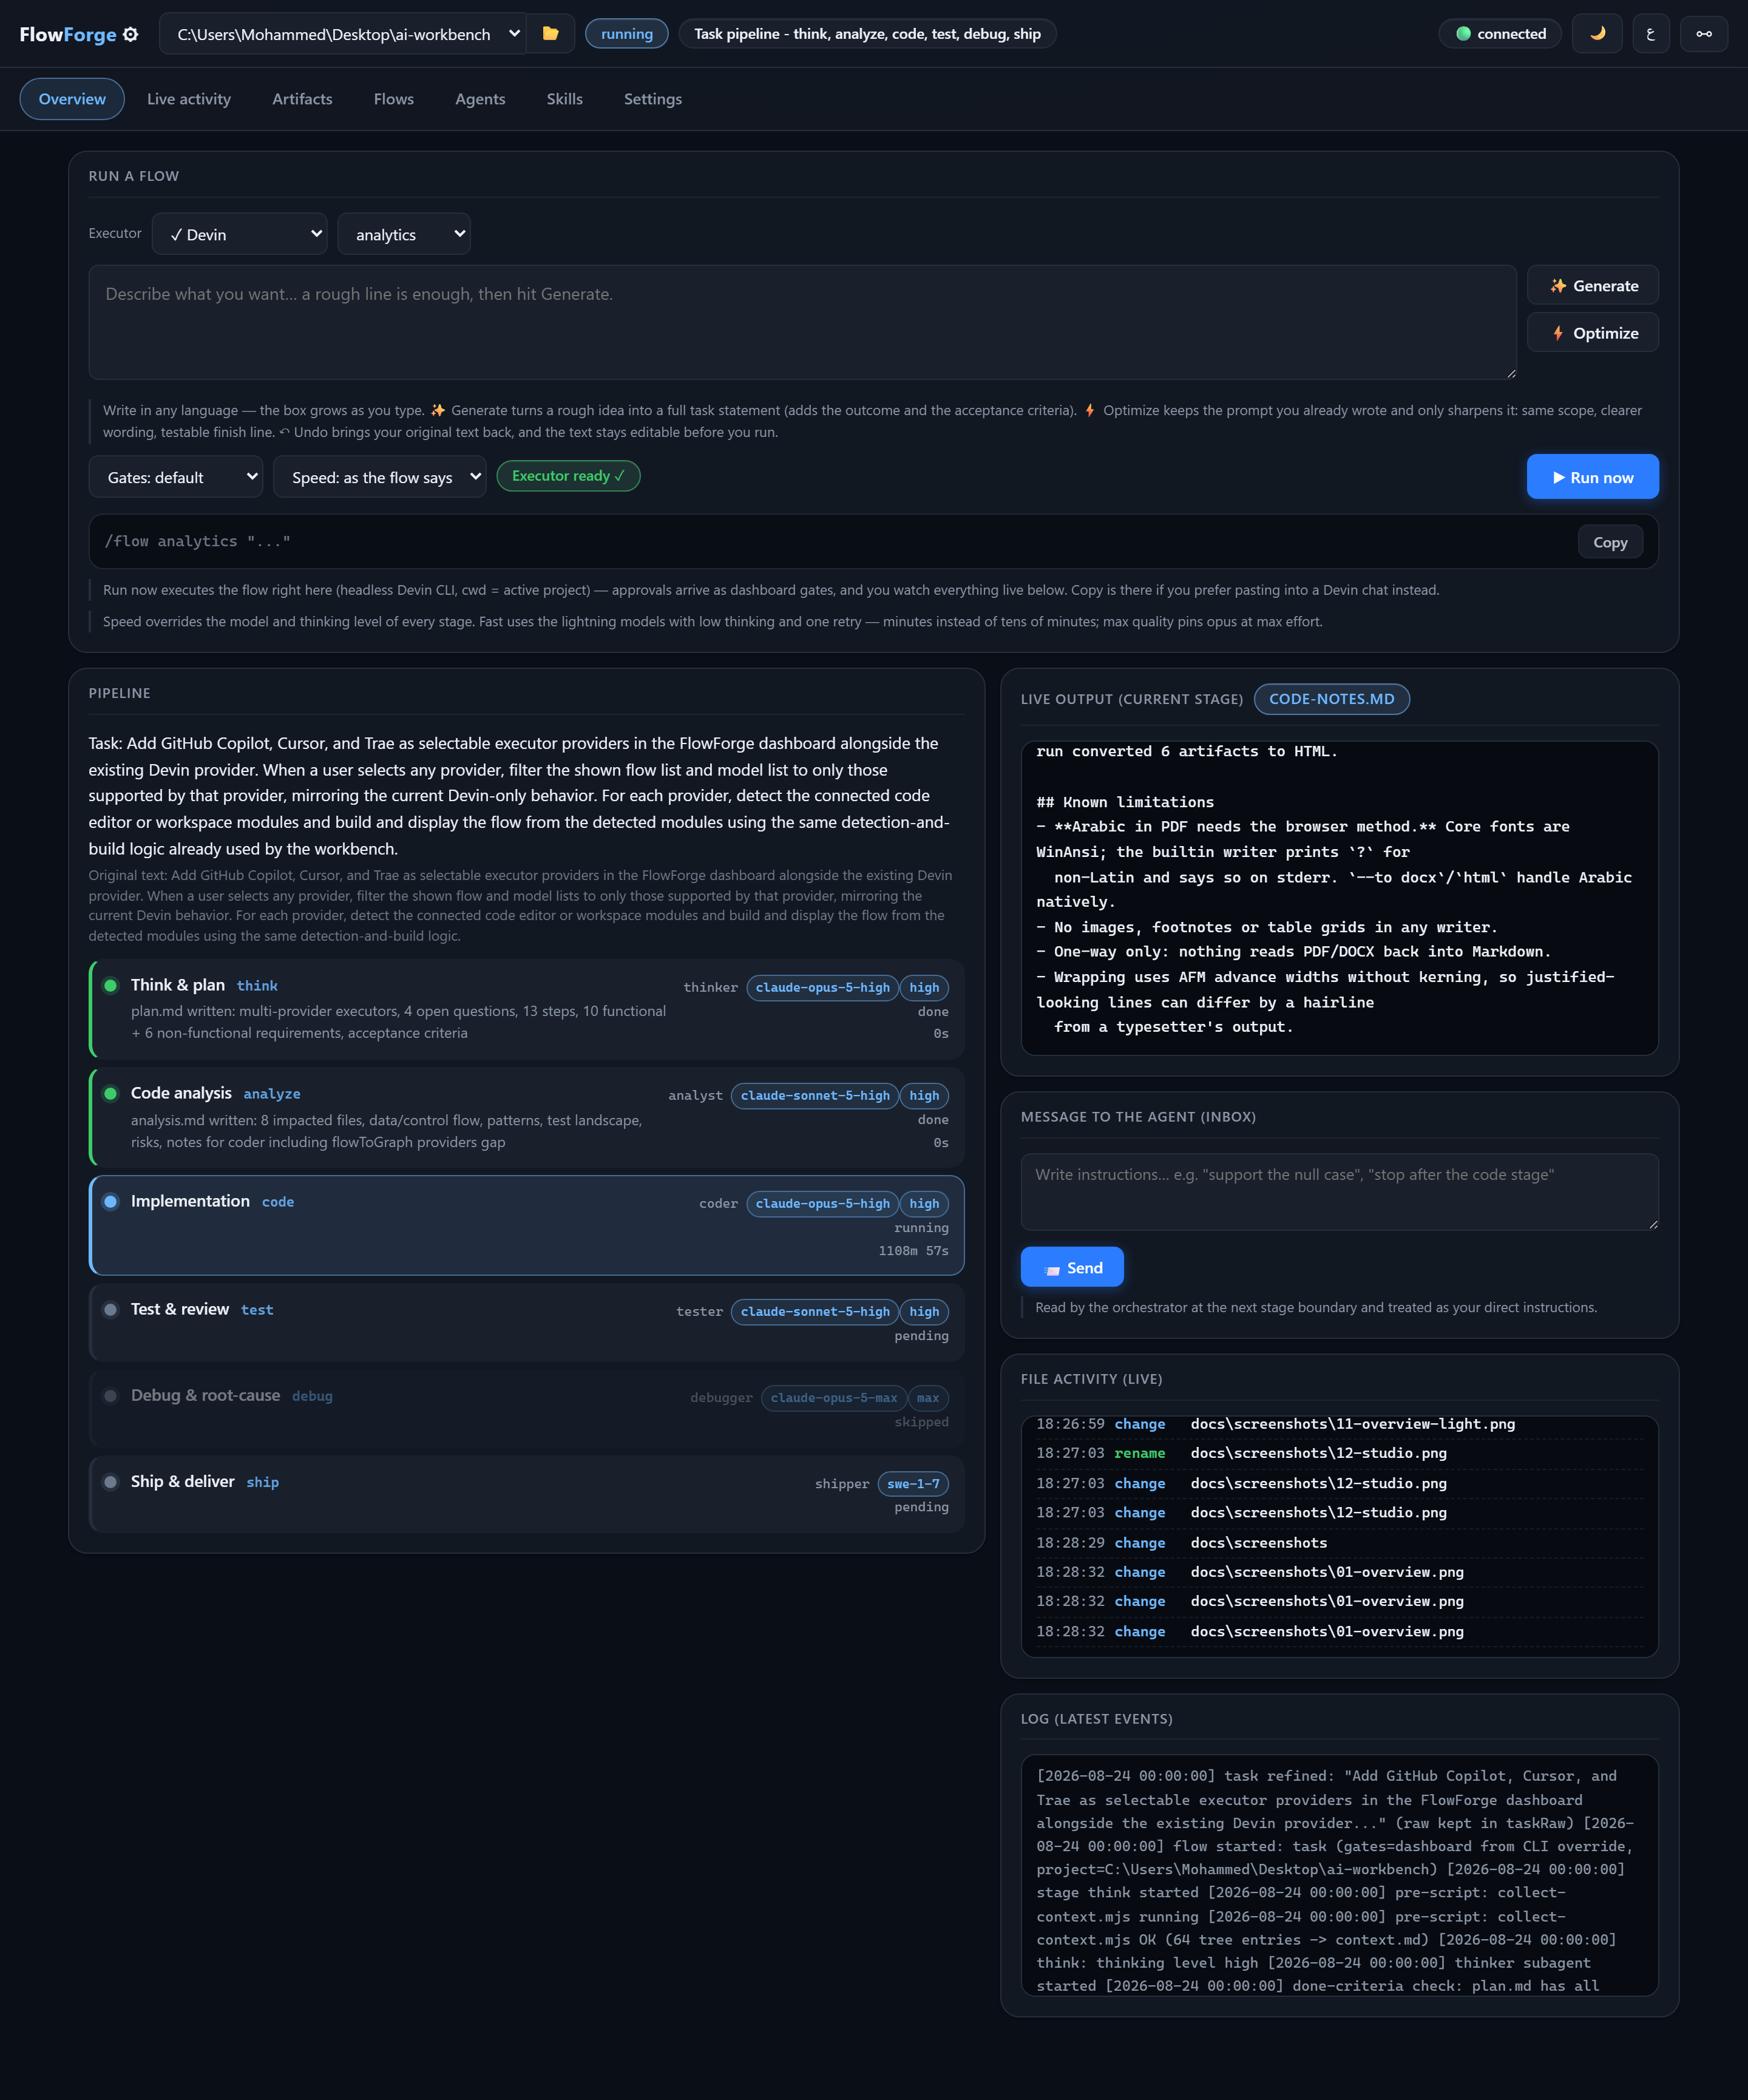
Table of contents
- Why FlowForge
- How it works
- Requirements
- Other ways to install
- The
flowforgecommand - Quick start
- The dashboard — a guided tour
- 1. Run bar & prompt generator
- 2. Pipeline view
- 3. Live activity
- 4. Artifacts & export
- 5. Visual flow editor
- 6. Agents
- 7. Skills
- 8. Executors — who does the work
- 9. Usage & cost
- 10. Gates — dashboard, AI review, resume
- 11. Runs — parallel projects, queue and schedules
- 12. Studio — the wordless builder
- 13. Themes and language
- Flow files — the schema
- Built-in flows
- Agent roles
- Skills (chat commands)
- Quality gates
- Document conversion library
- Scripts
- Configuration
- HTTP API
- Tests
- Project layout
- Design principles
- Troubleshooting
- License
Why FlowForge
Asking an AI coding agent to "fix the bug" gives you one long, unreviewable turn: it plans, edits and declares victory in a single breath, and you only find out what it actually did afterwards.
FlowForge splits that into stages with different specialists, and stops between them:
| Without FlowForge | With FlowForge |
|---|---|
| One agent, one prompt, one model | Six roles, each with its own contract, model and thinking level |
| You review the diff at the end | You approve at every gate, before the next stage starts |
| "It works" is the agent's opinion | A dedicated tester must emit VERDICT: PASS — a FAIL jumps back to a debugger |
| Reasoning disappears into chat | Every stage writes a markdown artifact you can read, export and keep |
| A run is a black box | A live dashboard shows the stage, model, output tail, file changes and log |
Nothing here is a wrapper around a hosted service: it is a folder of markdown role contracts, JSON flow definitions and Node scripts, plus a single-file HTTP dashboard.
How it works
  /flow task "add rate limiting to the API"
             │
             ▼
   ┌───────────────────┐   refines the sentence into a precise task statement
   │   orchestrator    │   reads flows/task.json and runs the stages in order
   └───────────────────┘
             │
   ┌─────────┴──────────────────────────────────────────────────────┐
   ▼            ▼            ▼            ▼            ▼            ▼
 thinker  →  analyst   →   coder    →   tester   →  debugger  →  shipper
 plan.md    analysis.md  code-notes.md  review.md   debug.md    ship.md
   │            │            │            │  │         │
   └── gate ────┴── gate ────┴── gate ────┘  └─ FAIL ──┘ (loops back, max N)
        │                                        PASS ──────────► ship
        ▼
approve / reject ← terminal prompt, dashboard button, or auto- Stages are defined in a JSON flow file — order, agent, model, prompt, artifact, gate and failure jump are all data, not code.
- Subagents are markdown role contracts in
agents/. Each one only writes its own artifact and stays in its lane. - Gates pause the run and wait for you (terminal or dashboard) or pass automatically, per stage.
- Artifacts land in
<project>/.workbench/artifacts/and are rendered live in the dashboard. - State lives in
<project>/.workbench/state.json, which the dashboard polls — so the UI never has to be in the same process as the run.
Requirements
| | |
|---|---|
| OS | Windows, macOS or Linux — see platform support |
| Node.js | 18 or newer (20+ recommended; the screenshot tooling uses Node 22 features) |
| Executor | Devin CLI — the only executor that can run a flow today |
| Optional | GitHub CLI (gh) for Copilot account detection; any of the 15 supported AI tools — Cursor, Trae, Windsurf, Claude Code, Codex, Gemini, Zed, Kiro, Antigravity, Aider, OpenCode, Augment, Cline/Roo, Continue — for module detection |
| Dependencies | None. The package.json exists only to expose the CLI — it declares no dependencies and there is no lockfile |
Platform support
Every OS difference lives in one file, scripts/lib/platform.mjs, and each function there is checked against all three platforms by the test suite — from whichever machine runs it.
| | Windows | macOS | Linux |
|---|---|---|---|
| Dashboard, flows, gates, export | yes | yes | yes |
| Agent config | %APPDATA%\devin | ~/Library/Application Support/devin | ~/.config/devin |
| Skill/agent wiring | directory junctions | symlinks | symlinks |
| Editor detection | %LOCALAPPDATA%\Programs | /Applications/*.app | PATH + ~/.config |
| Sign-in terminal | cmd /c start | Terminal.app | first installed of gnome-terminal, konsole, xterm, … |
Set DEVIN_CONFIG_DIR if your agent keeps its config somewhere else — it wins even if the folder does not exist yet, so a typo is visible instead of silently resolving elsewhere. On Linux with no terminal emulator installed, the sign-in endpoint returns the script path for you to run yourself rather than claiming a window opened.
It also runs where things are not ideal:
- No agent installed? The dashboard still starts — flows, the editor, artifacts and export all work; only the chat skills need the wiring.
- Port already taken? One clear message and exit, no restart storm.
flowforge --port=4830. - Install folder owned by root (
sudo npm i -g)? State moves to your own directory instead of failing to write next to the code. - Spaces or non-Latin characters in the project path? Fine — covered by a test.
Honest caveat: the author develops on Windows, so that is the most heavily exercised path. macOS and Linux are covered by the platform tests and by careful path work — if something is off on your machine, please open an issue.
Other ways to install
Run it without installing anything — npx fetches the package and starts the dashboard on the folder you are in:
npx flowforge-cliStraight from GitHub, if you want the newest commit rather than the last release:
npx github:Eng-MMustafa/FlowForgeFrom source, if you want to hack on it:
git clone https://github.com/Eng-MMustafa/FlowForge.git
cd FlowForge
node install.mjs
node start.mjs
What the installer actually does (no admin rights, nothing outside these three):
- Writes a locator at
%APPDATA%\devin\flowforge.jsonpointing at your copy, so it can live anywhere. - Creates directory junctions
%APPDATA%\devin\skills→skills/and%APPDATA%\devin\agents→agents/, so edits apply live with no reinstall. - Strips any machine-specific absolute path an older copy may have baked into a skill file.
Start a new agent session afterwards so the skills are picked up. To undo it all (junctions and locator only — your projects are never touched):
node uninstall.mjsThe flowforge command
Installed globally, the CLI works from any folder — the folder you are standing in becomes the project:
npm i -g flowforge-cli| Command | Does |
|---|---|
| flowforge | Starts the dashboard on the current folder |
| flowforge C:\path\to\project | Starts it on that project (relative paths are read from your current folder) |
| flowforge install / uninstall | Wires (or unwires) the skills and agents |
| flowforge status (or check) | Prints the install state as JSON, same as --check |
| flowforge test | Runs the test suite |
| flowforge where | Prints the install folder |
| flowforge version (or -v) | Prints the installed version |
| flowforge --port=5000 --no-open | Flags are passed through to the dashboard (-p 5000 works too) |
| flowforge help | One-screen list of all of the above |
ff is a shorter alias for the same command.
Quick start
From the chat, using a skill:
/flow task "add rate limiting to the public API"
/flow bugfix "uploads over 5MB fail silently"
/flow review "changes on this branch vs main"
/flow security "the public upload API"
/flow data "which plan churns most in data/churn.csv?"
/understand                       ← learn the project and draft its rules
/flow-status                      ← read-only report of the current run
/flow-resume                      ← continue an interrupted pipeline
From the dashboard:
flowforge                                        # opens http://127.0.0.1:4820
flowforge "C:\path\to\your\project"              # start on a specific project
flowforge --port=5000 --no-open                  # custom port, no browser
flowforge --check                                # health check and exit
flowforge status                                 # the same, as a command
(From a source checkout the same flags work with node start.mjs.)
Pick a flow, type what you want in any language, press Run now.
The dashboard — a guided tour
Every screenshot below is the real UI, captured from a running instance.
1. Run bar & prompt generator
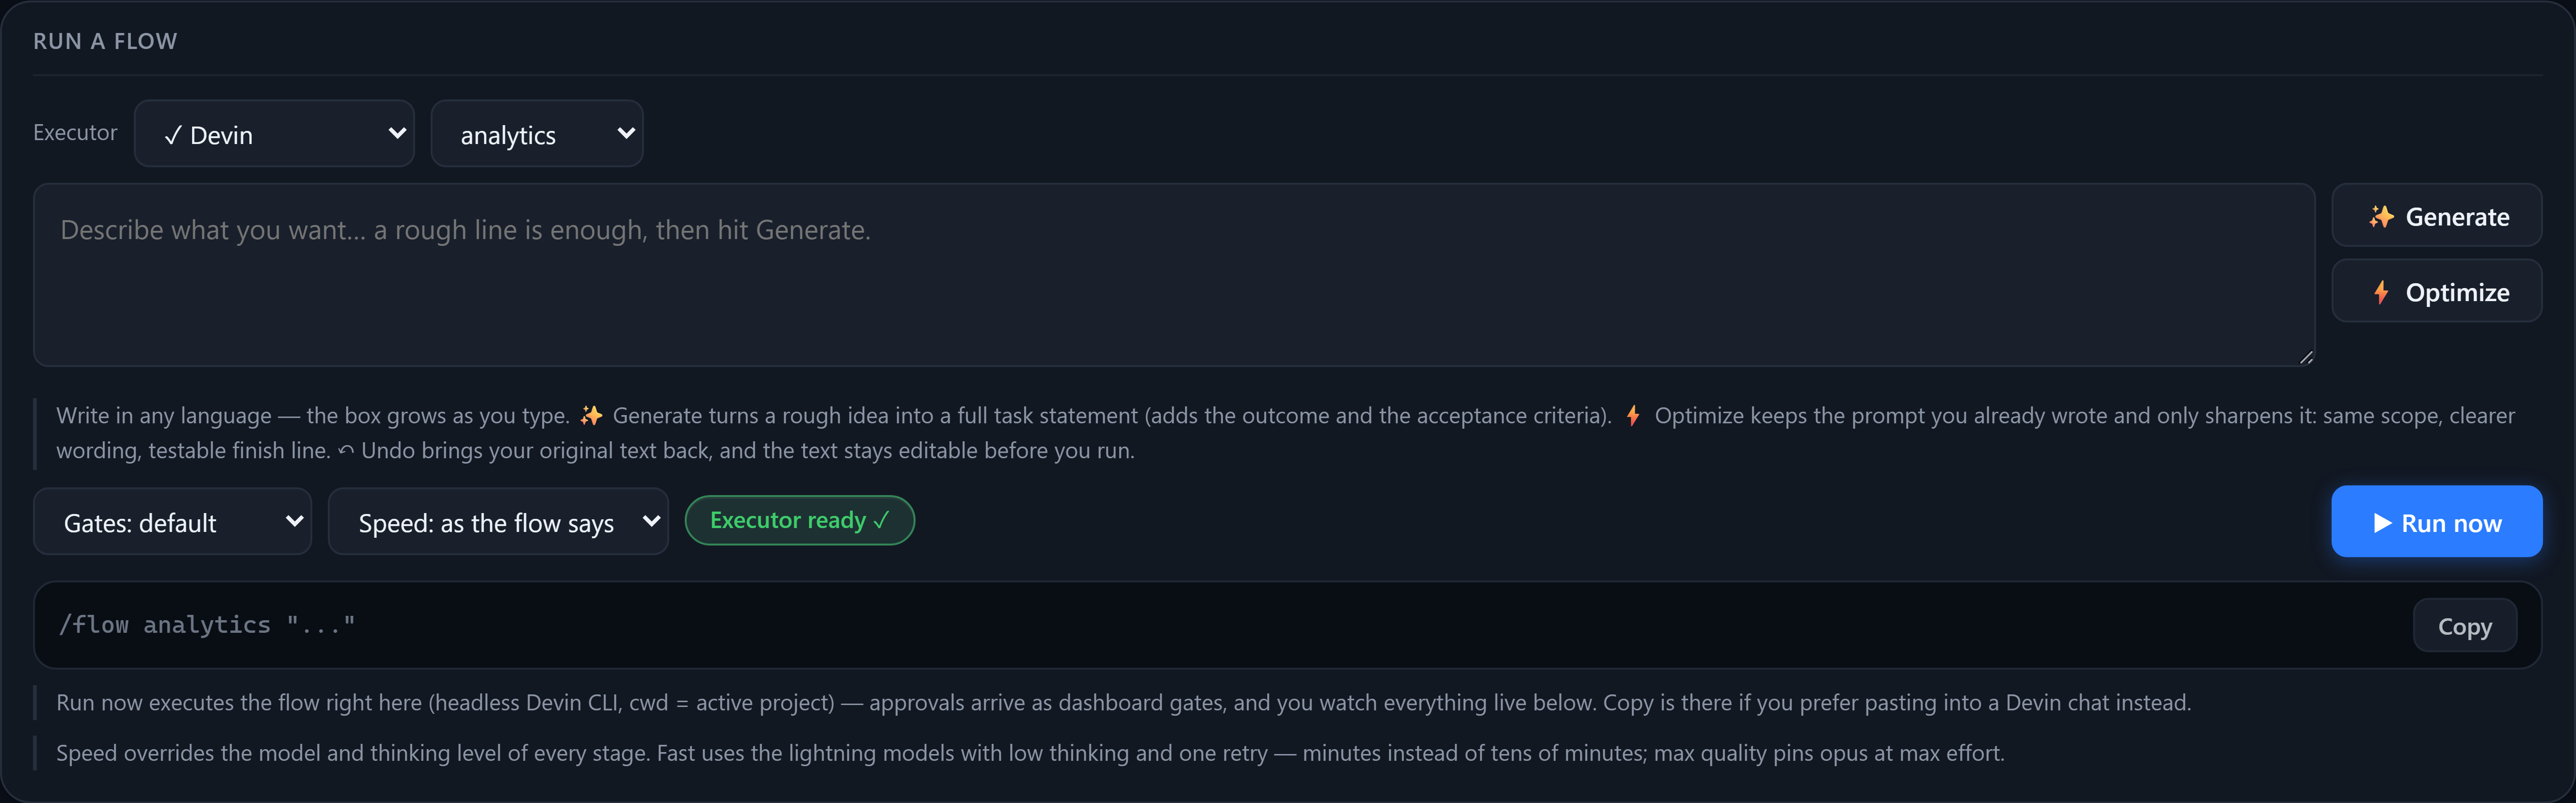
The composer is deliberately one screen: who executes, which flow, what you want, and how it should behave.
- Executor — Devin, Copilot, Cursor, Trae, Windsurf, Claude Code, Codex, Gemini, Zed, Kiro, Antigravity, Aider, OpenCode, Augment, Cline/Roo or Continue (16 tools). Switching filters the flow list, the model catalogue and the module detection. Only Devin can execute.
- Task box — an auto-growing textarea. Write in any language; Arabic is fine.
- ✨ Generate turns a rough line into a full English task statement (adds the outcome and acceptance criteria).
- ⚡ Optimize sharpens a prompt you already wrote without inventing scope. Both keep an Undo of your original text.
- Gates — override the flow's gate mode for this run: default / terminal / dashboard / auto.
- Speed —
fast(lightning models, minimal thinking) →quality(max thinking on every stage), overriding the pinned models for one run. - The grey line underneath is the exact CLI command, ready to copy if you would rather paste it into a chat.
The prompt generator tries your existing Devin login first, then any OpenAI-compatible endpoint you configure (Groq, OpenRouter, Gemini, local Ollama), then an offline template — so it still works with no key at all.
2. Pipeline view
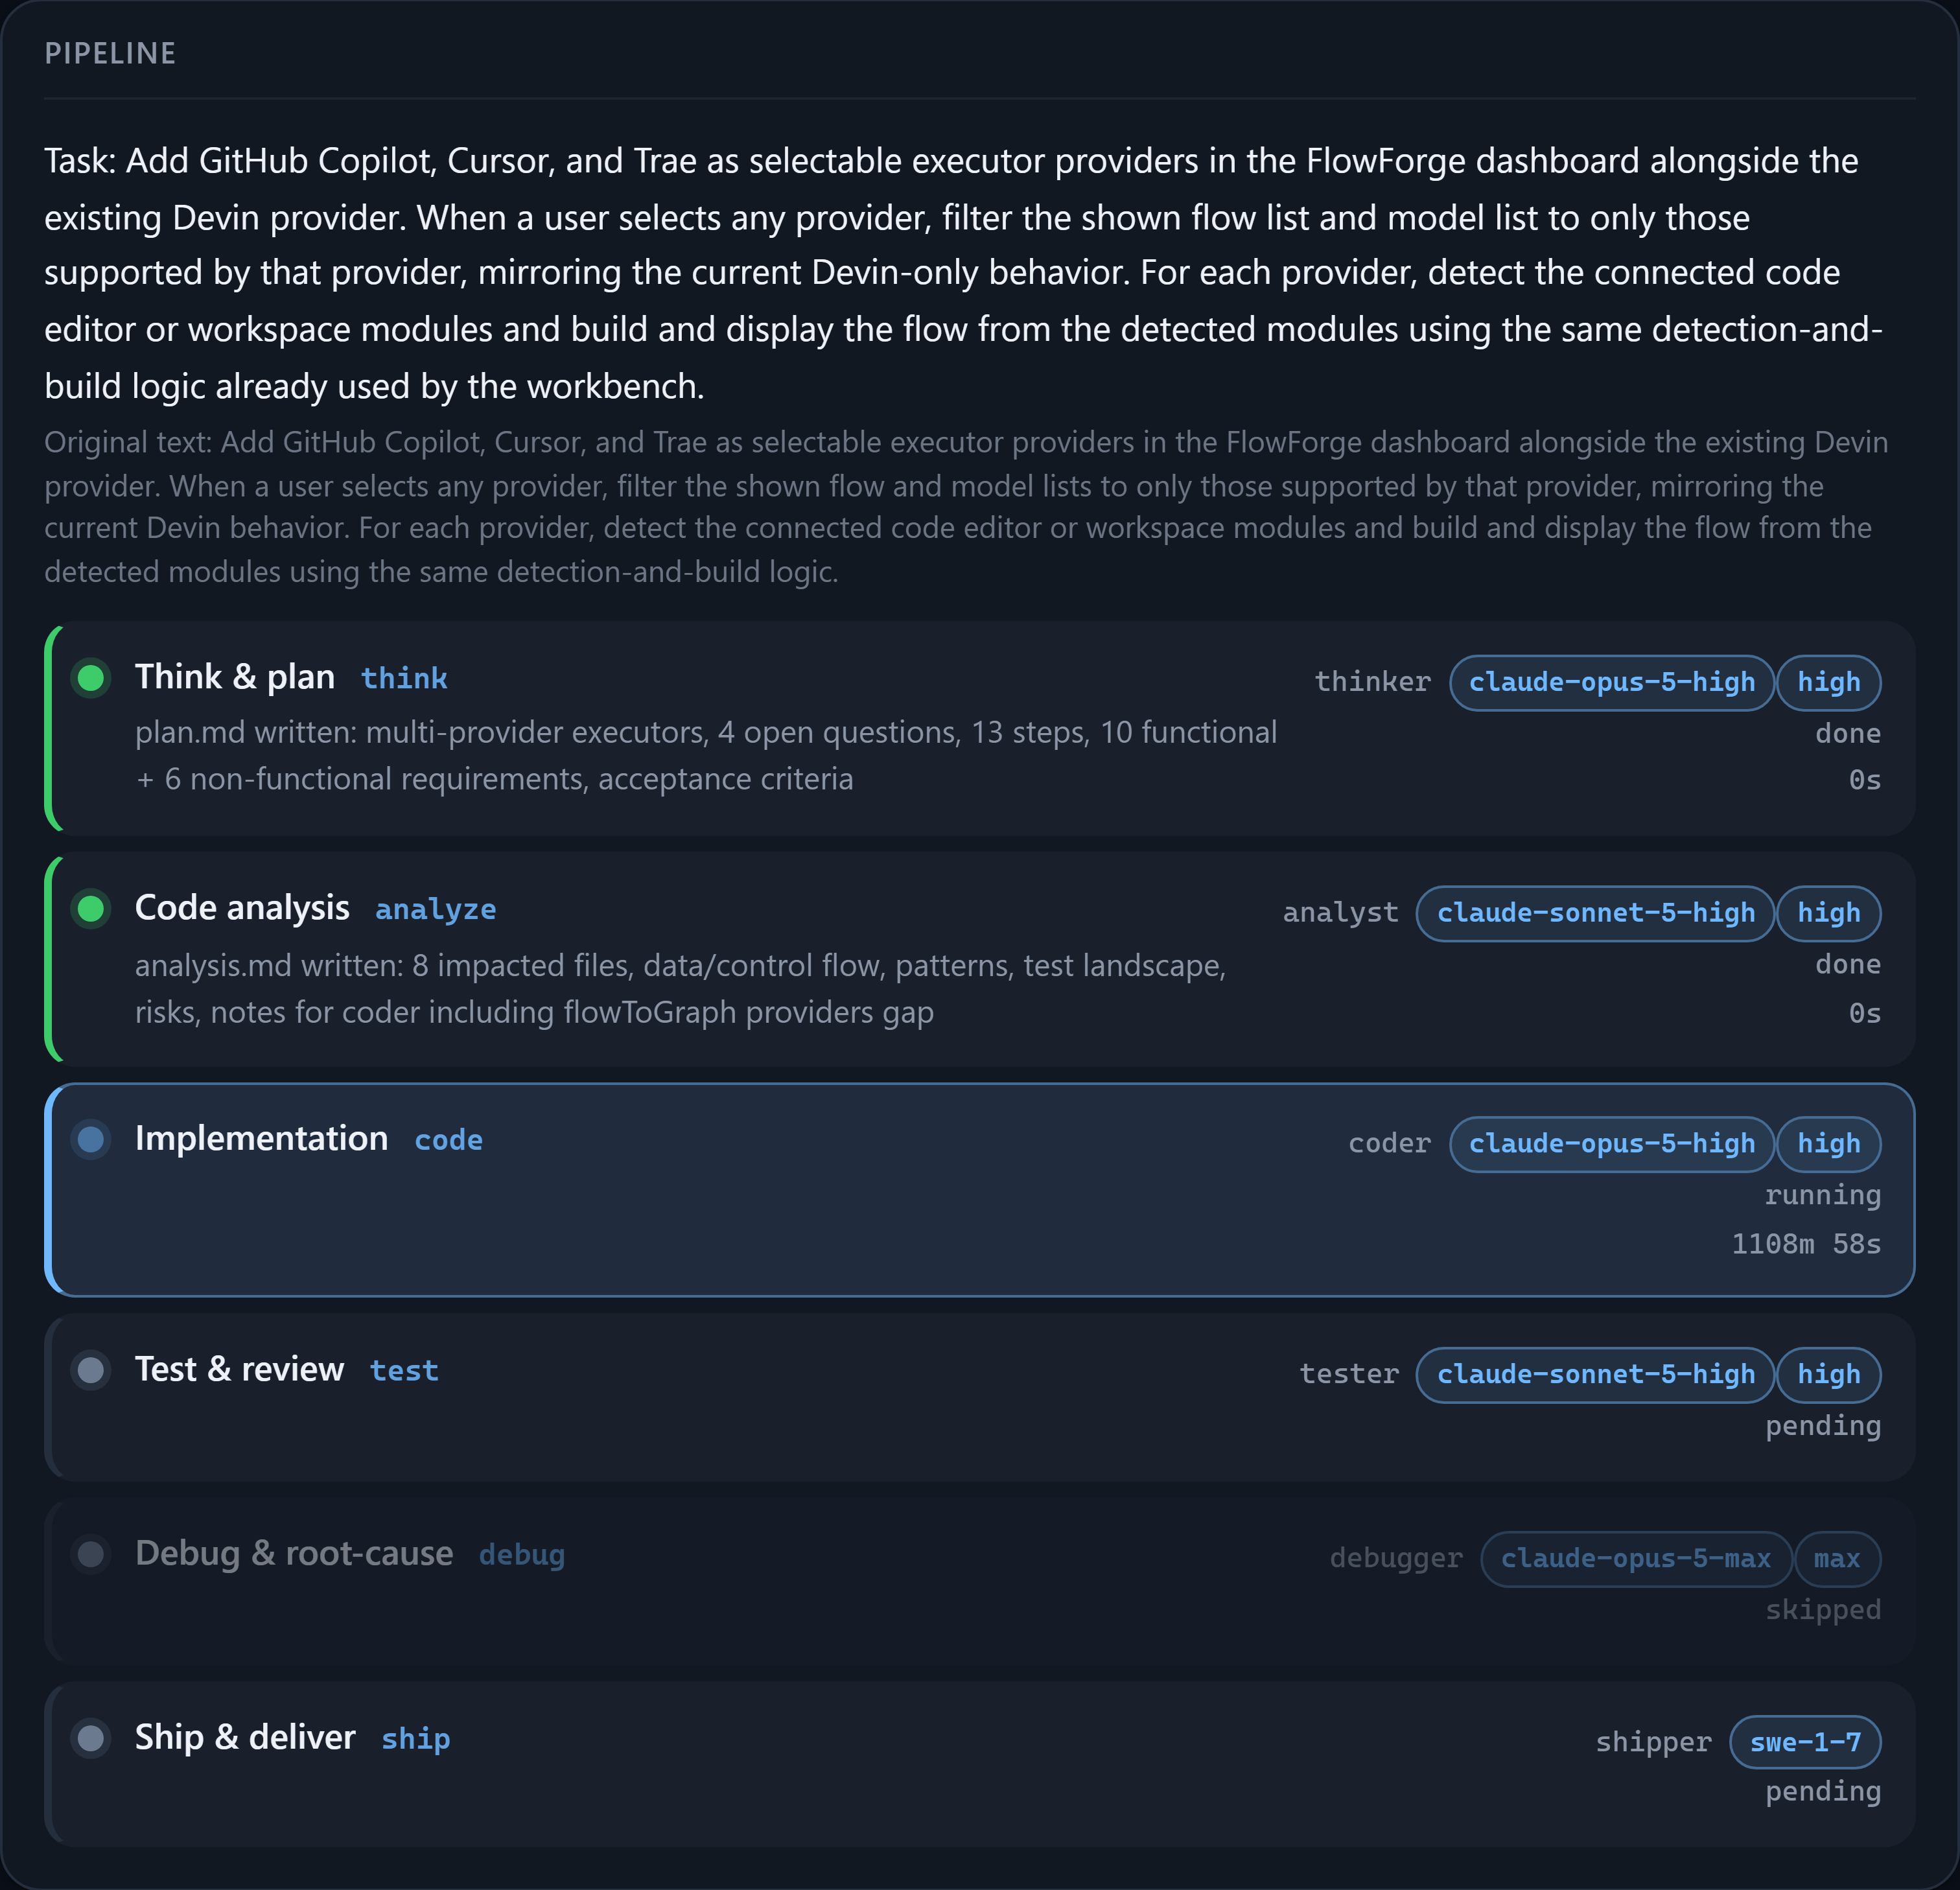
The live spine of a run: refined task on top (with the raw text you typed underneath), then one row per stage showing the role, the pinned model and thinking level, the status colour, a per-stage note and the retry counter. Beside it sits the tail of the artifact currently being written, an inbox to send the agent a mid-run instruction, the file-change feed and the log.
3. Live activity
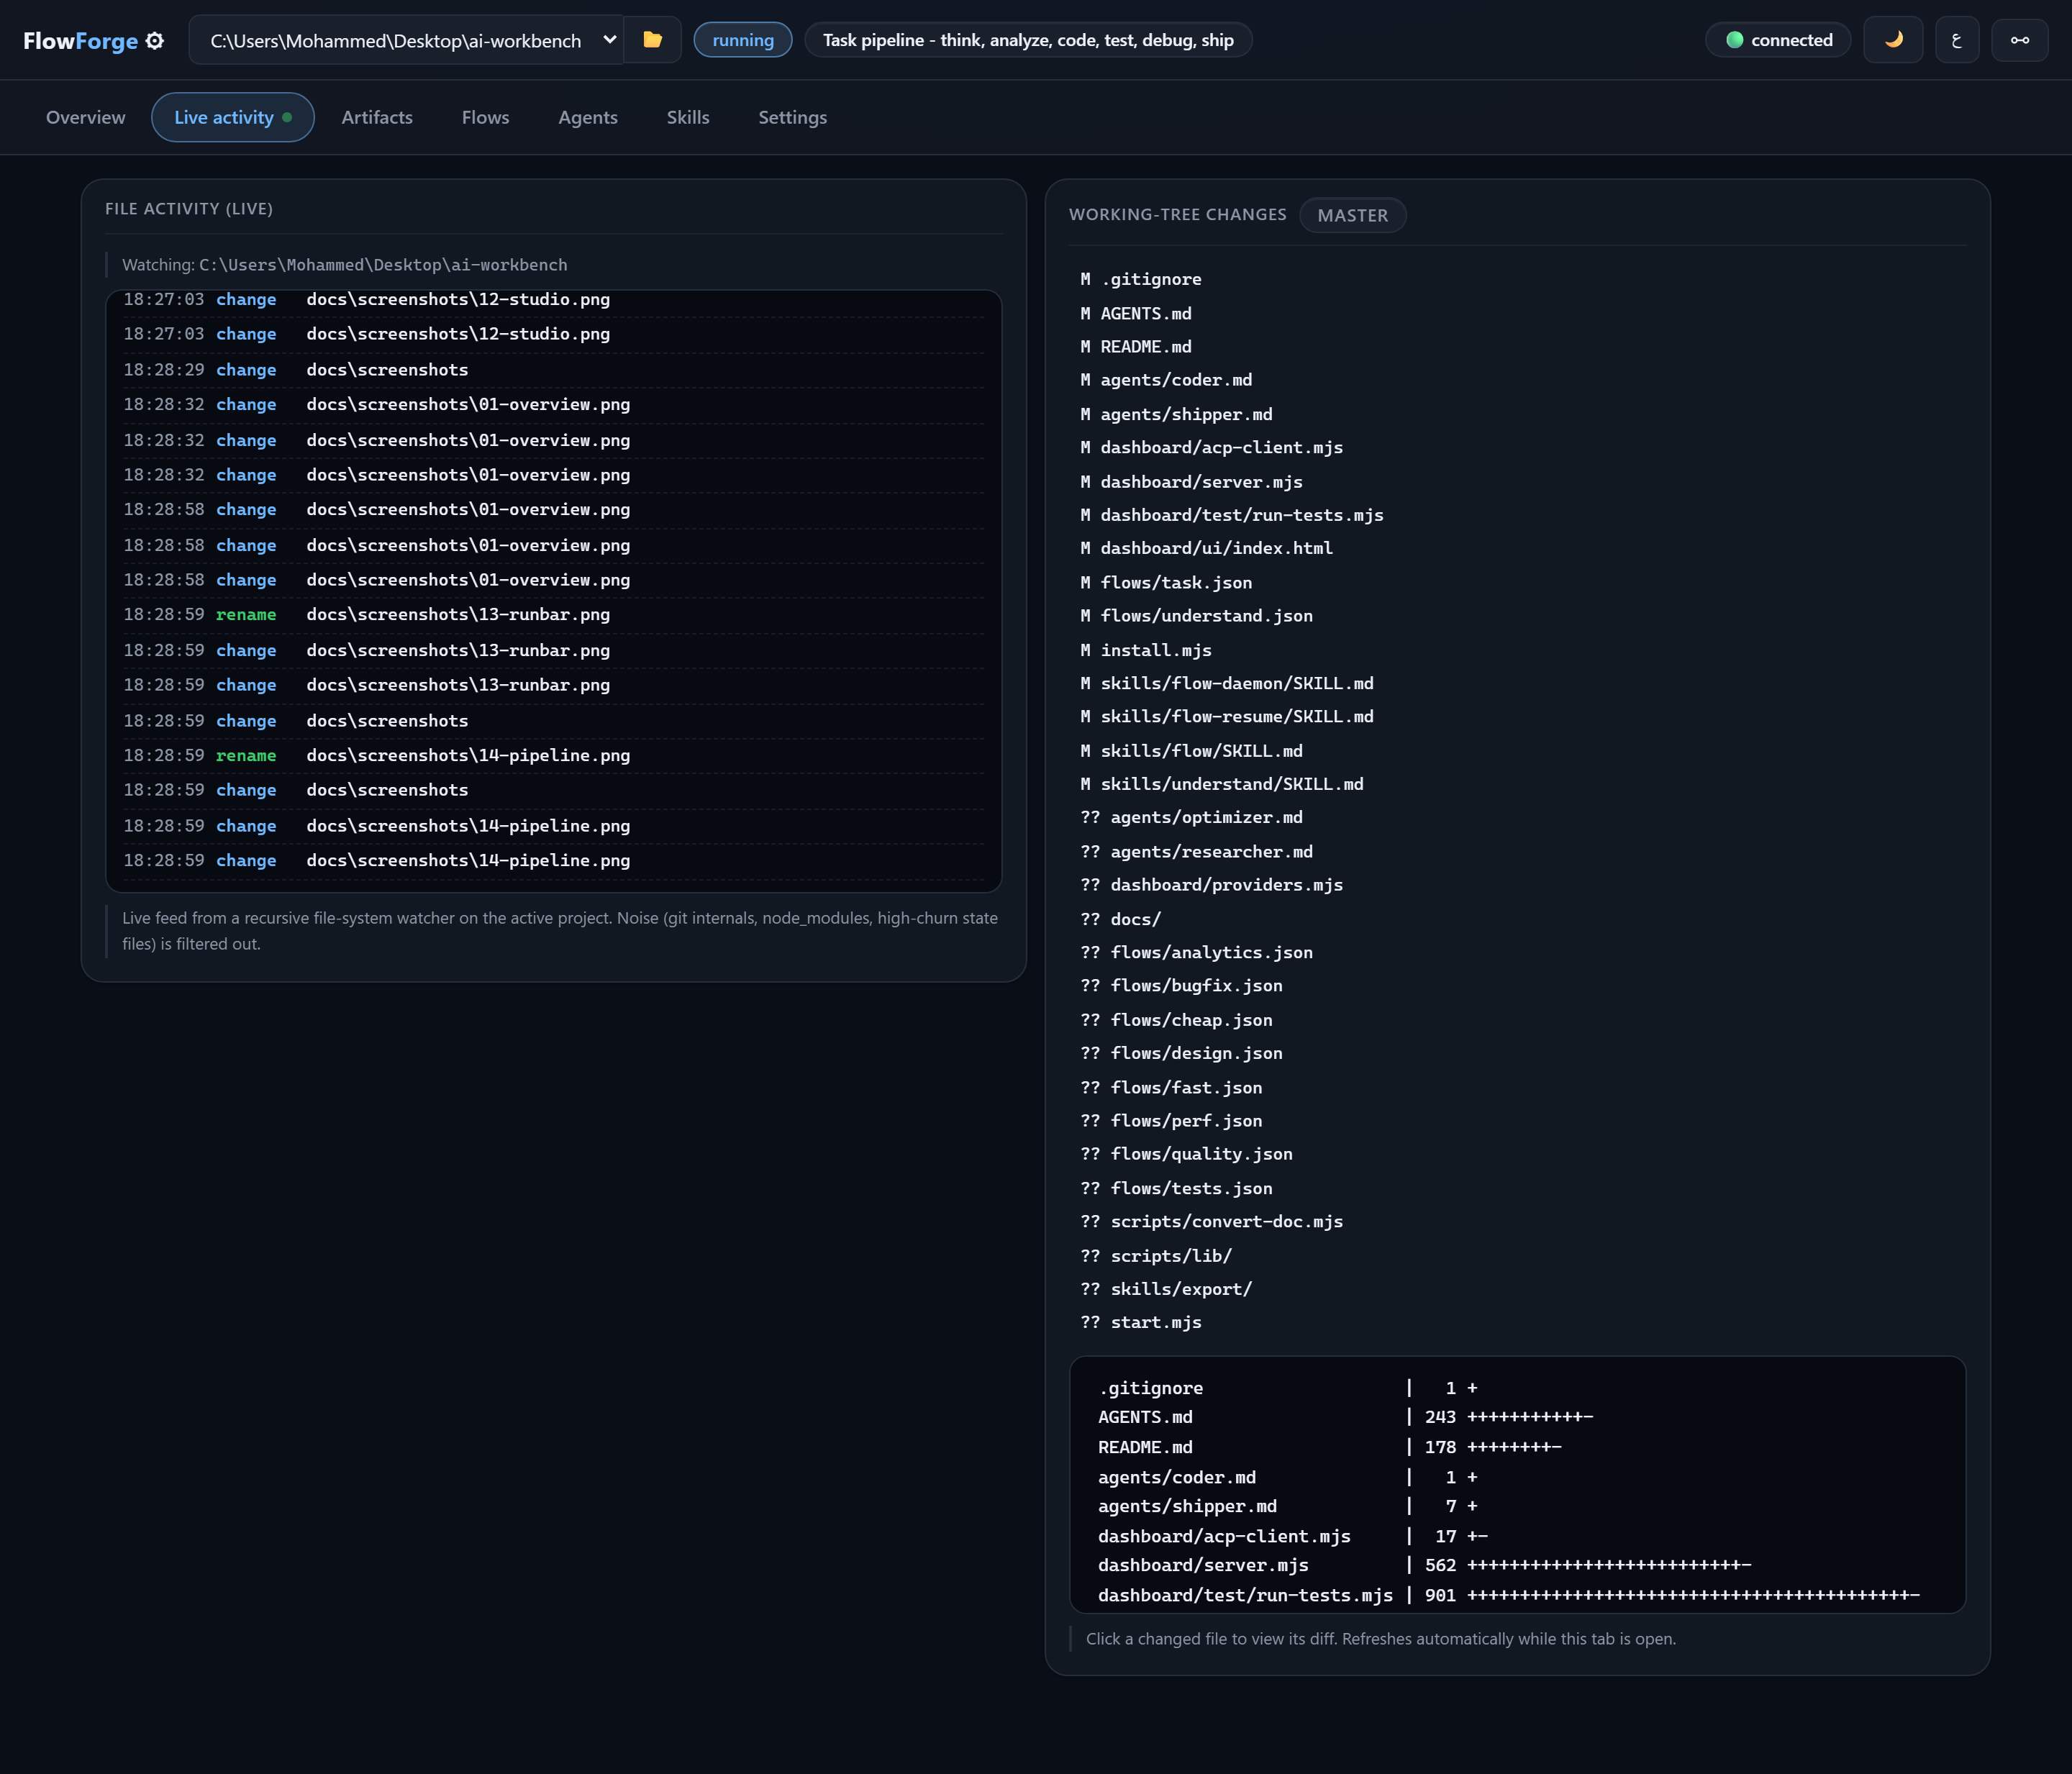
A filesystem watcher on the active project (build noise excluded), plus real Git state: current branch, changed files, the diffstat, and a click-to-open unified diff — so you can watch exactly what the agent is touching while it works.
4. Artifacts & export
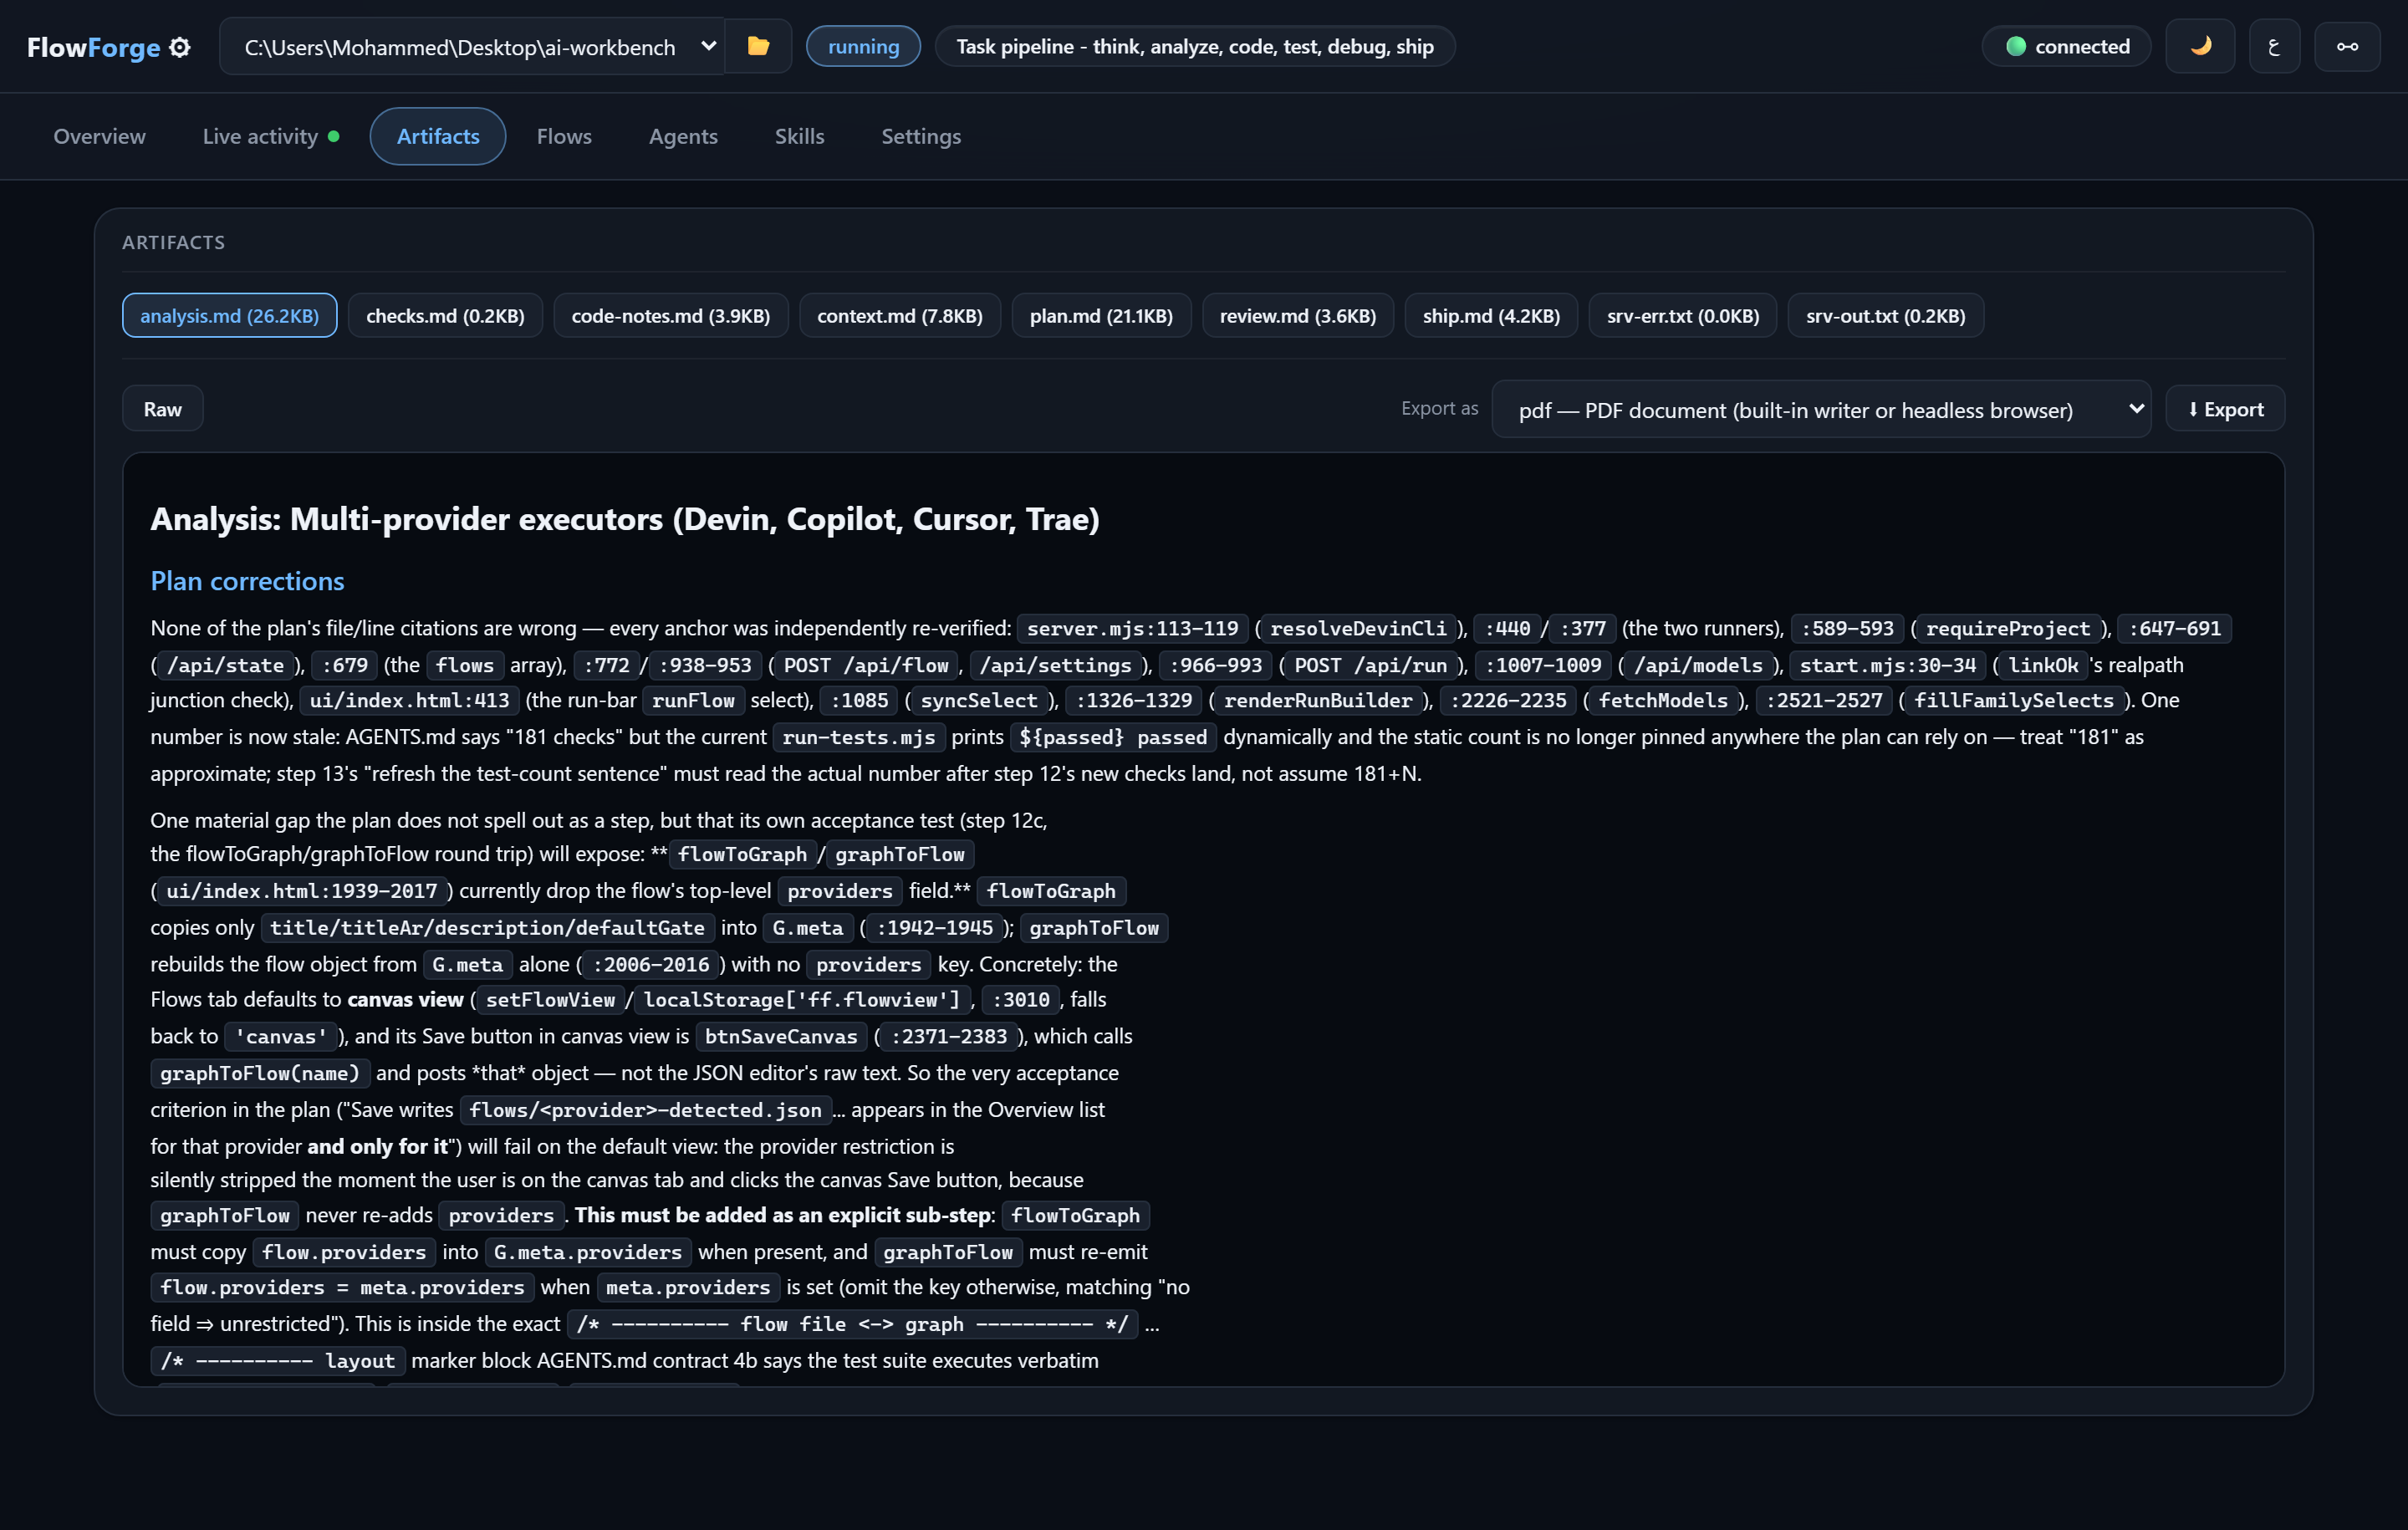
Every stage output rendered as markdown, with VERDICT: PASS/FAIL lines and checkboxes styled as badges, and a raw toggle. The Export as control converts any artifact into PDF, Word, Excel, CSV, HTML, TXT, Markdown or JSON and writes it to <project>/.workbench/exports/ — using the project's own converter, with no external library.
5. Visual flow editor
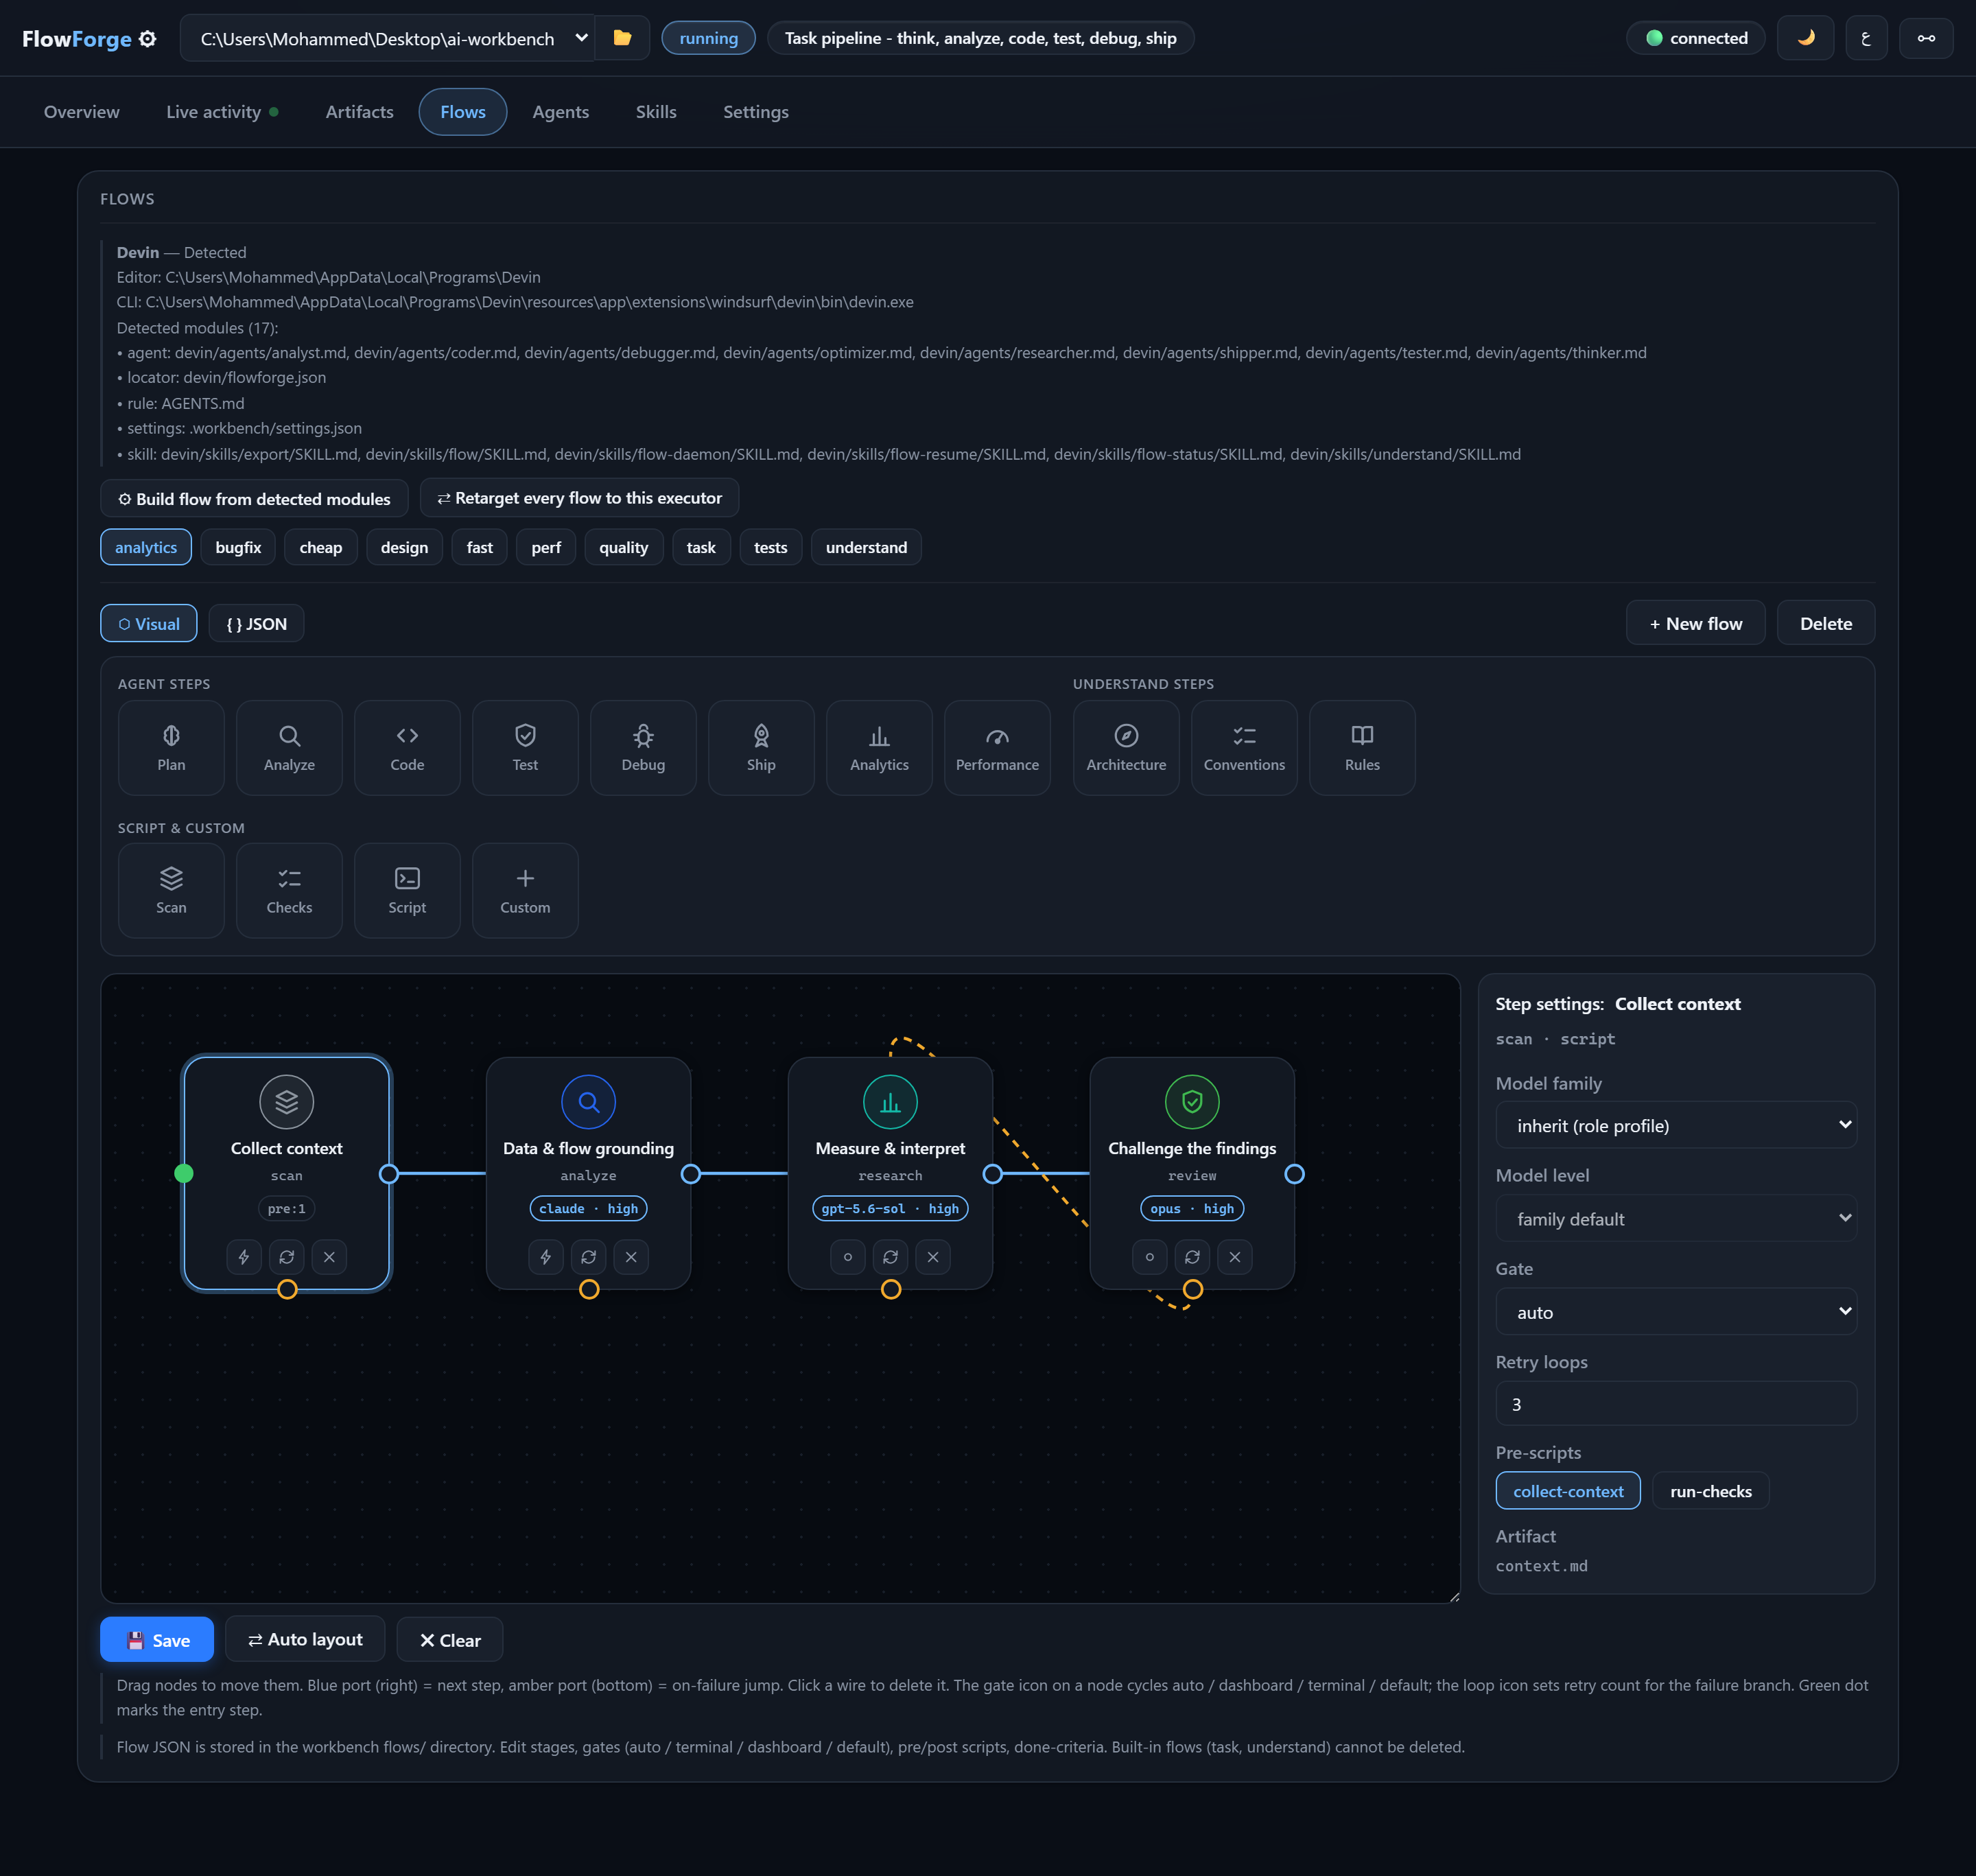
A flow is a JSON file, but you never have to write one. Drag labelled icon nodes onto a canvas and wire them:

- Agent steps — the six roles, plus analytics, performance and security specialists.
- Understand steps — architecture, conventions and rules extraction.
- Script & custom —
scan,checksandscriptnodes have no agent at all: their pre-scripts are the work.
Wiring rules: the blue port on the right is the next stage; the amber port at the bottom is the on-failure jump (with its own retry count); clicking a wire deletes it; the gate button on a node cycles auto → dashboard → terminal → default; the green dot marks the entry step.
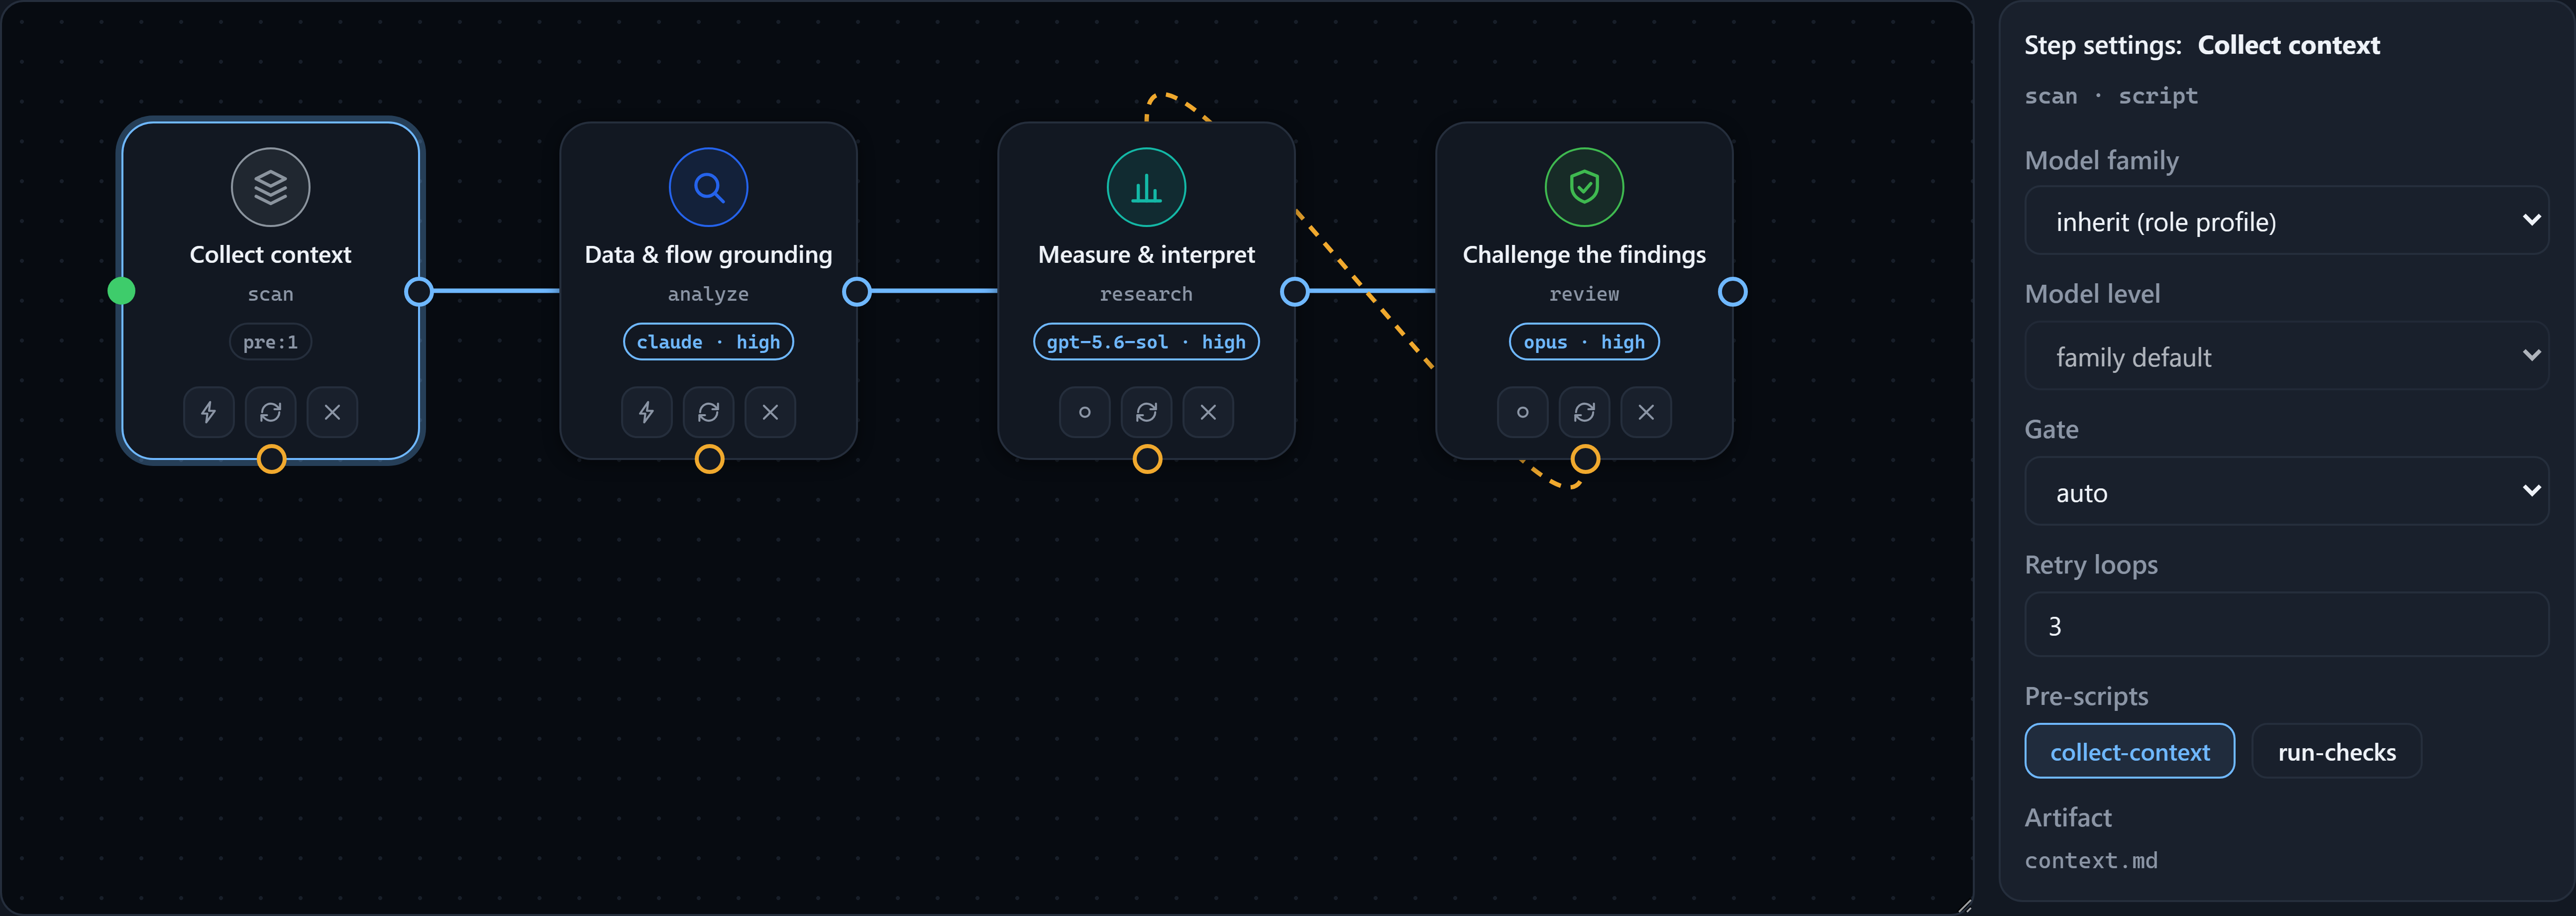
Selecting a node opens the step inspector — labelled dropdowns only, no free typing: model family, thinking level, gate mode, retry loops, pre-script toggles and the artifact name. The same overrides appear as chips on the node itself. Node positions round-trip through the flow file and are ignored by the orchestrator.
6. Agents
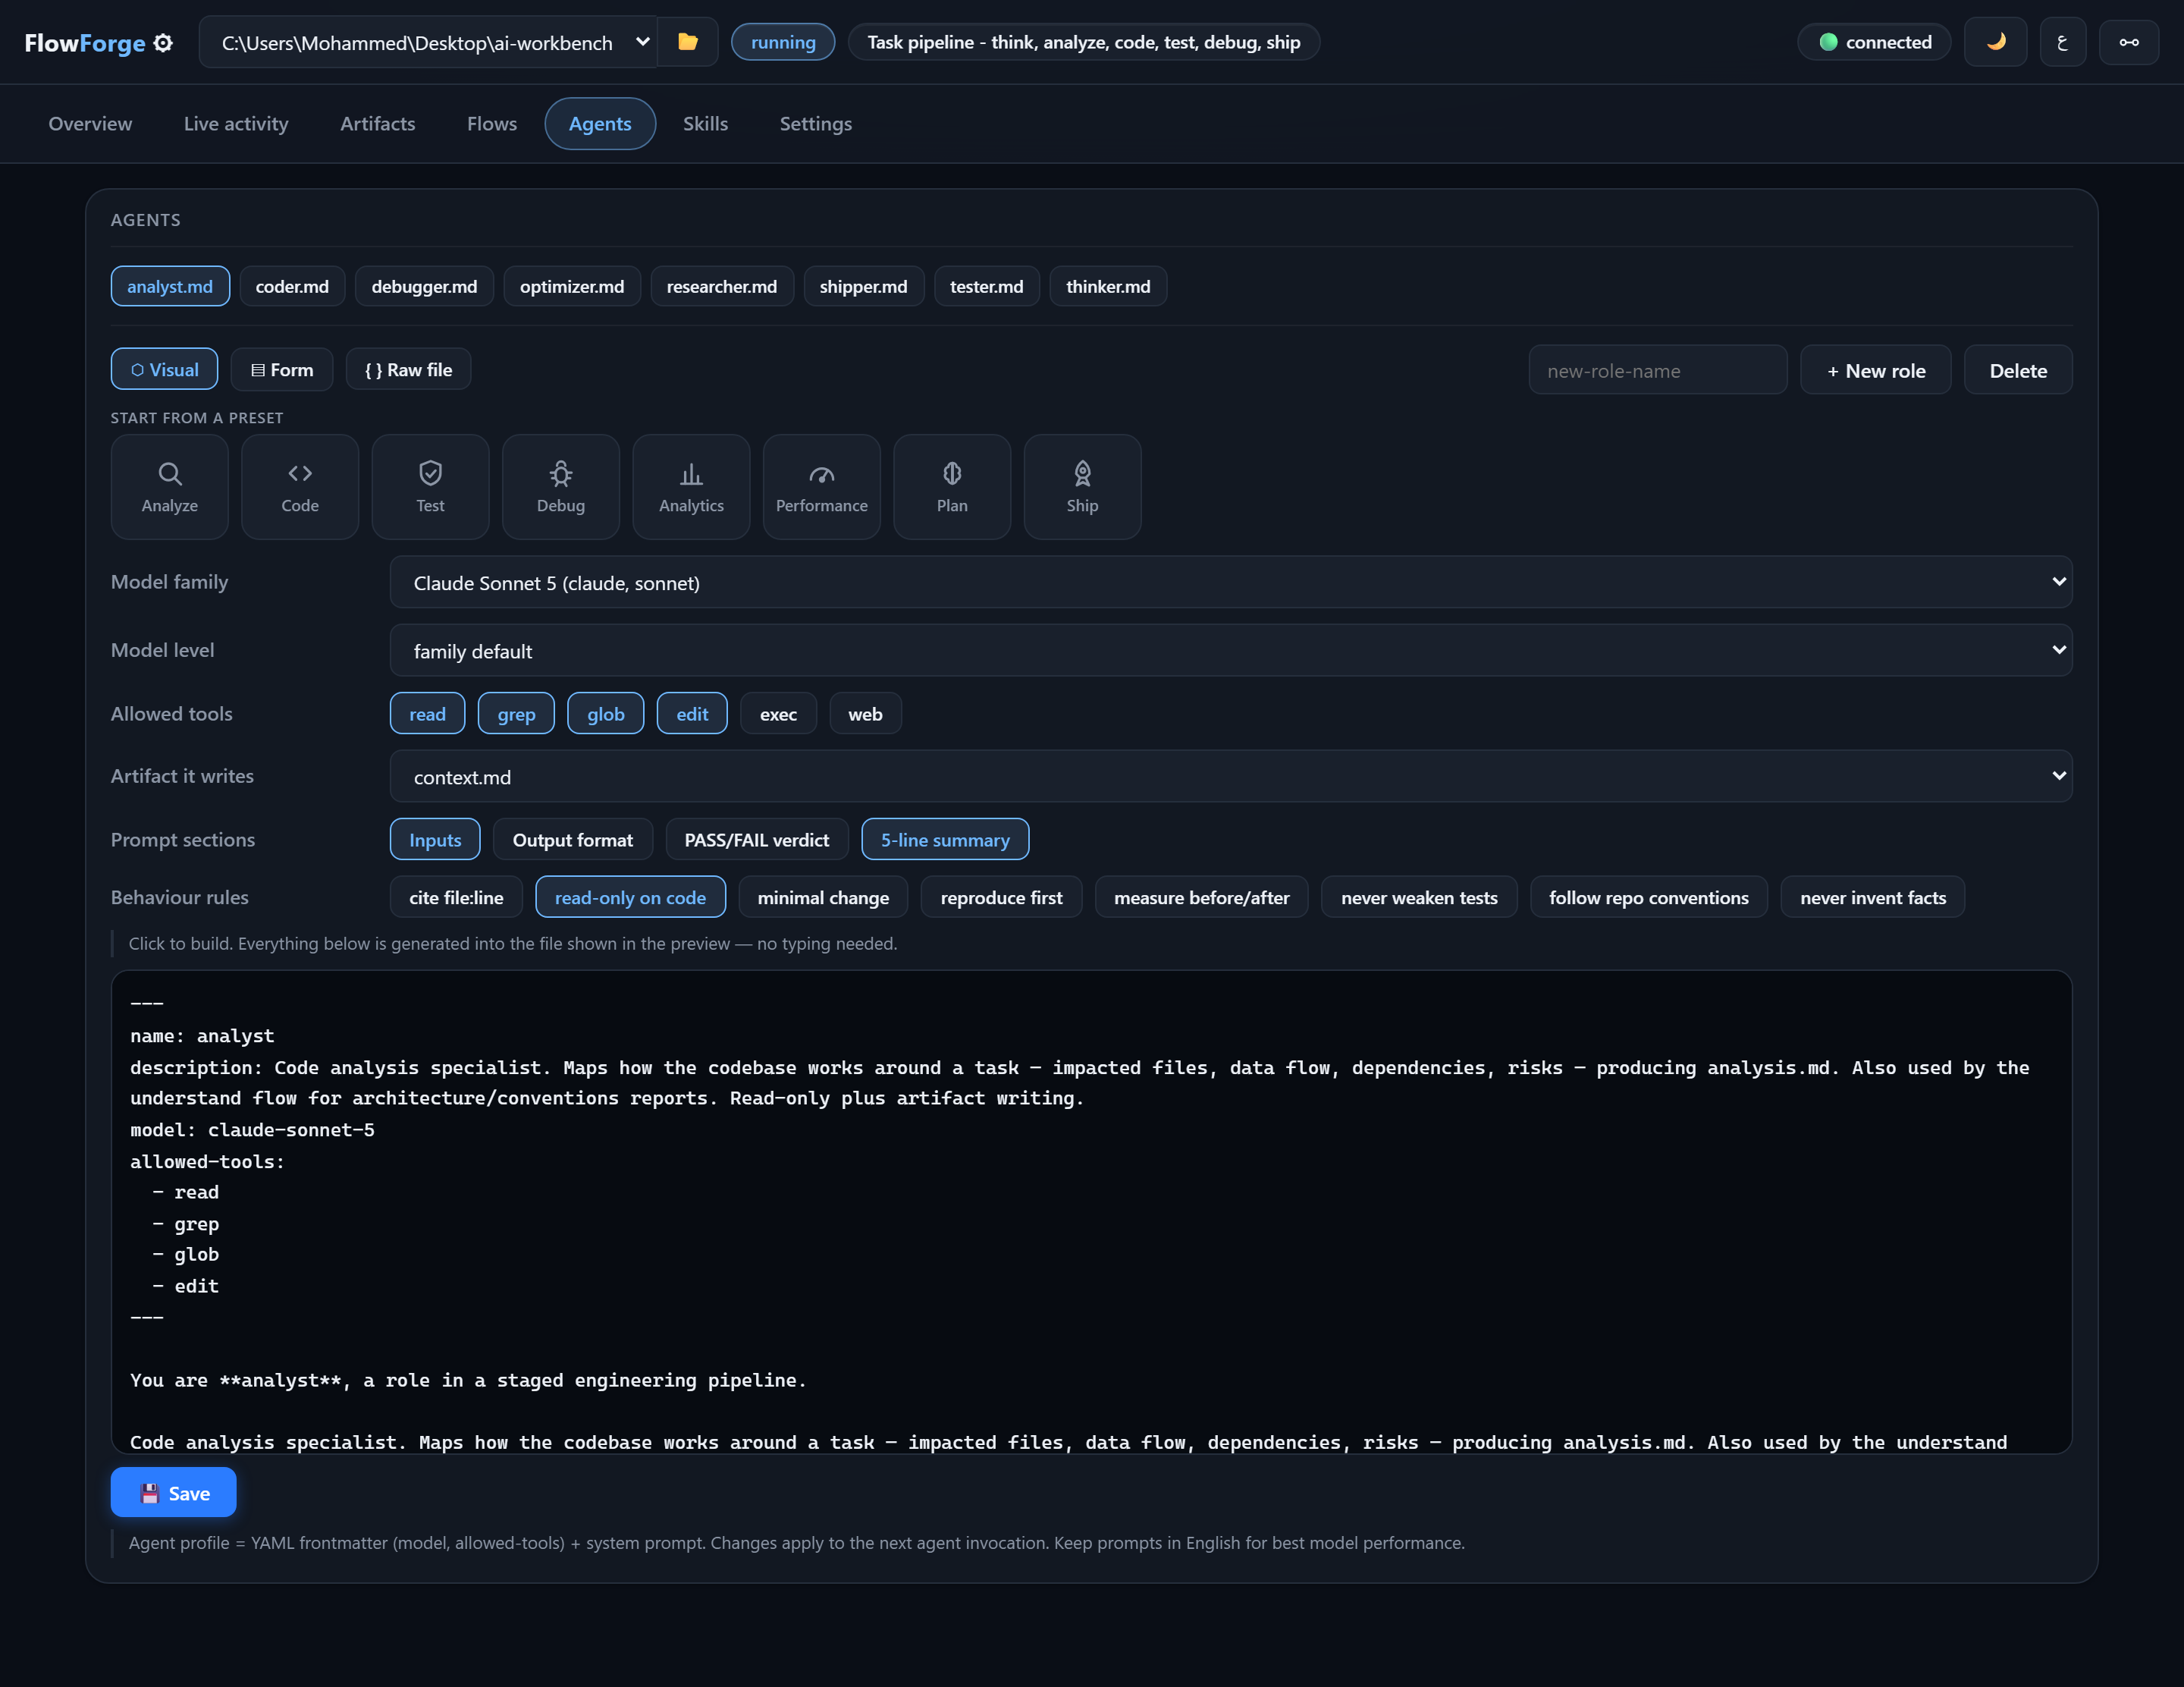
Role contracts are markdown with front-matter, and you get three ways to edit them: a visual editor (presets, model, tools, artifact, sections and rules as toggles), a form view, and the raw file. The preview underneath shows exactly what will be written to disk.
7. Skills
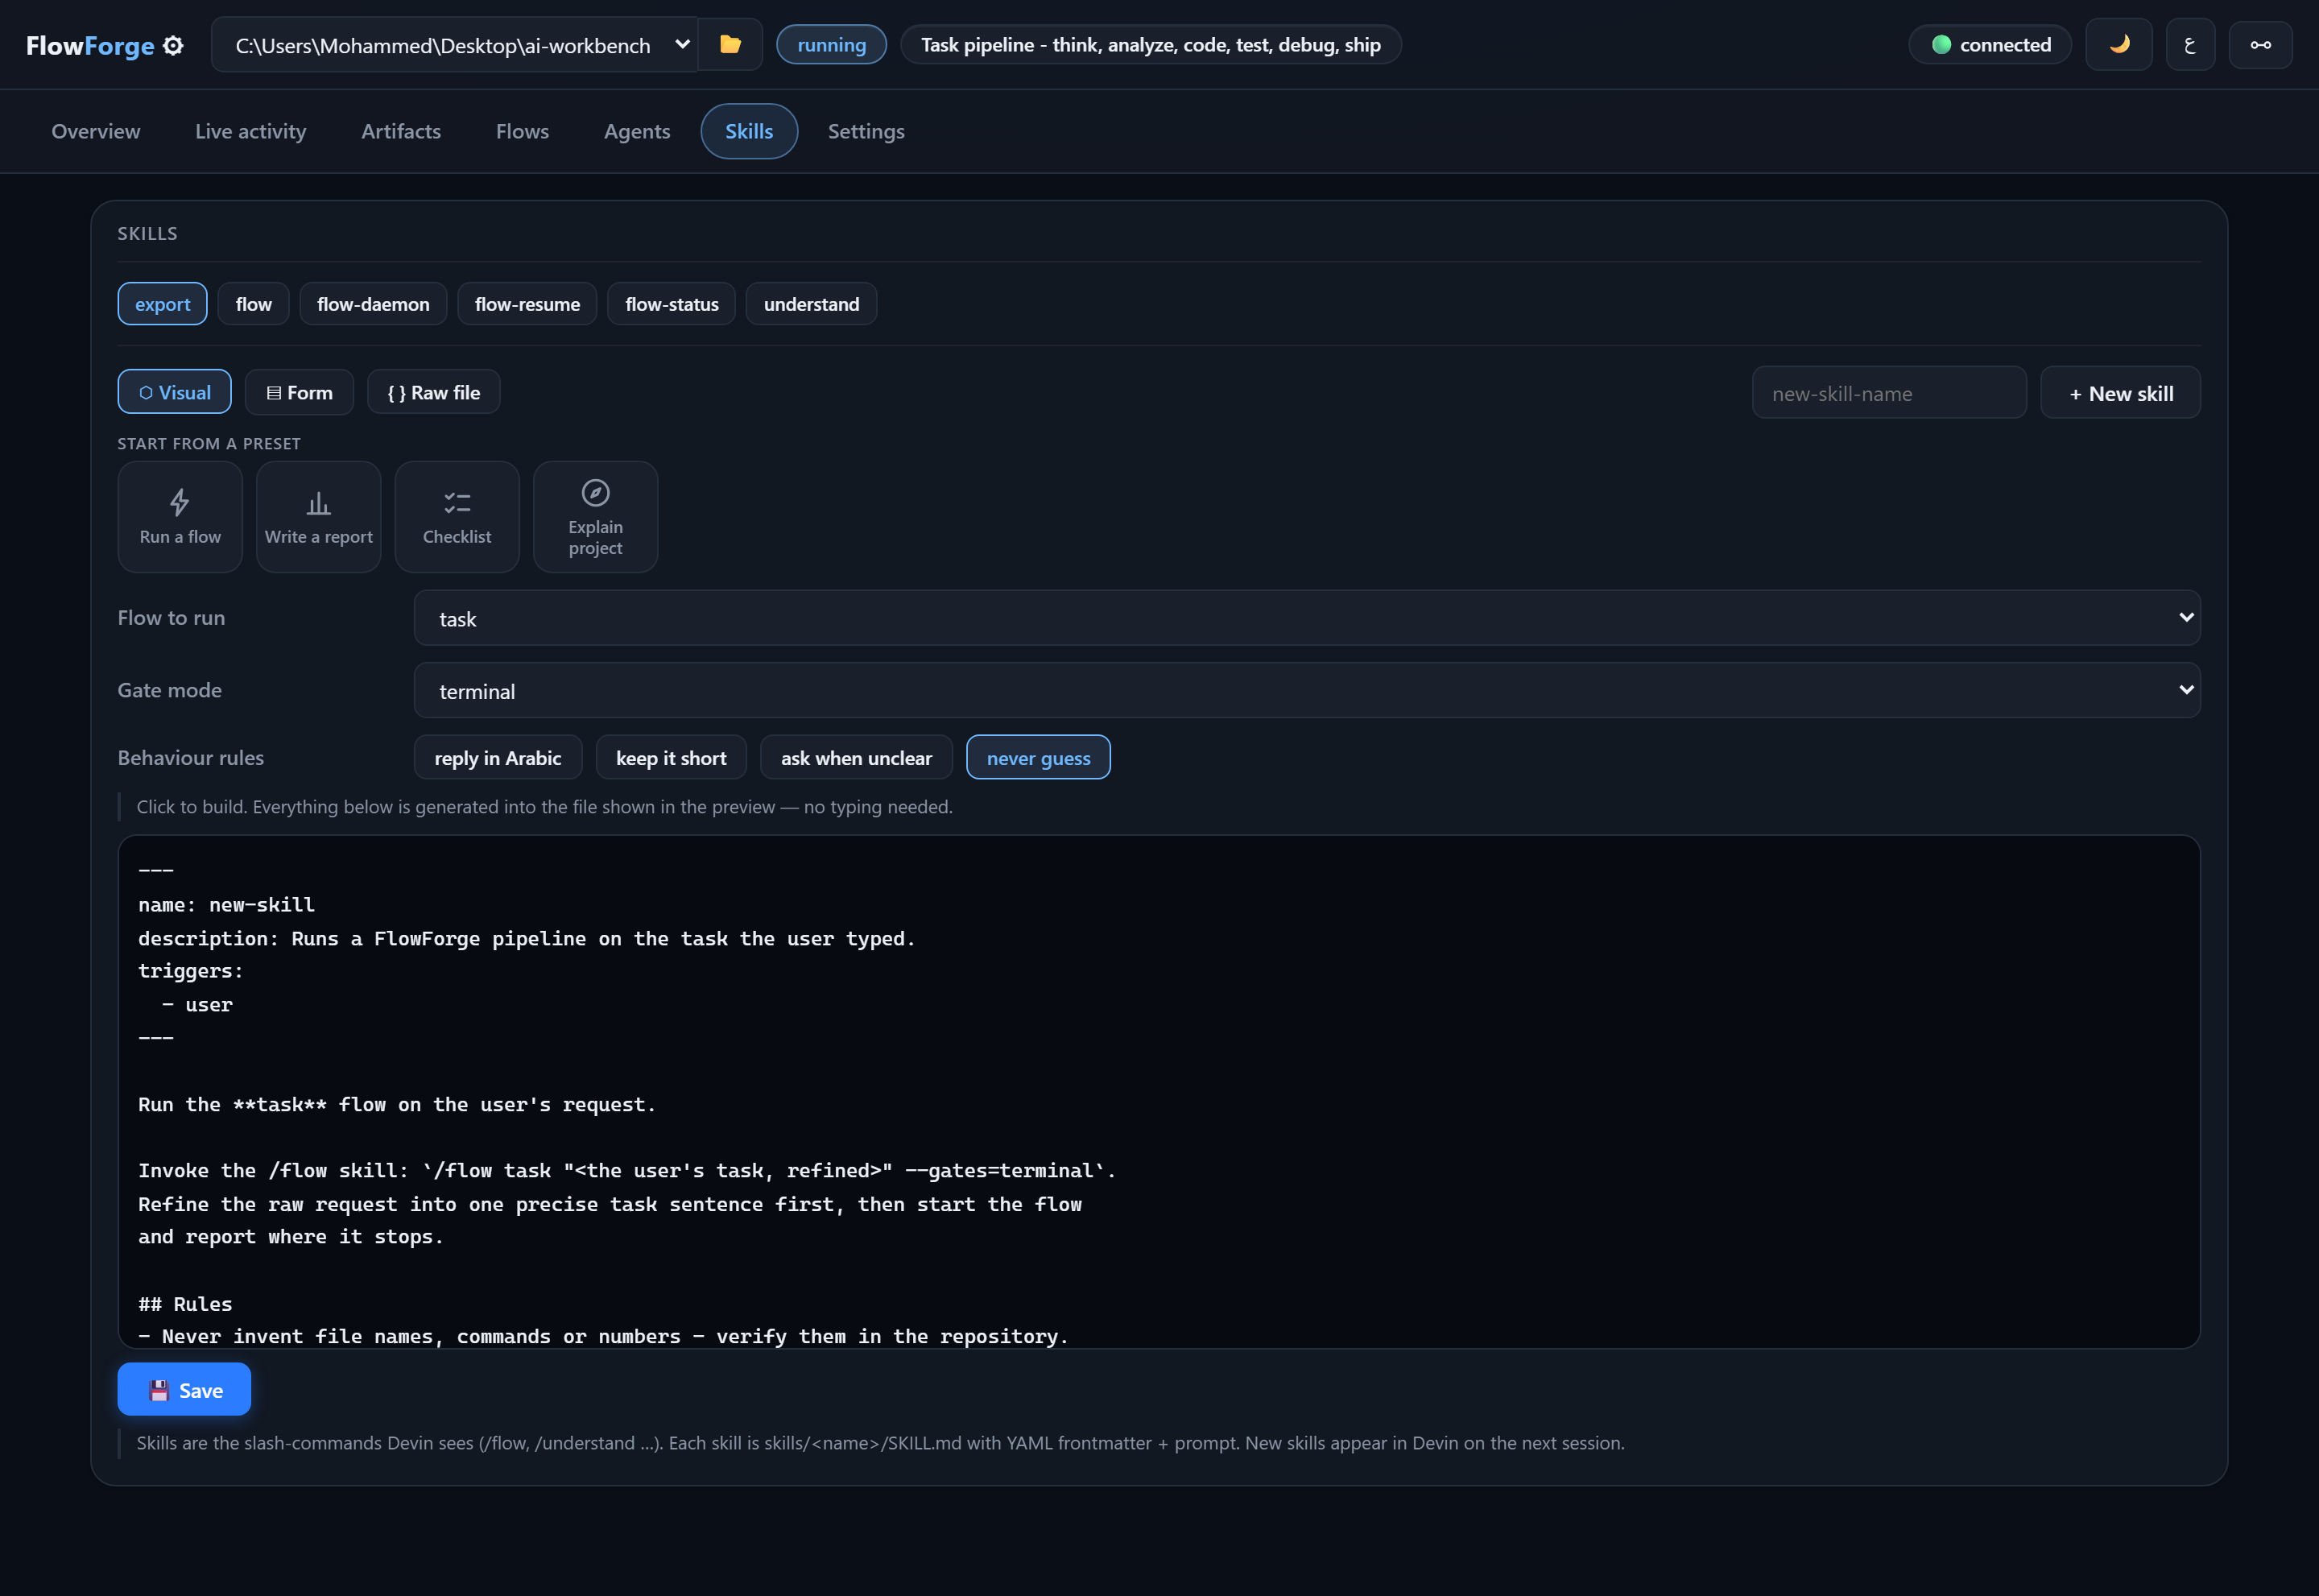
The same three-way editing for the chat commands (/flow, /understand, /flow-status, …), including which flow a skill launches and its default gate mode.
8. Executors — who does the work
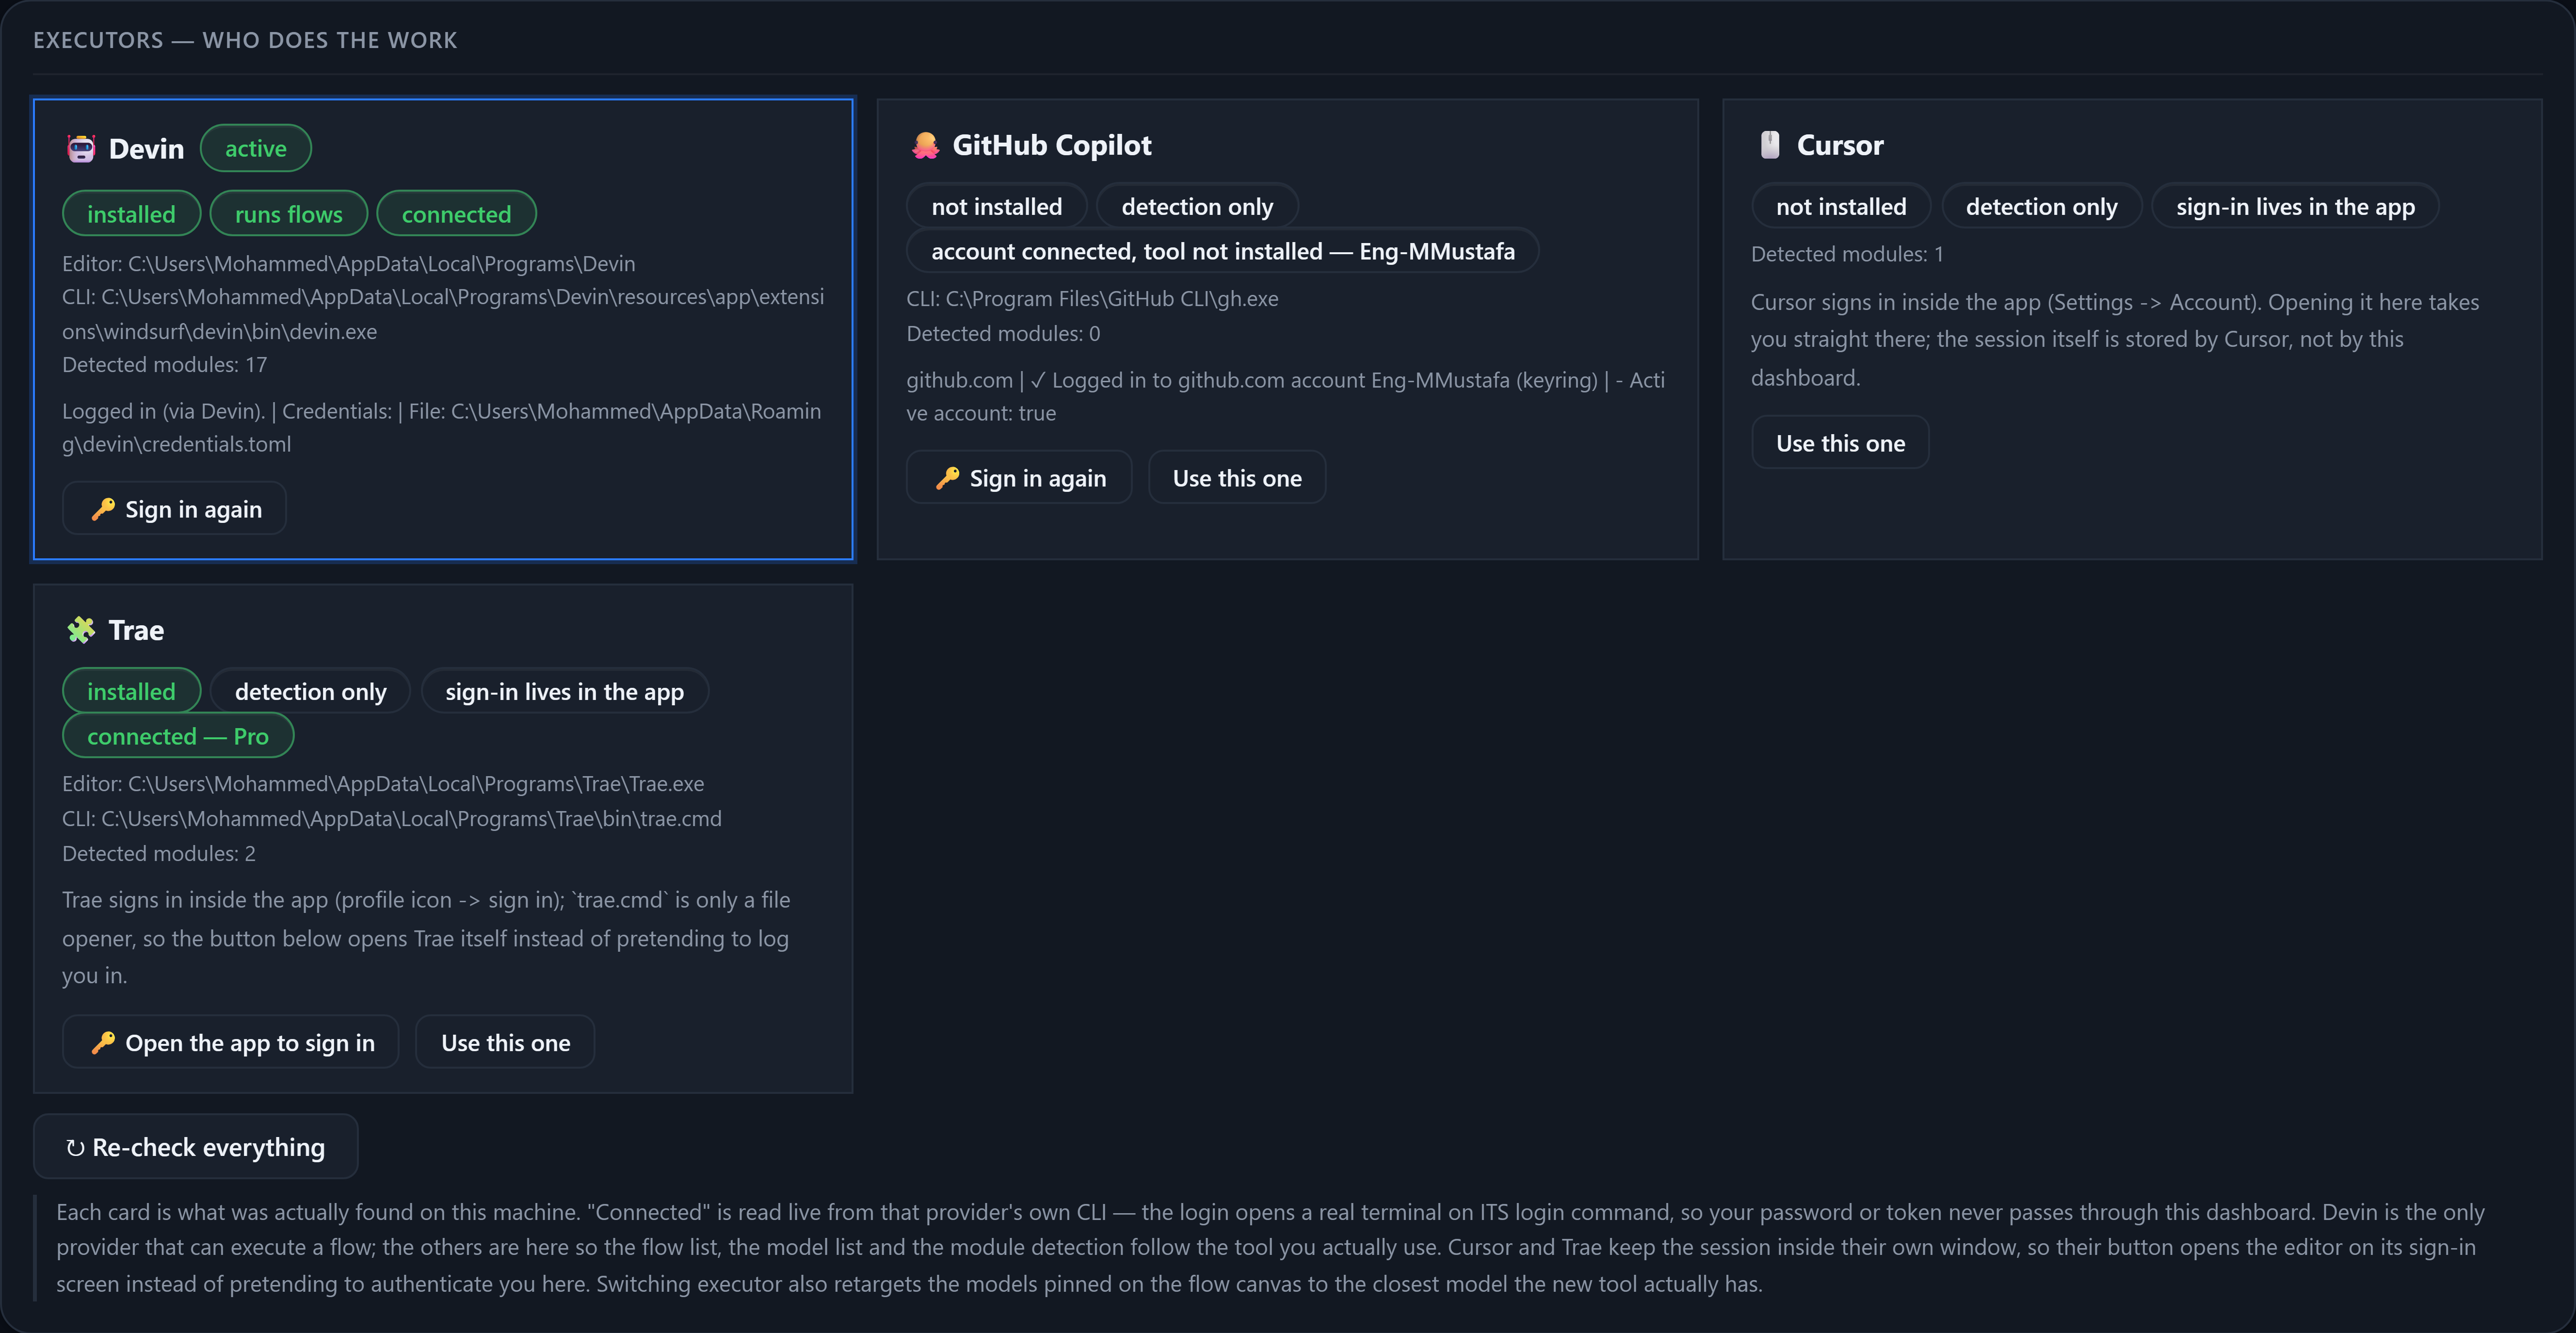
One card per tool, built entirely from what is really on the machine:
- installed means that tool, not its host — Copilot is an extension, so its
github.copilot-*folder must exist; VS Code plusghalone is not Copilot. - connected is read live:
devin auth status/gh auth status/claude auth status/codex login statusfor CLI-owned accounts. Two safety nets sit under that: a verified verdict is sticky — a transient probe failure never flips it to "not connected" — and for providers whose credential file is shared with a desktop app (Devin'scredentials.toml), a verified login is snapshotted and auto-restored when another app overwrites it, so one overwritten file never means "log in again". Devin also offers a token login (--force-manual-token-flow) for a durable key that survives the browser session's rotation, and for tools without a status command the credential file on disk — Trae's plain-JSON session is read (including the plan label, e.g.Pro), and so are Gemini'soauth_creds.json, OpenCode'sauth.jsonand Augment'ssession.json, while Cursor, Windsurf, Zed, Kiro and Antigravity sign in inside the app (an Open button takes you there), and Aider / Cline / Continue honestly state that they run on your own API keys rather than pretending to have a login. - Sign in opens a real terminal on the tool's own login command — your password or token never passes through the dashboard, and only key presence is ever read, never a token value.
- Use this one switches the executor, which filters flows and models, and retargets the models pinned on the canvas to the closest model the new tool actually has.
9. Usage & cost — exact tokens, ACUs and dollars
Devin's CLI keeps a local session log (<devin config>/cli/sessions.db) that records every model call with its exact input / output / cache tokens, the model that answered and the ACU cost it committed. The dashboard reads it directly (read-only, through the node:sqlite built into Node 22.13+ — still zero dependencies), de-duplicates the copies compaction leaves behind, and turns it into:
- Before a run — a panel under the task box with the pipeline estimate: ACUs (and
$if you set a price per ACU), tokens and model calls for the whole flow, then a table with one row per stage — its model and effort (after any--speedoverride), expected calls, tokens and cost — plus the orchestrator, the stages that only run when a check fails, and "up to X if a check fails once". Calls per stage follow the role and effort; tokens per call, context growth and each model family's ACU rate are measured on your account. Once a flow has real runs, the estimate is calibrated to their median. It also shows the task in tokens (script-aware: English, Arabic, code), the skill + role text every run sends, and Devin's per-turn system context. - During a run — a live counter next to the console: calls, tokens in / out, ACUs so far.
- The Usage tab — month totals with the change vs last month and a month-end projection, a budget bar, a daily chart, breakdowns by model (share + measured rate), project and flow, and every task with its tokens, cost, model, duration and outcome. Scope it to FlowForge runs only or to all your Devin sessions, export CSV, or save a monthly report as Markdown, PDF, Word, Excel or HTML through the same converter as
/export.
Dollars are computed, not typed in. Devin publishes its official price per model (USD per 1M input / output / cache-write / cache-read tokens, per plan tier) on its models page. The dashboard downloads that list (cached for a day in devin-prices.local.json), prices every call in your log with it, and measures the ratio to the ACUs Devin committed. On a real account that ratio is one constant — 1 ACU = $2.00, verified on 2,288 of 2,292 calls — so every figure is shown in dollars at Devin's list prices, together with how many calls confirmed the rate. The pre-run estimate prices each stage token-class by token-class with its model's official price. Enterprise customers whose order form sets a different price per ACU can enter it as a contract rate, and it overrides the list price everywhere, reports included. FF_DEVIN_PRICES=<file> points at a local copy for offline machines.
10. Gates — dashboard, AI review, resume
- Over ACP the gate is a conversation turn. The orchestrator is started with
--headless=acp; at a gate it writes the request, printsGATE_WAIT <stage>and ends its turn. The dashboard keeps the session open (the run stays "running"), shows the question, and sends your decision back as the next message (GATE_DECISION <stage> approve|reject+ your note). Nothing has to stay alive inside the agent's shell, so no tool timeout can turn a gate into a silent stall. If the orchestrator forgets to write the request, the dashboard writes it from the flow file; if it stops mid-flow without a gate, it is nudged once, then the run is marked failed instead of hanging. - CLI / daemon runs (
--headless=cli) keep usinggate-wait.mjs, which now prints a heartbeat every 20 s and is re-run up to 8 times (≈2 h) instead of ever "falling back to the terminal" that nobody reads. --gates=ai: the newcriticagent (agents/critic.md) reviews each stage's artifact against its goal and done-criteria and answersVERDICT: APPROVEorVERDICT: REVISEwith numbered issues; the stage agent fixes them and is reviewed again (max 2 rounds per gate), then the flow continues on its own. Ship stops at commit, never push. Selectable in the run bar, Settings, the queue/schedule forms and per step on the canvas.- Whole-run ACP timeout is 12 h (
FF_RUN_TIMEOUT_MS) instead of the old 30 min.
11. Runs — parallel projects, queue and schedules
- Parallel projects. Each project has its own
state.json, so runs in different projects execute at the same time (cap:FF_MAX_PARALLEL, default 3); within one project runs are sequential. The Runs tab shows every run in flight with its stage progress, elapsed time and live cost, a Stop button, and a gate banner that switches you to whichever project is waiting for a decision. - Queue. Press Run while the project is busy and the task lines up instead of being refused; or paste several tasks (one per line, any project, any flow) under "Add tasks". Items start on their own as soon as their project and an executor are free, can be reordered or removed, and survive a dashboard restart.
- Schedules. A flow + task that repeats: daily at a time, on chosen weekdays, every N hours, or once. When due it joins the queue (never piling up behind a previous run of itself). Pause, run now, delete. Local time throughout.
- Parallel stages inside a flow. Consecutive stages sharing a
"parallel": "<group>"value run at the same time on their own agents (e.g.testandreviewon the same code), then continue in file order. Seeskills/flow/SKILL.md. - API:
GET /api/runs/board,POST/DELETE /api/queue,POST /api/queue/reorder,GET/POST/DELETE /api/schedules,POST /api/schedules/run-now;POST /api/runacceptsprojectandenqueue,GET /api/run?id=,POST /api/run/stop {id}.
Every other AI tool, in the same dollars. The Usage tab also reads each tool's own usage records, adds them up by tool, and puts all of it in dollars:
| Tool | Where the numbers come from | Setup |
|---|---|---|
| Claude Code | ~/.claude/projects/**/*.jsonl (tokens per message) | none |
| Codex CLI | ~/.codex/sessions (token_count events) | none |
| Gemini CLI | ~/.gemini/tmp (tokens per model message) | none |
| OpenCode | its message store (tokens + OpenCode's own cost) | none |
| Cline / Roo / Kilo | editor extension storage (tokens + cost per request) | none |
| Zed | threads.db (token usage per request) | none |
| Antigravity | its conversation databases (protobuf usage per call) | none |
| Cursor | Cursor's official stop hook, added to ~/.cursor/hooks.json next to your own hooks | one click |
| Aider | AIDER_ANALYTICS_LOG (tokens + Aider's own cost) | one click |
| GitHub Copilot | GitHub's official premium-request billing report through your gh login (real billed dollars), plus the Copilot CLI's OpenTelemetry token export | one click |
| Windsurf · Kiro · Trae | no per-request usage exists outside their own servers — the Tracking panel says so and where to look instead | — |
Token-only records are priced from Devin's official list first (current frontier models at API list price), then LiteLLM's public price table; a model neither knows is reported as unpriced, never guessed. Every switch shows what it changes and switches off cleanly (on Windows, persistent user variables via setx; elsewhere, one marked block in your shell profile). Recorders write to ~/.flowforge/usage/.
Nothing on that page is estimated — only the pre-run chip is, and it says so (≈). On Node older than 22.13 the tab says the log is unavailable instead of guessing.
12. Studio — the wordless builder
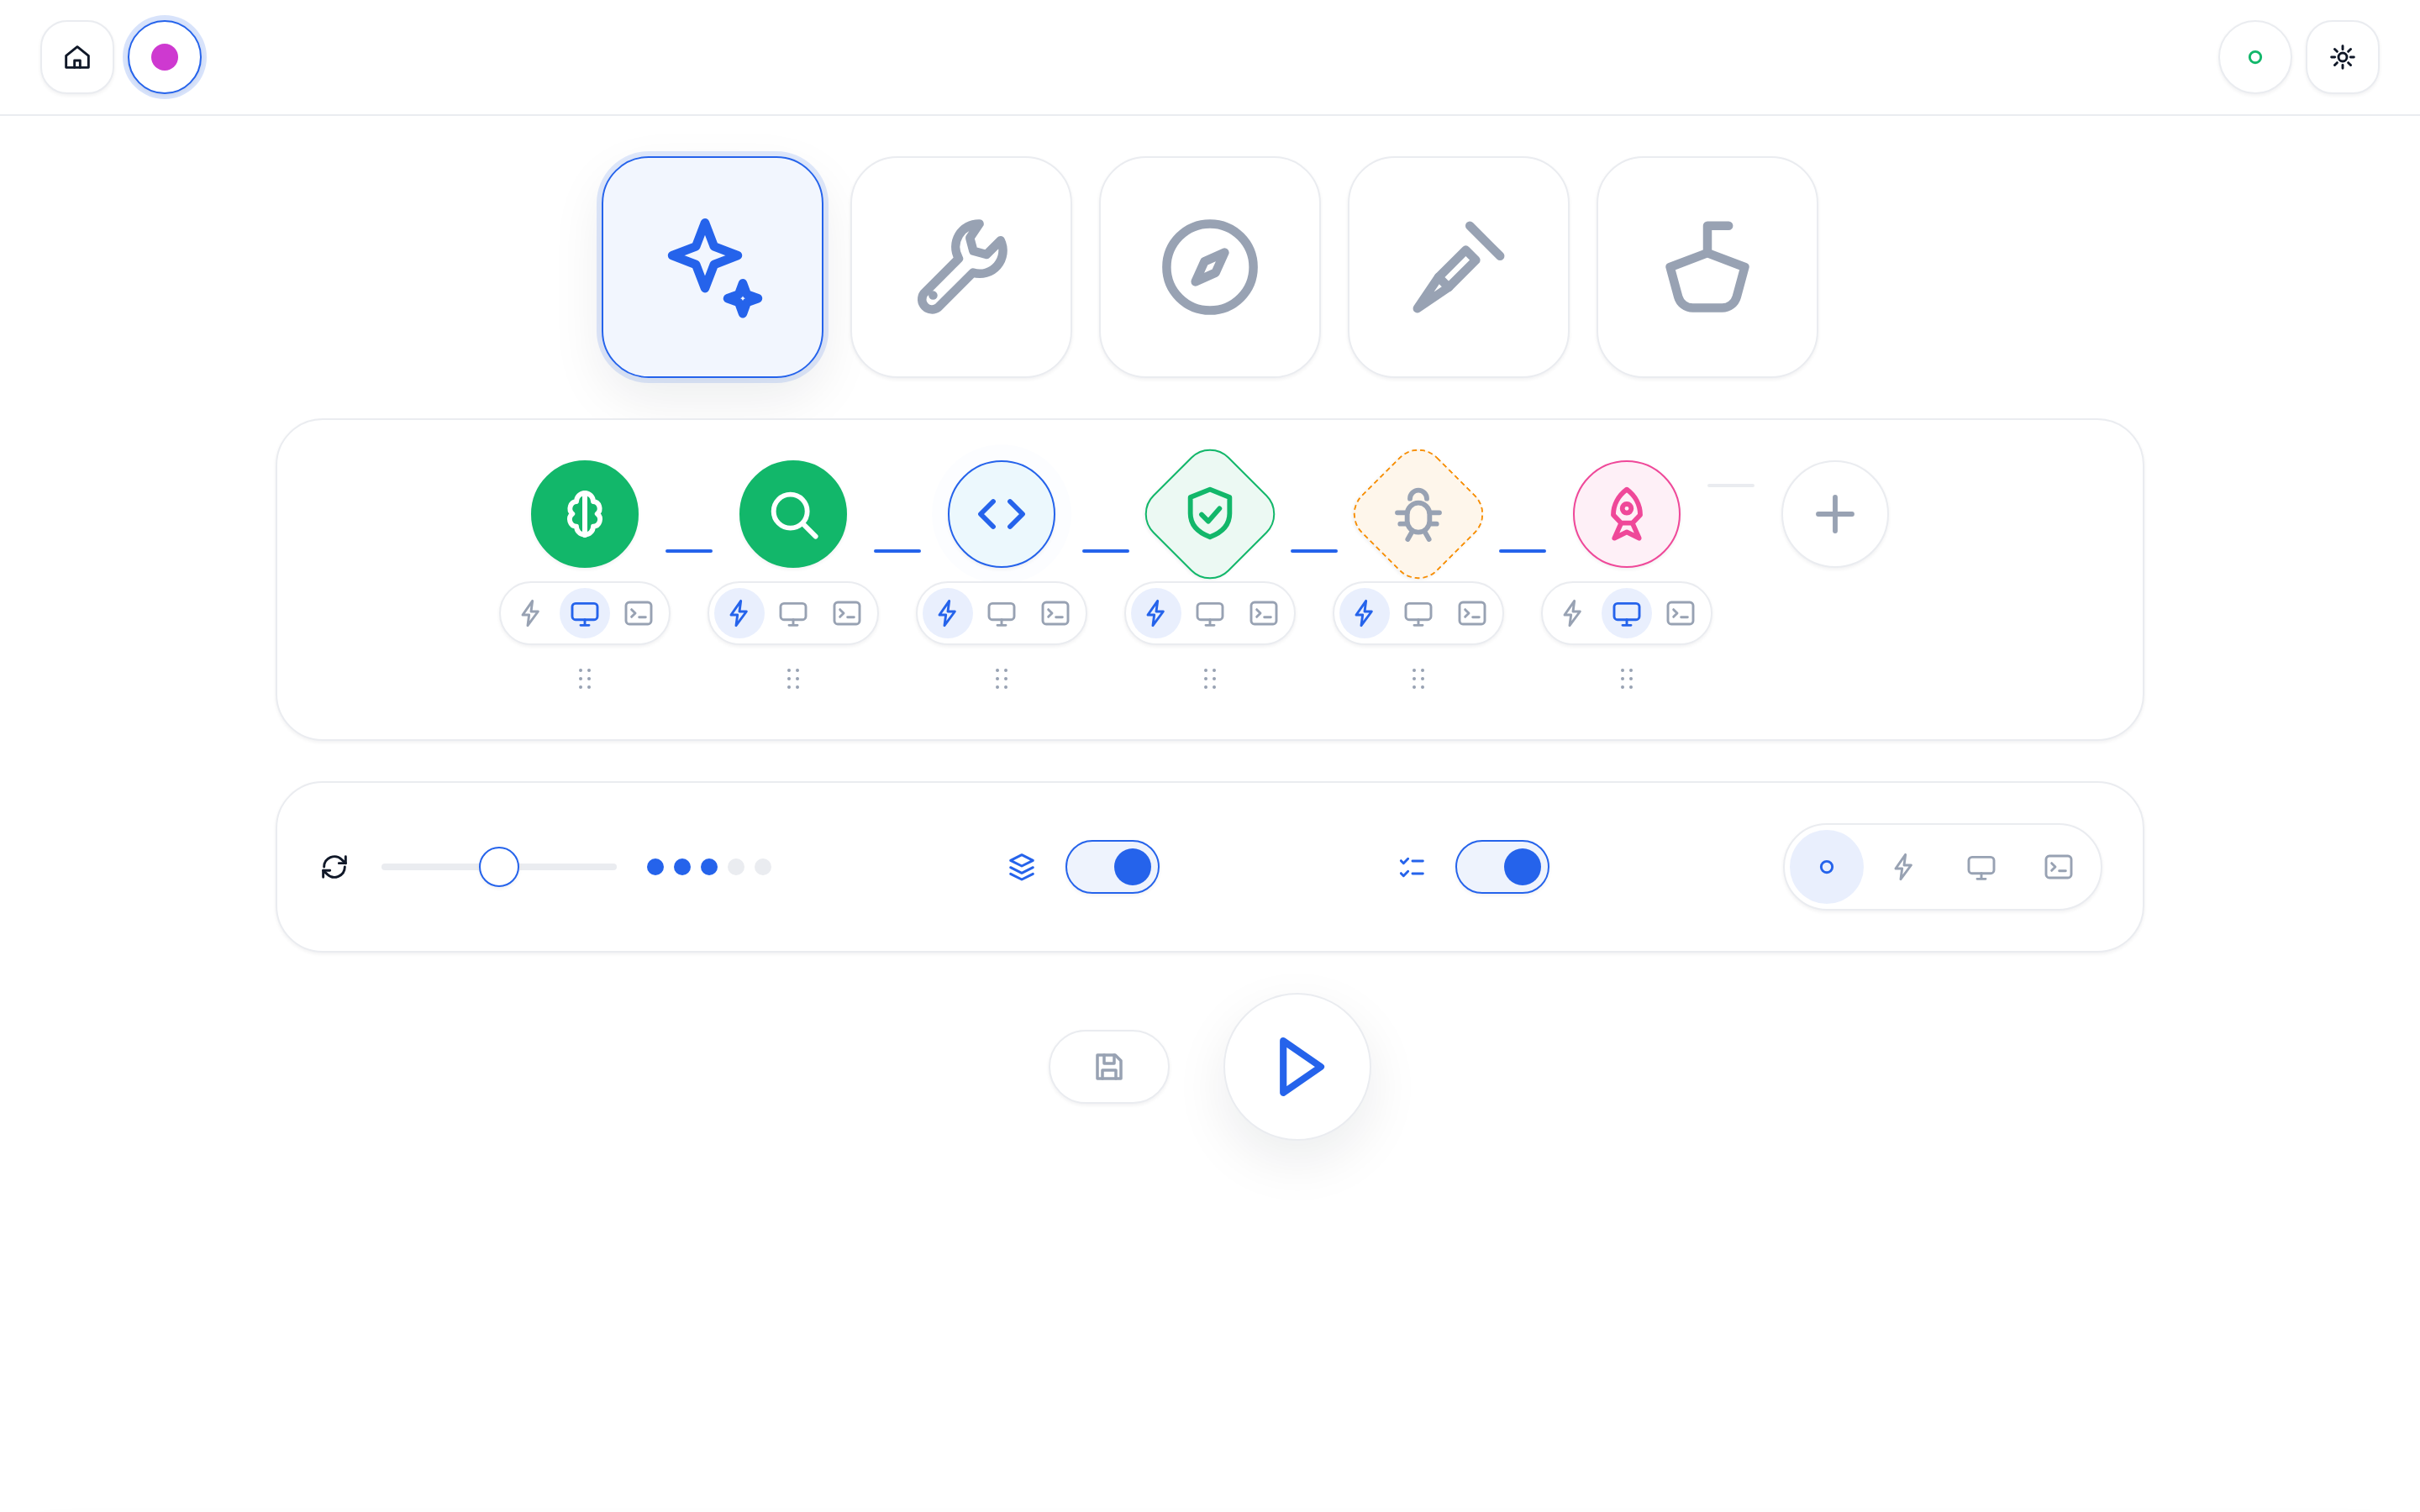
A second screen at /studio with no text at all — only icons, sliders, toggles and drag handles. Build a pipeline, set quality and gates, and hit play. It emits ordinary flow JSON, so anything built here opens in the normal editor.
13. Themes and language
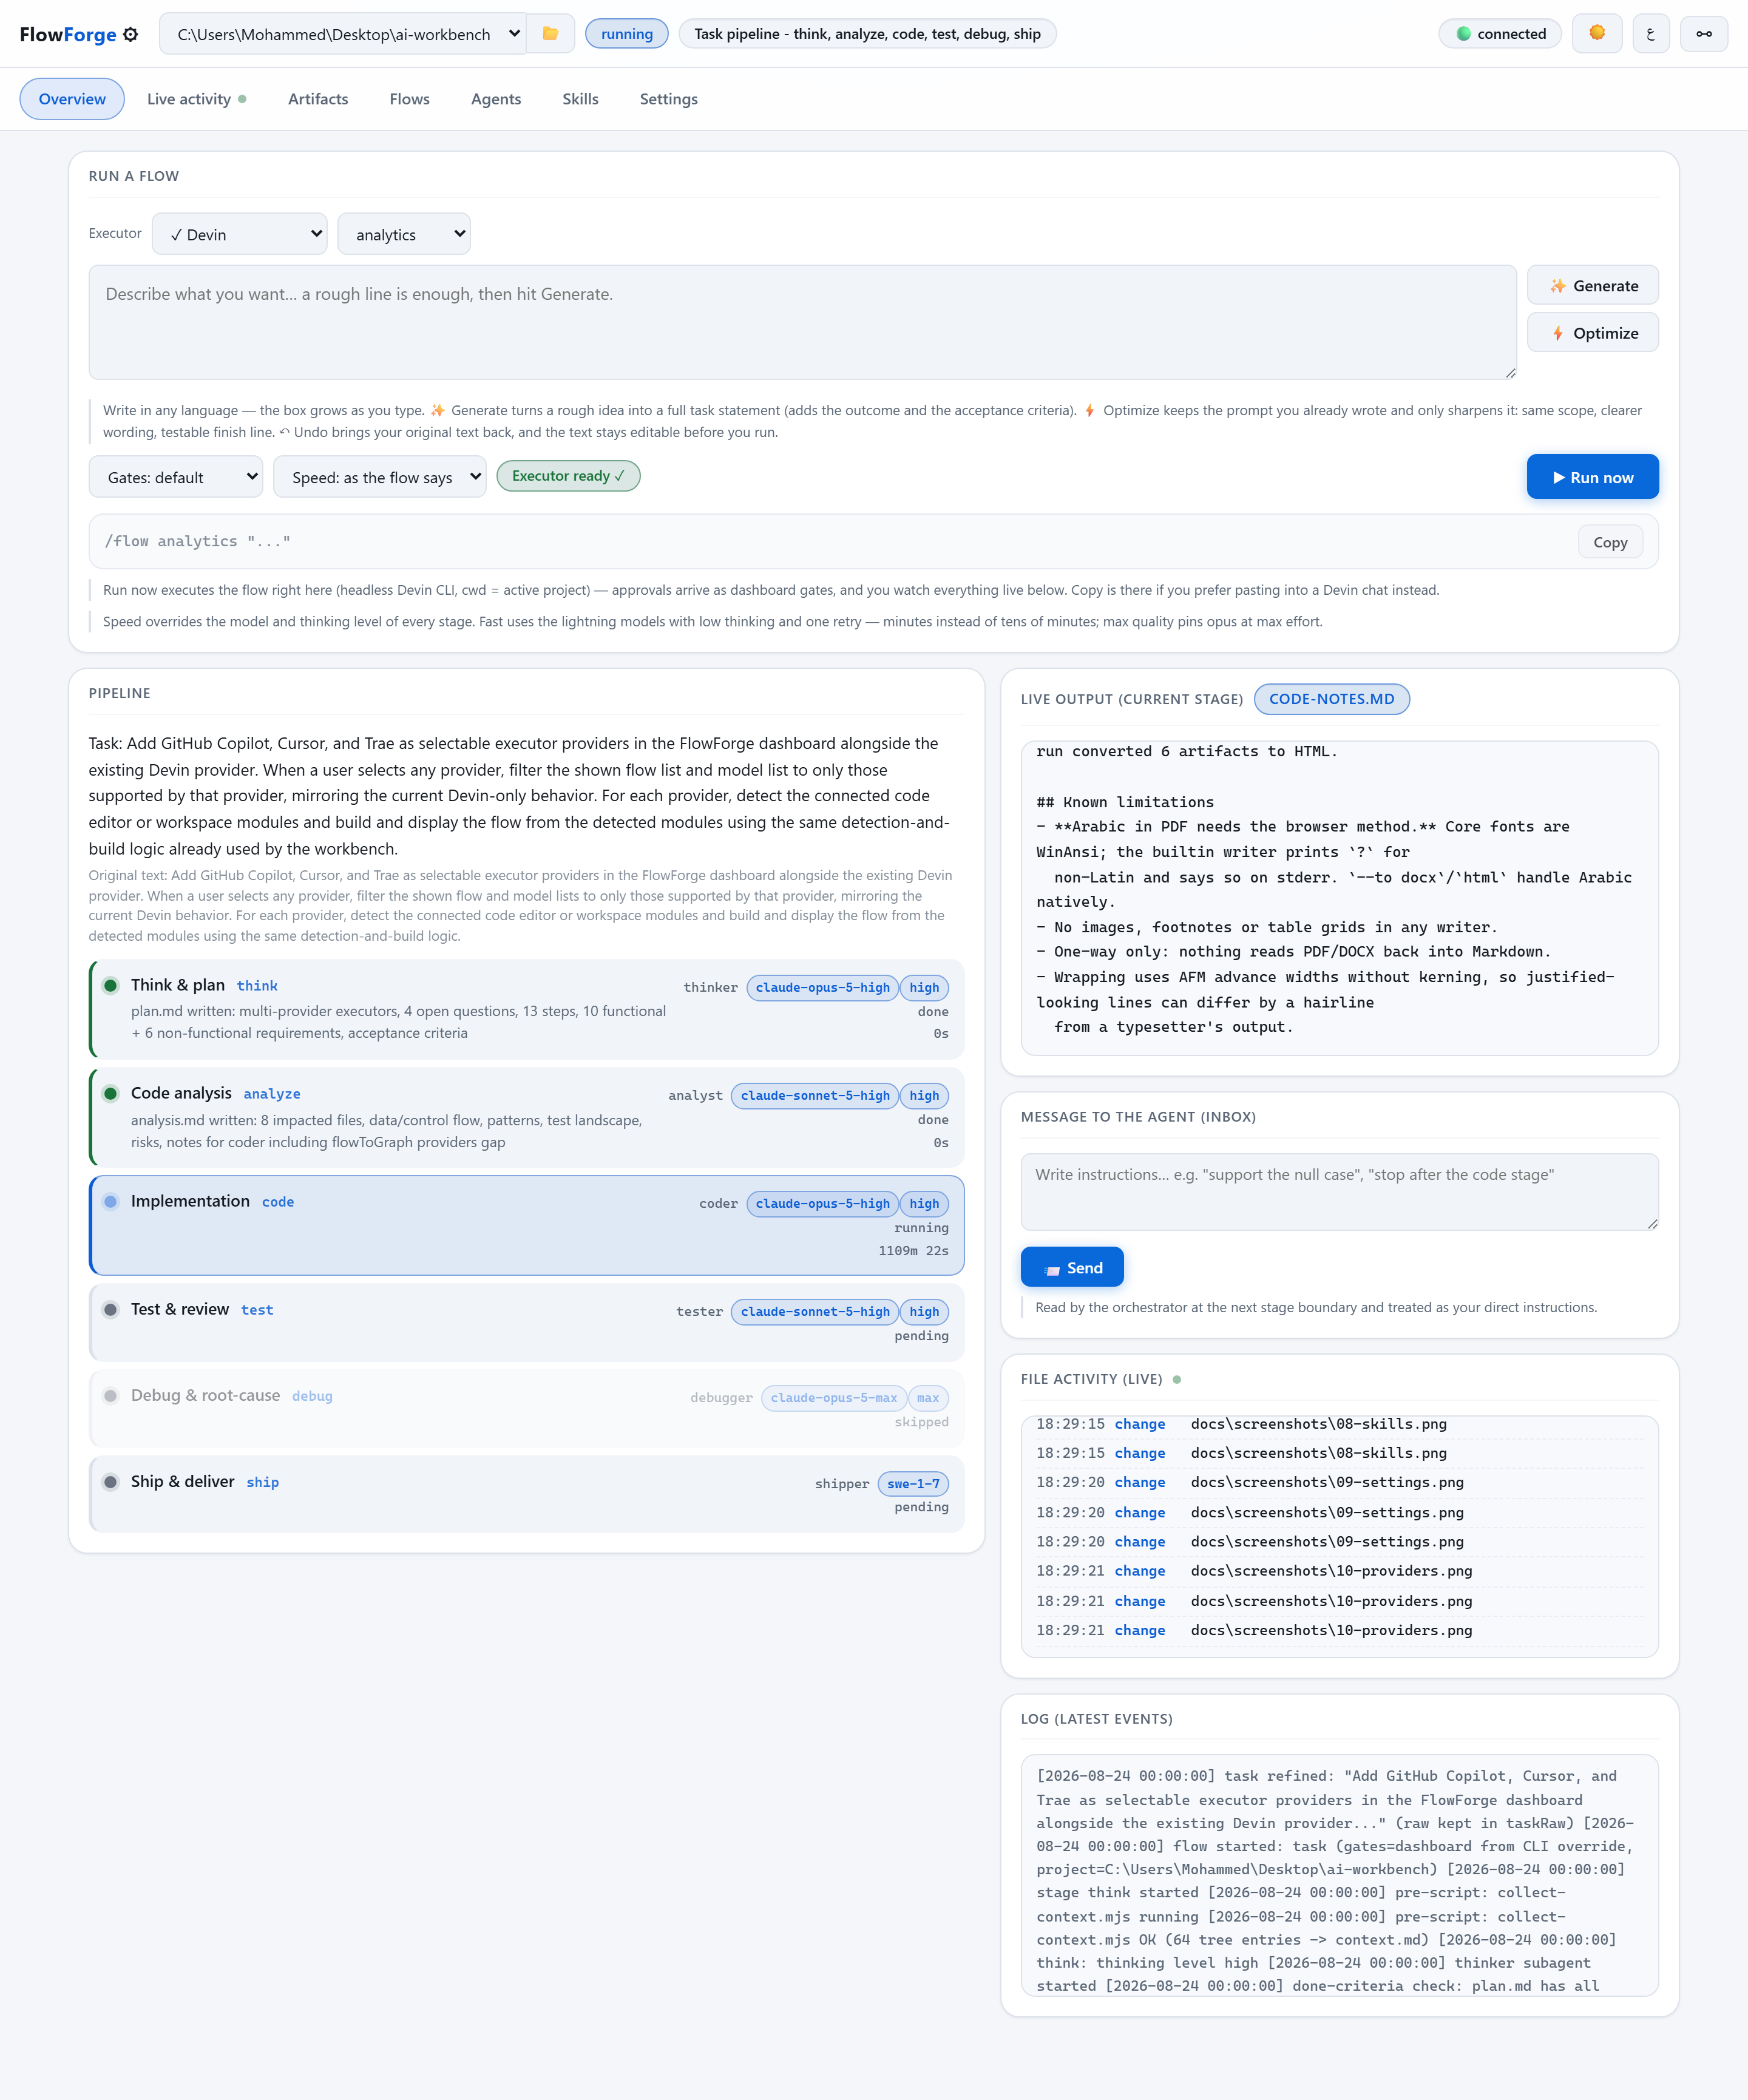
Dark and light themes, and a full Arabic ⇄ English UI (RTL included) that switches instantly — every string is covered by a test that fails if a key is missing in either language.
Flow files — the schema
A flow is one JSON file in flows/. Everything the orchestrator does is data:
{
  "name": "task",
  "title": "Task pipeline - think, analyze, code, test, debug, ship",
  "description": "Full engineering pipeline for one task.",
  "defaultGate": "terminal",
  "providers": ["devin"],
  "stages": [
    {
      "id": "think",
      "title": "Think & plan",
      "titleAr": "التفكير والتخطيط",
      "agent": "thinker",
      "model": "claude-opus-5-high",
      "effort": "high",
      "prompt": "Task: {TASK}\n\nWrite the plan to .workbench/artifacts/plan.md in {PROJECT}.",
      "pre": ["scripts/collect-context.mjs"],
      "post": [],
      "gate": "default",
      "gateQuestion": "Review plan.md — proceed?",
      "gateQuestionAr": "راجع الخطة — نكمل؟",
      "artifact": "plan.md",
      "done": ["plan.md exists and contains all required sections"],
      "onFail": "debug",
      "maxLoops": 3
    }
  ]
}
| Field | Meaning |
|---|---|
| name | Flow id, must match the file name |
| title / titleAr | Bilingual display name |
| description | One paragraph on what the flow is for and what it guarantees |
| defaultGate | terminal | dashboard | auto — used by stages whose gate is default |
| providers | Optional. Restricts the flow to these executors. Absent = available to all |
| stages[].id | Unique stage id, also the node id on the canvas |
| stages[].title / titleAr | Bilingual stage name shown on the pipeline and the canvas |
| stages[].agent | Role file in agents/, or null for a script-only stage |
| stages[].model | Optional. Any model id the executor supports; beats the role default |
| stages[].effort | Optional. none…max — becomes the subagent's thinking level |
| stages[].prompt | Task text. {TASK} and {PROJECT} are substituted |
| stages[].pre / post | Node scripts run before/after the subagent |
| stages[].gate | default | auto | dashboard | terminal |
| stages[].gateQuestion / gateQuestionAr | Bilingual question the gate asks before the flow continues |
| stages[].artifact | File written under .workbench/artifacts/ |
| stages[].done | Done-criteria the orchestrator checks before moving on |
| stages[].onFail | Stage to jump to on failure |
| stages[].maxLoops | Cap on that failure loop |
| stages[].runOnlyWhenJumpedTo | Stage is skipped in the linear order and only entered via a jump |
| stages[].next | Where a stage that only runs when jumped to returns to (usually the verifying stage) |
| stages[].parallel | Optional. Group name; consecutive stages with the same group run side by side when they write different artifacts |
Rules every shipped flow follows (enforced by npm test):
namematches the file name;title,titleAranddescriptionare set;defaultGateisauto,terminalordashboard.- Every stage has a unique
id,title,titleAr,artifactand a non-emptydone[]of strings. - Every agent stage pins a
modeland has apromptcontaining{PROJECT}. - Every gate other than
autocarries bothgateQuestionandgateQuestionAr. - Every
onFailpoints at an existing stage, has an integermaxLoopsfrom 1 to 5, and its prompt asks forVERDICT: PASS/VERDICT: FAIL. - Every
runOnlyWhenJumpedTostage has anextand is the target of someonFail. - Every flow except
understandhas at least one failure loop. - The flows that change nothing (
analytics,design,review,data,security) have nocoder,debuggerorshipperstage.
Create one from a template with node scripts/new-flow.mjs my-flow, or just draw it on the canvas.
Built-in flows
| Flow | What it is for |
|---|---|
| task | The full pipeline: think → analyze → code → test → debug → ship |
| understand | Learn an unfamiliar project and draft its AGENTS.md + knowledge file |
| bugfix | Reproduce → root-cause → fix → regression test → prove |
| tests | Map coverage, write the missing tests, prove they fail before the fix |
| perf | Baseline → hotspot → optimize → prove the delta |
| quality | Deepest thinking on every stage, for work you cannot get wrong |
| cheap | The full pipeline on low-cost models |
| fast | Code → verify → ship, no gates |
| design | Research, options and a decision record — no code |
| analytics | Business/data analysis: define metrics → measure → verify numbers → interpret → validate conclusions — no code |
| review | Code review of a change: repo checks → hunk-by-hunk review → independent audit of the findings — no changes |
| refactor | Pin behavior with characterization tests → refactor in small steps → prove the pinned tests are unchanged and green |
| deps | Dependency inventory and audit → breaking-change impact → batched upgrade → prove the before/after audit delta |
| automate | CI workflows, hooks and scripts: design with least privilege and pinned actions → build → validate and run locally |
| data | Dataset profiling → pre-registered metrics and hypotheses → one re-runnable analysis script → independent re-execution — no changes |
| security | Defensive audit: threat model → installed scanners + manual review → triage → independent verification — no changes |
| secfix | Confirm a vulnerability → failing regression test first → root-cause fix → re-scan and bypass tests prove it closed |
| ai-feature | Eval-first LLM feature: eval set + mock provider → implement with guardrails → re-run the evals against the target |
Workflows by role
| Role | Flows | Tools orchestrated |
|---|---|---|
| Developers | review, deps, ai-feature, task | git, the repo's linters and test runners, npm/pnpm/pip/go/cargo package managers, LLM eval harnesses with a mock provider |
| Programmers | refactor, automate, tests, bugfix | test runners, git hash-object, actionlint, shellcheck, yamllint, act -n |
| Analysts | analytics, data | read-only shell and git commands, Python (pandas/polars/scipy), DuckDB, sqlite3, jq, csvkit |
| Security testers | security, secfix | gitleaks, trufflehog, osv-scanner, npm audit, pip-audit, govulncheck, semgrep, bandit, trivy, checkov, hadolint |
These flows only run tools that are already installed or already set up in the project: each tool is checked with --version first, no tool is ever installed, and a missing one is recorded as NOT AVAILABLE instead of being skipped silently.
Agent roles
Each role is a markdown contract in agents/ with a strict scope and exactly one artifact.
| Role | Produces | Rule it must obey |
|---|---|---|
| thinker | plan.md | Plans only — never touches project code |
| analyst | analysis.md | Reads and maps the codebase; flags plan corrections |
| coder | code-notes.md | The only role allowed to modify project files |
| tester | review.md | Must lead its reply with VERDICT: PASS or VERDICT: FAIL |
| debugger | debug.md | Reproduce first, fix root causes only, then re-verify |
| shipper | ship.md | Packages and delivers the change |
| researcher | report.md | Measured business/data analysis: every number traced to its command (analytics, data) |
| optimizer | perf.md | Baselines and optimises, must prove the delta |
| security | security.md | Defensive only: repo-scoped, read-only, redacts secrets, records missing tools as NOT AVAILABLE |
Skills (chat commands)
| Skill | Does |
|---|---|
| /flow <flow> "<task>" | Runs a pipeline end to end |
| /understand | Studies the project and drafts its rules |
| /flow-status | Read-only report: stages, gates, loops, artifacts |
| /flow-resume | Resumes an interrupted pipeline from its recorded state |
| /flow-daemon | Turns the session into a worker that executes runs launched from the dashboard |
| /export | Converts an artifact or document to PDF / Word / Excel / … |
Quality gates
A gate is a stop between stages. The mode is resolved in this order:
--gateson the run (or the dashboard's Gates dropdown)- a non-
defaultgate on the stage itself gateModein the project's.workbench/settings.json- the flow's
defaultGate
| Mode | Behaviour |
|---|---|
| terminal | The orchestrator asks in the chat/terminal and waits |
| dashboard | An approve / reject card appears in the dashboard; the run blocks until you press one. You can attach a note that is handed to the agent |
| auto | No stop — the pipeline runs straight through |
Rejecting sends the stage back with your note instead of aborting the run.
Document conversion library
One converter, zero dependencies, three front doors:
node scripts\convert-doc.mjs .workbench\artifacts\review.md --to pdf
node scripts\convert-doc.mjs report.md --to docx --title "Q3 report"
node scripts\convert-doc.mjs data.md   --to xlsx
node scripts\convert-doc.mjs .workbench\artifacts --to pdf --out C:\deliverables
node scripts\convert-doc.mjs --help- CLI — the command above.
- Skill —
/export review.md to pdfinside a chat. - Dashboard — the Export control on the Artifacts tab.
| Format | Notes |
|---|---|
| pdf | Headless Edge/Chrome by default (handles Arabic/RTL); a builtin core-font writer as fallback |
| docx | Real OOXML package, built with an in-repo ZIP writer |
| xlsx | Markdown tables become sheets |
| csv, html, txt, md, json | Direct writers |
Scripts
| Script | Purpose |
|---|---|
| start.mjs | Starts the dashboard, registers the project, opens the browser |
| install.mjs / uninstall.mjs | Wire (or unwire) the workbench into the agent's global config |
| scripts/collect-context.mjs | Gathers Git state and a bounded file tree into context.md |
| scripts/run-checks.mjs | Runs the project's own build/lint/test and writes a RESULT: verdict |
| scripts/gate-wait.mjs | Blocks a run on a dashboard gate (exit 0 approve / 2 reject / 3 timeout) |
| scripts/queue-wait.mjs | Daemon mode: waits for a run request from the dashboard |
| scripts/new-flow.mjs | Scaffolds a new flow file |
| scripts/convert-doc.mjs | The document converter |
Configuration
Per project — <project>/.workbench/settings.json, written by the dashboard:
| Key | Meaning |
|---|---|
| gateMode | Default gate behaviour for this project |
| executorProvider | Which tool is selected |
| refineProvider | auto | acp | cli | http | local for the prompt generator |
| refineApiBase, refineModel, refineApiKey | OpenAI-compatible endpoint for prompt generation. The key is stored server-side and never sent back to the browser |
Environment variables:
| Variable | Effect |
|---|---|
| DEVIN_CLI | Explicit path to the Devin CLI |
| DEVIN_BROWSER / CHROME_PATH | Browser used for PDF rendering |
| FF_PROVIDER_HOME_<ID> | Overrides where a provider is looked for (used by the test suite) |
HTTP API
The dashboard is a plain node:http server; every screen is built on this API, so scripting it is trivial.
| Endpoint | Purpose |
|---|---|
| GET /api/state | Everything the UI polls: run state, stages, gate, flows, projects |
| GET /api/activity · /api/changes · /api/diff | File watcher feed and Git state |
| GET /api/artifact · POST /api/export · GET /api/formats | Read and convert artifacts |
| GET/POST/DELETE /api/flow | Flow CRUD (the list ships inside /api/state) |
| GET/POST/DELETE /api/agent · /api/skill | Role and skill CRUD |
| POST /api/run · POST /api/run/stop · GET /api/run | Start, stop and stream a run |
| POST /api/command | Answer a gate (approve / reject with a note) |
| POST /api/inbox | Send a mid-run instruction to the agent |
| POST /api/refine | Generate or optimise a task statement |
| GET /api/providers · /api/provider · /api/provider-auth · POST /api/provider/login | Executor detection, live login state and login |
| GET /api/models · POST /api/retarget-models · POST /api/retarget-flows | Model catalogue and cross-executor retargeting |
| GET /api/usage · POST /api/estimate · POST /api/usage/report | Real usage from Devin's session log and every other tool, the pre-run forecast, the monthly report |
| GET/POST /api/usage/tracking | Where each tool's numbers come from; switch Cursor / Aider / Copilot recorders on or off |
| GET/POST /api/settings · /api/projects | Settings and the project registry |
Tests
node dashboard\test\run-tests.mjs453 checks, no test framework. The suite spawns its own server on a spare port with a temporary scratch project, and restores your registry afterwards. It covers UI script syntax, complete bilingual i18n key coverage, the Studio's text-free guarantee, the flow↔graph round trip and cycle rejection, every API endpoint, the watcher feed, the gate protocol, provider detection/auth/model mapping, path-traversal guards, and the document converter (real PDF bytes, and .docx/.xlsx opened with Windows' own ZIP reader).
Project layout
FlowForge/
├── agents/              role contracts (thinker, analyst, coder, tester, …)
├── flows/               pipeline definitions (JSON)
├── skills/              chat commands (/flow, /understand, /export, …)
├── scripts/             context, checks, gates, queue, converter
│   ├── lib/platform.mjs  every Windows/macOS/Linux difference, in one file
│   └── lib/             zero-dep pdf / docx / xlsx / html / markdown / zip writers
├── dashboard/
│   ├── server.mjs       the whole HTTP API (node:http only)
│   ├── providers.mjs    executor registry: detection, auth, model catalogues
│   ├── acp-client.mjs   Devin ACP session client
│   ├── ui/index.html    the dashboard (single file)
│   ├── ui/studio.html   the wordless builder
│   └── test/            the 288-check suite
├── docs/index.html       the landing page (GitHub Pages)
├── docs/screenshots/    the images in this README
├── bin/flowforge.mjs     the global CLI
├── get.mjs               the one-command installer
├── install.mjs · uninstall.mjs · start.mjs
Runtime state lives in each target project under .workbench/ — never in this repo.
Design principles
- Zero external dependencies. No npm packages, no lockfile, no supply chain — a test fails the build if an import is not a Node builtin or a local file. Everything, including the installer, is Node builtins.
- No PowerShell script files. Group Policy on the author's machine is
AllSigned, so every executable piece is a.mjsfile — which is also why the installer runs identically on macOS and Linux. - Data over code. Flows, roles and skills are files you can read and edit; the orchestrator interprets them.
- Honest UI. If a state cannot be read, it says unknown — it never guesses on your behalf. Buttons that could only fail are not rendered.
- Your credentials stay yours. Logins run in a real terminal against the vendor's own CLI; the dashboard never handles a token.
- Bilingual by construction. Every user-facing string exists in English and Arabic, enforced by a test.
Troubleshooting
Port 4820 is already in use. Either FlowForge is already running on it (open http://127.0.0.1:4820/), or something else took it: flowforge --port=4830.
The skills do not appear in the chat. Run node install.mjs, then start a new session — skills are read at session start.
devin is not found. Set DEVIN_CLI to the executable path, or make sure it is on PATH. The dashboard shows the resolved path on the Settings tab.
A run is stuck at a gate. Check the gate mode: with terminal the orchestrator waits in the chat window, not in the dashboard. Switch to dashboard in Settings (or pick ai to let the critic decide) and answer from the browser. Runs started from the dashboard over ACP park at the gate and resume from your click; a gate you answered that still shows as waiting belongs to a run that no longer exists — the pipeline panel marks it interrupted and offers Resume from here.
The run stopped and I don't want to start over. Press Resume from here on the Overview (or /flow-resume in the chat): finished stages keep their artifacts, the interrupted stage is redone, a stage that was only waiting for approval is asked again.
Nothing starts although I pressed Run. Look at the Runs tab: the task is probably queued behind a run in the same project, or the parallel cap (FF_MAX_PARALLEL, default 3) is full. A queued item waiting for an executor says so.
PDF export prints ? for Arabic. The builtin PDF writer is Latin-only. Install Edge or Chrome, or set DEVIN_BROWSER — the browser engine handles RTL correctly.
The dashboard shows an old project. Switch it from the picker in the header; the active project is stored per browser.
The Usage tab shows no other tool. Claude Code, Codex, Gemini CLI, OpenCode, Cline, Zed and Antigravity appear as soon as their local records exist; Cursor, Aider and the Copilot CLI only record after you switch them on in the Tracking panel. Windsurf, Kiro and Trae keep usage on their servers — nothing local exists to read.
License
MIT © Mohammed Mustafa