
flowring
v0.1.0
Published
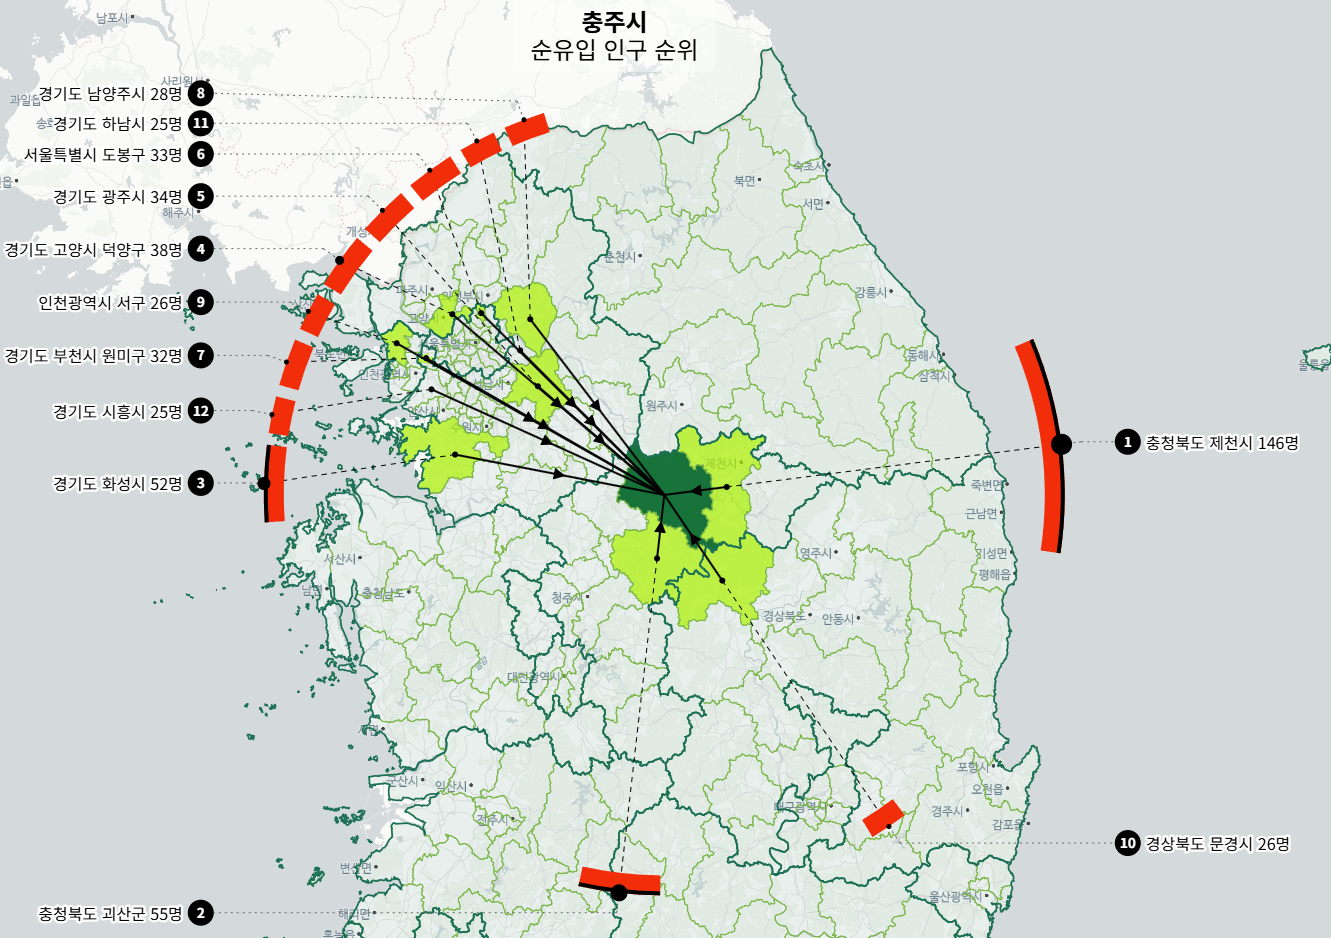
SVG flow visualization with directional arcs, arrows, and ranked labels

Readme
Flowring
SVG flow visualization with directional arcs, arrows, and ranked labels. Works with any map library or standalone in any 2D coordinate space.
Install
npm install flowringQuick Start
import { flowring } from "flowring";

const ring = flowring(document.getElementById("container"), {
  topN: 12,
  direction: "inbound",
  subtitle: "Net Migration Rank",
});

ring.update(
  { id: "seoul", label: "Seoul", coord: [400, 300] },
  [
    { id: "busan", label: "Busan", coord: [700, 400], value: 1200 },
    { id: "daegu", label: "Daegu", coord: [600, 350], value: 800 },
    { id: "incheon", label: "Incheon", coord: [350, 250], value: 650 },
  ]
);
Demo
Full Options Example
import { flowring } from "flowring";

const ring = flowring(document.getElementById("container"), {
  // Data display
  topN: 10,
  total: 50000,
  direction: "outbound",
  subtitle: "Outbound Transfer Rank",

  // Appearance
  radiusFraction: 0.25,
  arcThickness: 16,
  colors: {
    arc: "rgb(30, 120, 220)",
    stroke: "white",
    buffer: "black",
    dim: "#aaaaaa",
    arcByRank: (rank) => (rank < 3 ? "rgb(255, 80, 40)" : "rgb(30, 120, 220)"),
  },

  // Animation
  animate: true,
  blinkCount: 3,
  blinkInterval: 150,

  // Projection (for map usage)
  projection: (coord) => {
    const p = map.project(coord);
    return { x: p.x, y: p.y };
  },

  // Callbacks
  formatLabel: (datum, rank) => `#${rank} ${datum.label} (${datum.value.toLocaleString()})`,
  formatTitle: (source, subtitle) => [source.label, subtitle],
  onRender: (time) => console.log("rendered at", time),
  onBlink: (opacities) => {
    // Sync external elements with blink state
    opacities.forEach((opacity, i) => {
      document.querySelector(`.rank-${i}`)?.style.setProperty("opacity", String(opacity));
    });
  },
});

ring.update(source, data);
map.on("move", () => ring.render());
Use Cases
Vanilla JS with Screen Coordinates
No map needed. Coordinates are [x, y] screen pixels.
import { flowring } from "flowring";

const ring = flowring(document.getElementById("diagram"), {
  topN: 8,
  direction: "outbound",
  subtitle: "Transfer Volume",
  formatLabel: (d, rank) => `${d.label}: ${d.value}%`,
});

ring.update(
  { id: "hq", label: "Headquarters", coord: [400, 300] },
  [
    { id: "east", label: "East Region", coord: [700, 200], value: 340 },
    { id: "west", label: "West Region", coord: [100, 200], value: 280 },
    { id: "south", label: "South Region", coord: [400, 550], value: 150 },
  ]
);
Vanilla JS with MapLibre
Provide a projection callback to convert [lon, lat] to screen pixels.
import { flowring } from "flowring";

const ring = flowring(overlayDiv, {
  projection: (coord) => {
    const p = map.project(coord);
    return { x: p.x, y: p.y };
  },
  direction: "inbound",
  animate: true,
  blinkCount: 3,
});

// Re-render on map movement
map.on("move", () => ring.render());

// Update on hover
ring.update(source, rankedData);

// Cleanup
ring.destroy();
React with MapLibre
Use FlowringIndicator component and useFlowring hook.
import { FlowringIndicator, useFlowring } from "flowring/react";
import { getBlinkOpacity } from "flowring";

function MyMap() {
  const mapRef = useRef(null);
  const { blinkTime, resetBlink } = useFlowring();

  useEffect(() => {
    resetBlink();
  }, [selectedRegion, resetBlink]);

  return (
    <Map ref={mapRef}>
      {selectedRegion && (
        <FlowringIndicator
          mapRef={mapRef}
          source={{
            id: region.code,
            label: region.name,
            coord: [center.lon, center.lat],
          }}
          data={filteredData.map((r) => ({
            id: r.id,
            label: r.name,
            coord: [r.lon, r.lat],
            value: r.count,
          }))}
          blinkTime={blinkTime}
          total={allData.reduce((s, r) => s + r.count, 0)}
          direction="inbound"
          subtitle="Net Migration Rank"
          animate={true}
          blinkCount={3}
          formatLabel={(d, rank) => `${d.label} ${d.value.toLocaleString()}`}
        />
      )}
    </Map>
  );
}
Highlighting Ranked Regions on Map (deck.gl)
Flowring draws the SVG overlay, but coloring regions on the map is up to you. Here's how to highlight the top ranked regions using deck.gl's GeoJsonLayer:
// Basic: highlight top 10 regions with a static color
new GeoJsonLayer({
  id: "region-highlight",
  data: geojson,
  filled: true,
  stroked: false,
  pickable: true,
  getFillColor: (d) => {
    const code = Number(d.properties.code);
    // Green for the hovered source region
    if (code === selectedRegionCode) return [23, 115, 58, 255];
    // Yellow-green for ranked counterparts
    if (rankMap.has(code)) return [174, 242, 2, 180];
    // Transparent for the rest
    return [0, 0, 0, 0];
  },
  updateTriggers: { getFillColor: [selectedRegionCode, rankMap] },
});
Syncing Blink Animation with Map Layer
When animate: true, the top ranks blink in the SVG overlay.
Use getBlinkOpacity to synchronize map fill colors with the same timing:
import { getBlinkOpacity } from "flowring";

new GeoJsonLayer({
  id: "region-highlight",
  data: geojson,
  filled: true,
  getFillColor: (d) => {
    const code = Number(d.properties.code);
    if (code === selectedRegionCode) return [23, 115, 58, 255];
    const rankIdx = rankMap.get(code);
    if (rankIdx !== undefined) {
      // Top 3 blink in sync with the SVG overlay
      const opacity = rankIdx < 3 ? getBlinkOpacity(blinkTime, rankIdx) : 1;
      return [174, 242, 2, 180 * opacity];
    }
    return [0, 0, 0, 0];
  },
  updateTriggers: { getFillColor: [selectedRegionCode, rankMap, blinkTime] },
});
API Reference
flowring(container, options?)
Creates a flowring instance.
Returns: FlowringInstance
FlowringOptions
| Option | Type | Default | Description |
|--------|------|---------|-------------|
| topN | number | 12 | Max ranked items to display |
| blinkCount | number | 3 | How many top ranks blink |
| direction | "inbound" \| "outbound" | "inbound" | Arrow direction |
| subtitle | string | "" | Second line of title |
| colors | FlowringColors | see below | Color overrides |
| projection | ProjectionFn | undefined | Coordinate-to-pixel projection |
| radiusFraction | number | 0.3 | Donut radius as fraction of viewport |
| arcThickness | number | 20 | Arc thickness in px |
| total | number | sum of data | Grand total for ratio calc (prevents arcs filling 360°) |
| animate | boolean | false | Enable blink animation |
| blinkInterval | number | 150 | Blink tick interval (ms) |
| formatLabel | (datum, rank) => string | "label value" | Custom label formatter |
| formatTitle | (source, subtitle) => string[] | auto | Custom title formatter |
| onRender | (time) => void | - | Called after each render |
| onBlink | (opacities) => void | - | Called on blink tick |
FlowringColors
| Key | Default | Description |
|-----|---------|-------------|
| arc | "rgb(242, 45, 10)" | Donut arc fill |
| stroke | "black" | Lines, arrows, rank circles |
| buffer | "white" | Text halo |
| dim | "#666666" | Leader lines |
| arcByRank | - | (rankIndex) => string per-rank override |
FlowringInstance
| Method | Description |
|--------|-------------|
| update(source, data) | Set source + data, triggers render |
| setOptions(opts) | Partial merge options, triggers render |
| render() | Manual render (map pan/zoom) |
| renderAt(time) | Render at specific blink time |
| svg() | Get SVG element |
| resize() | Resize SVG to container |
| destroy() | Stop timers, remove SVG |
FlowringSource
{ id: string | number; label: string; coord: [number, number] }FlowringDatum
{ id: string | number; label: string; coord: [number, number]; value: number }Blink Animation
Blink is off by default. Enable with animate: true.
When enabled, the top blinkCount ranks (default 3) get a synchronized blink + bounce animation with a 6-second cycle.
For external sync (e.g., deck.gl fill colors), import getBlinkOpacity:
import { getBlinkOpacity, BLINK_CYCLE, BLINK_DELAYS } from "flowring";

// Returns 0 or 1
const opacity = getBlinkOpacity(elapsedSeconds, rankIndex);
License
MIT