
gantt-renderer
v0.12.25
Published
A TypeScript Gantt chart renderer for precalculated project plans

Maintainers
 doberkofler
Readme
gantt-renderer




Live Demo → | Usage Guide → | API Docs → | Contributing →
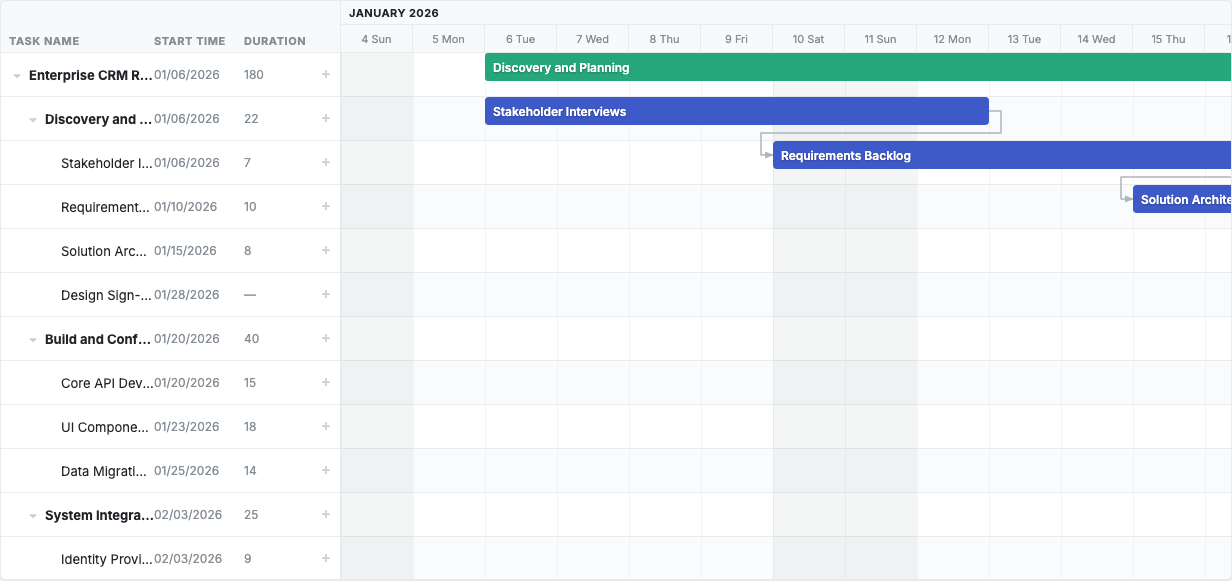
A TypeScript Gantt chart renderer for precalculated project plans.
This package is focused on visualization and interaction: it renders tasks, timelines, and dependencies, and provides UX hooks for user actions. It does not compute schedules, optimize timelines, resolve resource constraints, or perform planning logic itself.
Purpose
- Render already-planned project data in a clear, interactive timeline UI.
- Capture user interactions (select, move, resize, double-click) and hand them back to your app.
- Let your backend or planning engine stay the source of truth for all project calculations.
Scope
The library is designed as a core chart component (src/lib/**/*) that your product can
embed. Outer-page/demo concerns (export toolbars, fullscreen shell controls, demo-only control
rows) are intentionally outside the core scope.
Includes:
- Chart/grid rendering, task bars, timeline header, dependency links.
- Selection, drag/resize UX, and responsive split-pane behavior.
- Tree-based task hierarchy with expand/collapse support.
- Timeline scales:
hour,day,week,month,quarter,year. - Special-day rendering API for weekends, holidays, and custom day semantics in
dayscale. - Drag and resize interactions with callback hooks.
- Dependency validation and link path routing.
- Input validation with
zodschemas. - Unit tests with Vitest and integration tests with Playwright.
Does not include:
- Automatic project scheduling.
- Critical path or resource leveling calculations.
- Date recalculation across dependent tasks.
- Business-rule planning decisions.
- Built-in outer toolbars, export implementations, fullscreen shell behavior, demo-only control strips.
Those planning concerns should be handled upstream, then passed into this renderer as GanttInput.
Quick Start
npm install gantt-rendererimport {GanttChart} from 'gantt-renderer';
import 'gantt-renderer/styles/gantt.css';
const instance = new GanttChart(document.getElementById('chart')!, {
scale: 'day',
});
instance.update(yourData);Integration Pattern
- Compute/plan project data in your domain layer or backend.
- Pass it directly to
instance.update(yourData)— the chart validates and renders in one call. - Render with
new GanttChart(container, options)followed byinstance.update(input)and react to interaction callbacks. - Persist user edits through your own business logic, then update with
instance.update(newInput).
Package Exports
gantt-renderer— ESM bundle with all types and utilities.gantt-renderer/styles/gantt.css— Core chart stylesheet.
Further Reading
- Usage Guide — All constructor options: locale, theme, grid schema, CSS tokens, link creation, special days, density constants, and more.
- API Documentation — TypeDoc-generated API reference.
- Contributing — Dev setup, scripts, demo verification, and code conventions.