
git-graph-svg
v2.0.5
Published
Lightweight SVG-based Git commit graph renderer for React with automatic branch layout.
Maintainers
 akshayrajput
Readme
GitGraphSVG
A lightweight, customizable SVG-based Git commit graph renderer for React.
git-graph-svg renders a Git-style commit history with branching and merging support, automatic lane allocation, and fully customizable node and edge rendering.
Built for flexibility, performance, and zero dependencies.
✨ Features
- 🔀 Automatic branch lane management
- 🎨 Customizable branch color palettes
- 🧩 Fully customizable node and edge rendering
- 📐 Pure SVG rendering (no canvas)
- ⚡ Lightweight & dependency-free
- 🌿 Supports complex branch & merge histories
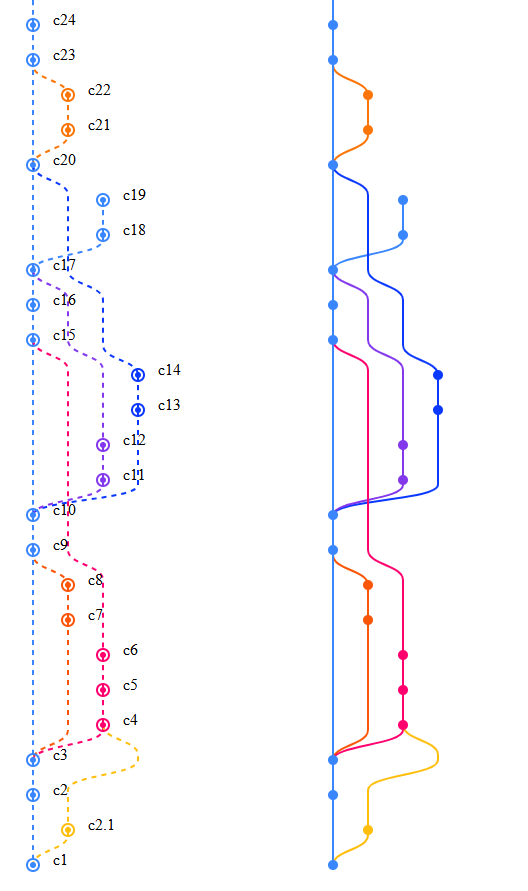
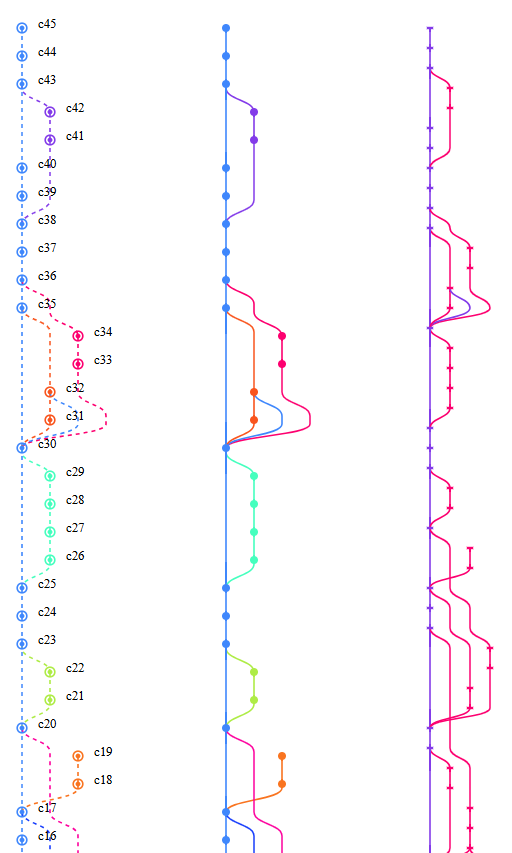
📐 Screenshots
📦 Installation
npm install git-graph-svgor
yarn add git-graph-svg🚀 Basic Usage
import { GitGraph, type ICommitItem } from "git-graph-svg";

const commits: ICommitItem[] = [
  {
    id: "a1",
    message: "Initial commit",
    author: "Akshay",
    date: "2026-02-18T09:12:45",
    parents: [],
  },
  {
    id: "b2",
    message: "Add feature",
    author: "Akshay",
    date: "2026-02-18T10:30:12",
    parents: ["a1"],
  },
];

export default function App() {
  return <GitGraph commits={commits} />;
}
📘 Commit Data Model
export interface ICommitItem {
    id: string;
    message: string;
    author: string;
    date: string;
    parents: string[];
    meta?: any;
}
Each commit references its parent commit IDs in the parents array.
⚙️ Component Props
interface GitGraphProps {
    commits: ICommitItem[];
    colorPalette?: string[];
    padding?: {
        left: number;
        right: number;
        bottom: number;
        top: number;
    } | number;
    rowHeight?: number;
    laneWidth?: number;
    style?: React.CSSProperties;
    renderNode?: (x: number, y: number, color: string, commit: ICommitItem) => ReactNode;
    renderEdge?: (from: ICommitItem, to: ICommitItem, d: string, color: string) => ReactNode;
    getMergeCurve?: (x1: number, y1: number, x2: number, y2: number) => string;
    getBranchSplitCurve?: (x1: number, y1: number, x2: number, y2: number) => string;
}
🎨 Custom Rendering
The graph engine handles layout and branch logic, while you control how nodes and edges are rendered.
Custom Node Rendering
<GitGraph
  commits={commits}
  renderNode={(x, y, color, commit) => (
    <g key={commit.id}>
      <circle cx={x} cy={y} r={3} fill={color} />

      <circle
        cx={x}
        cy={y}
        r={6}
        fill="none"
        stroke={color}
        strokeWidth={2}
      />

      <text x={x + 20} y={y}>
        {commit.id}
      </text>
    </g>
  )}
/>
Custom Edge Rendering
<GitGraph
  commits={commits}
  renderEdge={(from, to, path, color) => (
    <path
      key={`${from.id}-${to.id}`}
      d={path}
      stroke={color}
      strokeWidth={2}
      fill="none"
      strokeDasharray="5,5"
    />
  )}
/>
🎨 Custom Color Palette
<GitGraph
  commits={commits}
  colorPalette={[
    "#8338ec",
    "#ff006e",
    "#fb5607",
    "#ffbe0b"
  ]}
/>
If the number of active branches exceeds the palette size, additional colors are generated automatically.
🧪 Example: Multiple Graph Styles
import { useMemo } from "react";
import { GitGraph, type ICommitItem } from "git-graph-svg";
import { heavyCommitDataset } from "./type";

function App() {
  const commits = useMemo(
    () =>
      heavyCommitDataset.sort(
        (a: any, b: any) =>
          new Date(b.date).getTime() - new Date(a.date).getTime()
      ),
    [heavyCommitDataset]
  );

  return (
    <div style={{ display: "flex" }}>

      {/* Graph with custom nodes and dashed edges */}
      <GitGraph
        commits={commits}
        rowHeight={25}
        laneWidth={25}
        renderNode={(x, y, color, commit) => (
          <g key={commit.id}>
            <circle cx={x} cy={y} r={3} fill={color} />
            <circle
              cx={x}
              cy={y}
              r={6}
              fill="none"
              stroke={color}
              strokeWidth={2}
            />
            <text x={x + 20} y={y}>
              {commit.id}
            </text>
          </g>
        )}
        renderEdge={(from, to, d, color) => (
          <path
            key={`${from.id}-${to.id}`}
            d={d}
            stroke={color}
            strokeWidth={2}
            fill="none"
            strokeDasharray="5,5"
          />
        )}
      />

      {/* Default graph */}
      <GitGraph commits={commits} rowHeight={35} laneWidth={35} />


    </div>
  );
}

export default App;
📏 Layout Rules
| Property | Description |
| --------- | ----------------------------------- |
| rowHeight | Vertical spacing between commits |
| laneWidth | Horizontal spacing between branches |
| width | laneCount * laneWidth |
| height | commitCount * rowHeight |
🔄 Branch & Merge Handling
The engine automatically handles:
- Branch creation
- Branch merging
- Lane reuse when branches end
- Multiple parent commits
- Smooth lane transitions
Rendering rules:
- Straight lines when commits stay in the same lane
- Smooth curves when switching lanes
- Colors follow branch lineage
🧠 Design Philosophy
git-graph-svg is designed as a rendering engine, not a UI component.
It handles:
- commit layout
- lane allocation
- edge path generation
- color management
You control the visual layer.
This makes it easy to integrate with:
- Git visualizers
- CI/CD dashboards
- repository browsers
- build pipeline UIs
🚀 Future Enhancements
Possible upcoming improvements:
- animations
- hover tooltips
- zoom & pan
- horizontal layout support
- commit grouping
- performance optimizations for large repositories
- interactive branch highlighting
📜 License
MIT