
gitnebula
v0.2.0
Published
Turn any git repository into an interactive architecture map. One command, no config, fully offline.

Maintainers
 jundymek
Readme
gitnebula
You have just cloned a repository you have never seen. Where do you start reading?
gitnebula answers that question from the repository itself — one command, no
configuration, fully offline. It reads the file tree, parses the imports and
replays git log, then opens a map that leads with a reading order instead of
an inventory: what the codebase is built around, where it is entered, and which
files keep changing together.
Quickstart
npx gitnebulaRun it inside a git repository. gitnebula scans the tree, parses imports, reads
git log, writes analysis.json and opens the map in your browser:
▸ repo
✔ repo (0.03s)
▸ config
✔ config (0.00s)
▸ scan
✔ scan (0.08s)
▸ deps
▸ githist
✔ githist (0.06s)
✔ deps (0.18s)
▸ assemble
✔ assemble (0.00s)
▸ enrich
✔ enrich (0.00s)
▸ emit
✔ emit (0.00s)
  ! scan: data-blob ×1 (e.g. packages/contract/fixtures/synthetic-100x2000.json)
  ! deps: external-import ×352 (e.g. @eslint/js in eslint.config.js)
  ! githist: path-outside-universe ×275 (e.g. docs/assets/demo.gif)
  ! githist: bulk-commit-skipped ×1 (e.g. 72fea57aecbe074667ec01c7d7cb95ec9bc242a1)
analysis.json — 409 nodes, 493 edges, 186 co-change pairs, history over the last 90 days (--window-days), in 0.28s
serving http://127.0.0.1:4137/ — press Ctrl+C to stop
That is a real run of gitnebula over a fresh clone of its own repository, with only the machine-specific path prefix trimmed off the summary line. The warning block is whole: the analyzers print one line per kind of thing they skipped, each with a count and an example, so anything left off the map is reported rather than merely absent. What appears there depends on the repository — an import that resolves outside it, a generated data blob, a file that cannot be read as text, a commit too large to attribute — and that block, not this page, is the authority on what a given run did. If port 4137 is busy the server takes the next free one and prints the URL it actually bound.
There is nothing to sign up for, nothing to configure and no API key. Your code never leaves the machine.
Useful flags:
npx gitnebula ../some/other/repo      # analyze a different checkout
npx gitnebula https://github.com/…    # clone into a temp dir and analyze that
npx gitnebula --no-serve              # just write analysis.json
npx gitnebula --no-open               # serve, but do not open a browser
npx gitnebula --window-days 365       # widen the git history window (default 90)
Optional .gitnebula.yml in the repository root sets excludes, windowDays,
hotspotThreshold and layers; command-line flags win over the file.
What the map leaves out
Dependency trees, build output, lockfiles, test snapshots and binary assets are excluded by default — machine-written files that are enormous and say nothing about architecture.
One rule goes by shape rather than by name, because generated files are not
named predictably: a data document (.json, .yml, .toml, .ini, .xml)
longer than 5,000 lines is treated as a generated blob and left off the map.
Source is never dropped, however long it is, and a data file below that size
stays — package.json and a CI workflow are configuration a reader recognizes.
The threshold is far above anything maintained by hand: in this repository the
largest hand-written data file is 229 lines and the largest source file 1,694,
while the generated performance fixture that prompted the rule is 40,655.
Nothing disappears silently. Every drop is counted and named in the run summary, so a file left off the map is reported rather than merely absent:
! scan: data-blob ×1 (e.g. packages/contract/fixtures/synthetic-100x2000.json)npx fetches the published package, so there is nothing to install and nothing
left behind. To keep it around, npm install -g gitnebula and run gitnebula.
Node.js ≥ 20.19 is the only requirement; git is read through the git already
on your PATH.
The first five minutes
The map opens on an answer. Once the layout settles, a start-here panel names a reading order in three categories, computed from the graph alone:
| category | what it holds | | -------------------------- | ---------------------------------------------------------------- | | core | the code the rest of the repository leans on — importers × lines | | entry points | files nobody imports that import plenty — the doors | | tests as documentation | the test files that exercise the most of the codebase |
Core multiplies the two numbers on purpose. Ranking by importers alone promotes
whatever everything happens to touch: on this repository most of the five slots
went to small, ubiquitous files — a test-fixture helper, an error enum, a
re-export barrel — while the seventeen-hundred-line engine that actually
answers "what does this do" fell outside the list entirely. A file worth
reading first is one a lot of code depends on and that has something in it,
so each row shows both numbers, e.g. 14 importers · 1,694 lines.
Pick a row and the camera flies to that file and opens its panel. Dismiss the
panel to explore on your own; ◎ start here in the header brings it back
without reloading anything.
A node's panel is the history the import graph cannot give you. Lines of
code and the file's imports come from static analysis; churn, authors and last
change come from git log, and every one of those rows states the window it
covers — history · last 90 days, or whatever --window-days you asked for.
A file nobody has touched inside that window says "no change in last 90
days" rather than a bare 0, so a quiet file never reads as a broken tool.
And what tends to change alongside it. Below the history rows, a blast
radius section lists the files this one has repeatedly been committed with,
and how many commits they share. This is the part no import parser can tell
you: in this repository chrome/chrome.ts and styles.css keep changing
together and there is no import between them, because a stylesheet is not an
import. show on map marks that set on the canvas — a mark on those nodes, not
a line between them, because co-change is not a dependency. Most files have no
partners at all — around 85% of the files in this repository — so the section names its cause rather than
showing an empty box, and points at --window-days as the lever.
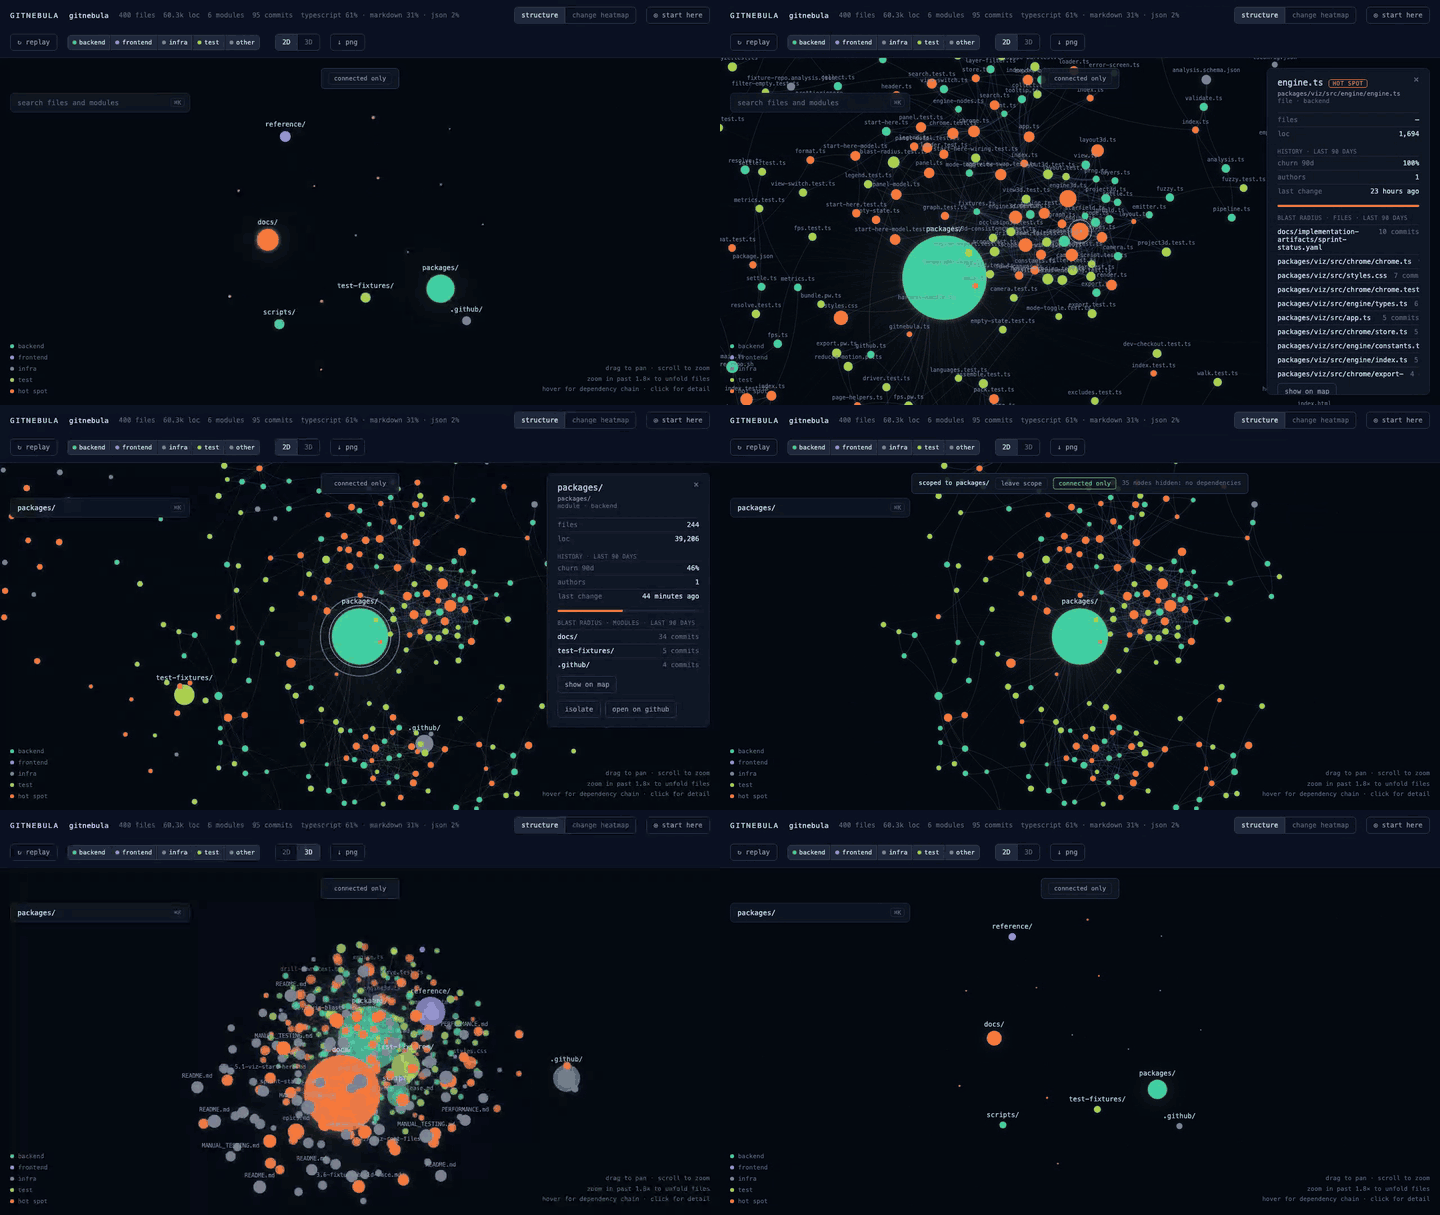
Then narrow the map. Three levers, each of which removes nodes rather than restyling them, so what is left is genuinely all there is to click:
- Drill down — double-click a module to scope the map to it: the module,
its files, and the modules it actually imports or is imported by.
Escapeleaves the scope, and the scope bar tells you where you are the whole time. - Connected only — hide files that carry no import edge at all. That is nearly half the files in this repository, and 232 of the 650 on the langgraph checkout this behaviour was measured against.
- Layer filter — five toggles for
backend,frontend,infra,testandother. Switchtestoff and the tests leave the frame; switch it back on and they return exactly where they were, because filtering never re-runs the layout.
Whatever is hidden is stated, with its cause, rather than silently dropped.
Hover traces a dependency chain without extinguishing the map. The hovered node and its one-hop chain brighten and gain a ring, and everything else settles back a little instead of going dark — a dense repository stays readable while the pointer moves across it.
What else it gives you
- Modules and files as one map. Directories become modules; zoom past 1.8× and a module unfolds into its files. Node size is ∝ √LOC, colour is the detected layer. Files in the repository root are drawn too, not swallowed.
- Real dependency edges. Imports parsed from JavaScript, TypeScript and Python — not guessed from filenames.
- Hot spots you can see. Files above the churn threshold pulse; the heatmap view mode recolours the whole map by churn instead of by layer, and says so when a repository is quiet enough that the heatmap is nearly uniform.
- Search that flies. ⌘K, type, pick — the camera flies to the node and opens its panel with the metrics and a link to the file on GitHub. A result outside the current scope leaves the scope rather than refusing to go there, and offers you the way back.
- A 3D view of the same graph.
3Din the header swaps the map for a three-axis layout of the sameanalysis.json, where depth separates clusters that overlap in the plane: drag to rotate, shift-drag to pan, and the same click, drill-down andEscapeas in 2D.?view=3dlinks straight to it. There is no WebGL and no 3D library behind it — it is a perspective projection onto the same canvas, which is why a whole second renderer costs about 5 KB gzipped. 2D stays the default, and stays the faster of the two: 3D is smooth on the module-level map and slows down once a large repository is fully unfolded (measured: it holds 55 fps to roughly 840 drawn nodes). Where 3D cannot start, the map stays 2D and tells you why. - PNG export. A 2× re-render of exactly what is on screen — camera, mode, highlight and filters included — for slides and issues.
- Deterministic and offline. The same repository at the same commit produces
a byte-identical
analysis.json. No telemetry, no network calls in the analysis path, no backend — the viewer is a static page reading one JSON file.
Requirements: Node.js ≥ 20.19 and a git repository. Python and JS/TS are the supported languages in this release.
A static bundle you can host
npx gitnebula build                   # → ./gitnebula-bundle/
npx gitnebula build -o ./site         # → ./site/
gitnebula build writes exactly two files into the output directory —
index.html, with the whole viewer inlined, and analysis.json — and nothing
else. The viewer carries its own JS and CSS and makes no external request; it
reads analysis.json from beside itself. Copy the directory to any static
host — there is no build step on the other side and nothing to run server-side.
(Serve it over HTTP rather than opening index.html off disk: the viewer
fetches its sibling analysis.json, which browsers block on file://.)
The map of gitnebula itself
Live map — link pending: gitnebula publishes a map of its own repository to GitHub Pages, regenerated by the project's own CI. The URL lands here as soon as the Pages workflow is live.
Running it from a clone
To try a change, or to read the sources:
pnpm install
pnpm build
node packages/cli/dist/bin/gitnebula.js .
See CONTRIBUTING.md for the rest of the development setup.
Contributing
Setup, the commands that must pass, and the commit conventions are in CONTRIBUTING.md. How the demo above was recorded — and how to re-record it for the next version — is in docs/recording-demo.md.
The same checks run in
CI — ESLint
and Prettier, tsc --noEmit and the full vitest suite of every package on
Node 20, plus the static bundle's size budget. It is workflow_dispatch-only
for now: verification runs locally during implementation, and wiring it to
push and pull requests is what story 4.2 revisits.
License
MIT © gitnebula contributors.