
gralobe
v1.0.73
Published
Interactive 3D globe visualization with statistics, smooth flat map ↔ globe transitions, and country labels
Maintainers
 batikanor
Readme
Gralobe
Open-source NPM package for beautiful 3D globe visualizations
Created as part of a submission to TechArena Finland Hackathon. This is a community contribution we're committed to maintaining and improving!
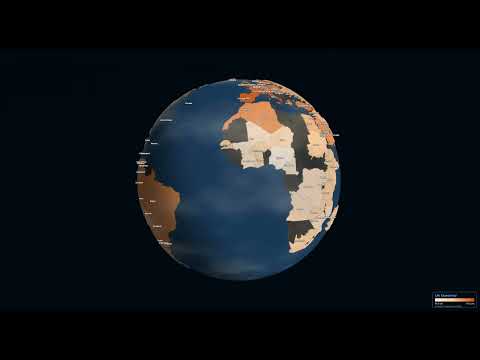
Interactive 3D globe visualization with world statistics, smooth flat map ↔ globe transitions, and country labels. Nothing like this existed before - and it's 100% useful for data visualization, dashboards, and educational projects!

![]()

Features
- Smooth morphing animation between flat (Mercator) map and 3D globe
- Built-in world statistics (Life Expectancy, GDP, CO2 Emissions, etc.)
- Country labels with multiple display styles
- NASA Blue Marble and other texture presets
- Visual effects (clouds, atmosphere, grid lines, etc.)
- Screenshot and video/GIF recording
- Height extrusion based on data values
- Fully typed TypeScript API
Live Demo
🌐 Try it live at gralobe.vercel.app - A fully configurable version where you can explore different datasets, textures, and visual effects!
Installation
npm install gralobe threeQuick Start
import { GlobeViz } from 'gralobe';

// Create a globe with default settings
const globe = new GlobeViz('#container');
The default configuration displays:
- NASA Blue Marble satellite texture
- All country labels
- Life Expectancy statistic
- Globe view (morphed to sphere)
Configuration
import { GlobeViz } from 'gralobe';

const globe = new GlobeViz('#container', {
  // Earth texture: 'satellite' | 'natural' | 'dark' | 'light' | 'night' | 'topographic' | 'day' | 'bathymetry' | 'atlas'
  texture: 'satellite',

  // Label style: 'none' | 'minimal' | 'major' | 'all' | 'data'
  labels: 'data',

  // Initial statistic to display (built-in ID or custom StatisticData)
  statistic: 'lifeExpectancy',

  // Initial view: 'globe' or 'flat'
  initialView: 'globe',

  // Enable auto-rotation
  autoRotate: false,

  // Show control panel (lil-gui) - Now a modular Category Bar in top-right
  showControls: true,

  // Show legend
  showLegend: true,

  // Enable 3D height extrusion based on data values
  extrudeHeight: false,

  // Visual effects
  effects: {
    atmosphereIntensity: 0.5,
    clouds: true,
    cloudSpeed: 1.0,
    cloudOpacity: 0.6,
    gridLines: false,
    starTwinkle: true,
  },

  // Callbacks
  onCountryClick: (id, name, value) => {
    console.log(`Clicked: ${name} (${id}) = ${value}`);
  },
  onViewChange: (view, morph) => {
    console.log(`View: ${view}, Morph: ${morph}`);
  },
});
API
View Control
// Animate to globe view
globe.toGlobe();

// Animate to flat map view
globe.toFlat();

// Set morph value directly (0 = flat, 1 = globe)
globe.setMorph(0.5);

// Get current morph value
const morph = globe.getMorph();
Statistics
// Change to a built-in statistic
globe.setStatistic('gdpPerCapita');

// Available built-in statistics:
// - lifeExpectancy
// - humanDevIndex
// - gdpPerCapita
// - co2Emissions
// - renewableEnergy
// - internetUsers
// - urbanPopulation
// - healthExpenditure
// - forestArea
// - population
// - accessElectricity
// - educationExpenditure
Labels
// Change label style
globe.setLabels('major'); // 'none' | 'minimal' | 'major' | 'all' | 'data'
Texture
// Change earth texture
await globe.setTexture('night');
Available texture presets:
satellite,natural,daydark,light,nighttopographic,bathymetryatlas(political boundary map; pair with labels for names)
Effects
// Update visual effects
globe.setEffects({
  clouds: true,
  cloudSpeed: 1.5,
  atmosphereIntensity: 0.8,
  gridLines: true,
});
Export
// Take a screenshot
globe.screenshot({ filename: 'globe.png' });

// Record a GIF
await globe.recordGif({ duration: 5, fps: 30 });

// Record a video
await globe.recordVideo({ duration: 10 });
Urban Data (Points)
Visualize city-level or point-based data with synthetic boundaries.
globe.setUrbanData([
  { lat: 40.7128, lon: -74.0060, value: 100, name: "New York" },
  { lat: 35.6762, lon: 139.6503, value: 85, name: "Tokyo" },
]);
Other
// Enable/disable auto-rotation
globe.setAutoRotate(true);

// Resize
globe.resize(800, 600);

// Clean up
globe.destroy();
Built-in Statistics
| ID | Name | Unit |
|----|------|------|
| lifeExpectancy | Life Expectancy | years |
| humanDevIndex | Human Development Index | - |
| gdpPerCapita | GDP per Capita (PPP) | $ |
| co2Emissions | CO2 Emissions | t/capita |
| renewableEnergy | Renewable Energy | % |
| internetUsers | Internet Penetration | % |
| urbanPopulation | Urbanization | % |
| healthExpenditure | Health Spending | % GDP |
| forestArea | Forest Coverage | % |
| population | Population | millions |
| accessElectricity | Electricity Access | % |
| educationExpenditure | Education Spending | % GDP |
Custom Statistics
You can provide your own statistics data:
import type { StatisticData } from 'gralobe';

const customStat: StatisticData = {
  definition: {
    id: 'myStatistic',
    name: 'My Custom Statistic',
    unit: '%',
    description: 'Description of my statistic',
    colorScale: ['#feedde', '#fdbe85', '#d94701'],
    domain: [0, 100],
    format: (v) => `${v.toFixed(1)}%`,
  },
  values: {
    'US': 75.5,      // ISO alpha-2
    'Germany': 42.3, // Country name
    'CHN': 60.0,     // ISO alpha-3
    '826': 55.0,     // ISO numeric
  },
};

globe.setStatistic(customStat);
Supported Country Code Formats
Gralobe accepts multiple country identifier formats:
| Format | Example | Description |
|--------|---------|-------------|
| ISO 3166-1 alpha-2 | US, DE, TR | 2-letter country codes |
| ISO 3166-1 alpha-3 | USA, DEU, TUR | 3-letter country codes |
| ISO 3166-1 numeric | 840, 276, 792 | 3-digit numeric codes |
| Country name | Germany, Turkey | Common English names |
All formats are automatically normalized internally.
TypeScript Types
import type {
  GlobeVizConfig,
  GlobeVizAPI,
  StatisticDefinition,
  StatisticData,
  CountryData,
  TexturePreset,
  LabelStyle,
  EffectsConfig,
  ExportOptions,
} from 'gralobe';
Development
# Install dependencies
npm install

# Run development server
npm run dev

# Build library
npm run build:lib

# Build demo app
npm run build
Z-Index Layering
Gralobe constrains all UI elements to z-index range 5-99 for predictable layering:
| Z-Index | Element | |---------|---------| | 5 | Country labels | | 10 | Legend | | 50 | Toolbar (bottom-right buttons) | | 60 | Hover tooltips | | 70 | lil-gui control panels | | 80 | Data grid overlay | | 90 | Category bar | | 95 | GUI toggle button | | 99 | Peak tooltips |
For host applications: Use z-index 100+ for any UI that must appear above gralobe controls (navbars, modals, install prompts, etc.).
Browser Support
Gralobe requires WebGL support. It works in all modern browsers:
- Chrome 80+
- Firefox 75+
- Safari 14+
- Edge 80+
Dependencies
License
MIT