
graphviz-html
v1.0.0
Published
Graphviz viewer and Editor in HTML
Maintainers
 mohanchinnappan
Readme
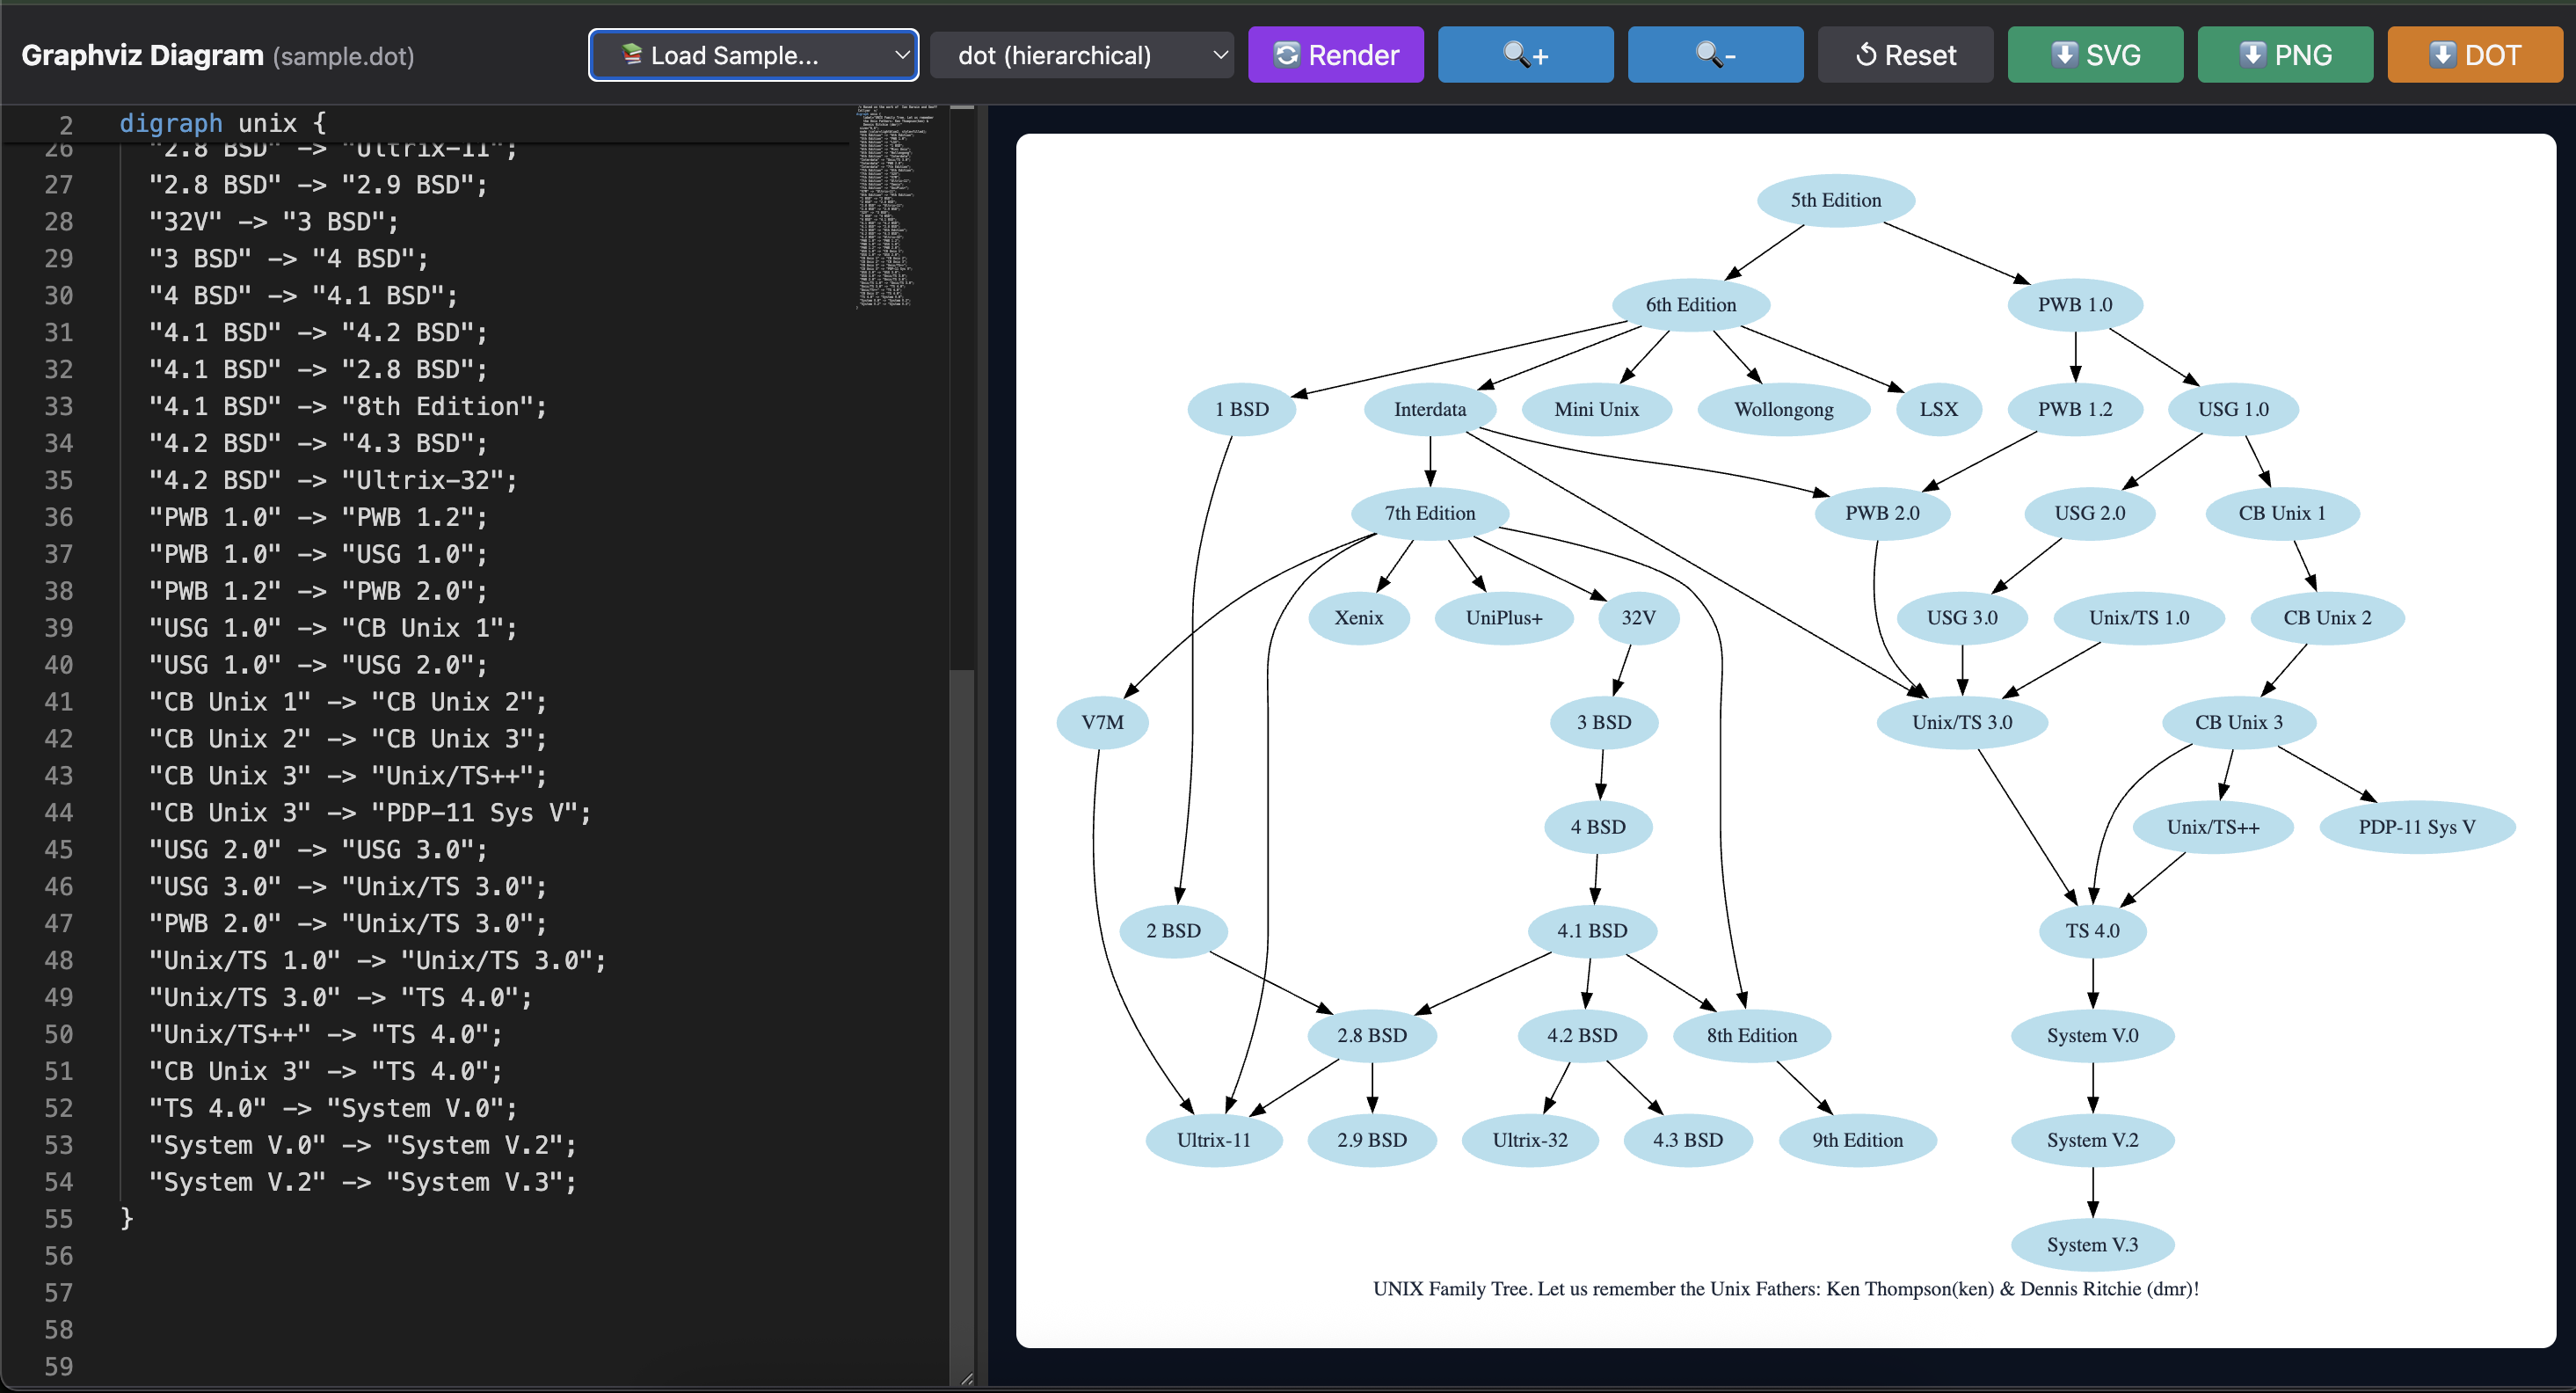
📊 graphviz-html
Interactive Graphviz Editor & Viewer - Generate beautiful, editable HTML visualizations from Graphviz DOT files with live preview, multiple layouts, and export capabilities.
![]()
✨ Features
- 🎨 Monaco Editor Integration - Full-featured code editor with syntax highlighting for DOT language
- 🔄 Live Preview - Auto-render with debouncing (800ms) as you type
- 🎯 Multiple Layout Engines - dot, neato, fdp, circo, twopi, osage
- 📚 Sample Library - Pre-loaded examples (git workflows, org charts, process flows, etc.)
- 💾 Multiple Export Formats - Download as SVG, PNG, or DOT source
- 🔍 Zoom Controls - Zoom in/out with smooth scaling
- 🎭 Dark Theme - Beautiful dark UI with Tailwind CSS
- ⌨️ Keyboard Shortcuts - Fast workflow with hotkeys
- 📱 Responsive Design - Resizable split panes with draggable splitter
- 📊 Real-time Statistics - Node/edge count and render time display
Screenshoot
🚀 Installation
npm install -g graphviz-htmlOr use with npx (no installation required):
npx graphviz-html -f diagram.dot📖 Usage
Basic Usage
graphviz-html -f diagram.dotThis generates graphviz-diagram.html in the current directory.
Custom Output and Options
graphviz-html -f input.gv -o output.html -t "My Diagram" -l neato --openCommand Line Options
| Option | Description | Default |
|--------|-------------|---------|
| -f, --file <path> | Graphviz source file (.dot, .gv) | Required |
| -o, --out-html <path> | Output HTML file path | graphviz-diagram.html |
| -t, --title <text> | HTML page title | Graphviz Diagram |
| -l, --layout <engine> | Layout engine to use | dot |
| --open | Open generated HTML in browser | false |
Layout Engines
| Engine | Best For | Description |
|--------|----------|-------------|
| dot | Hierarchies, flowcharts | Hierarchical layouts (top-to-bottom) |
| neato | Relationships, networks | Spring model layouts |
| fdp | Large graphs | Force-directed placement |
| circo | Cycles, circular patterns | Circular layouts |
| twopi | Radial structures | Radial tree layouts |
| osage | Clusters, groups | Clustered layouts |
📝 Examples
Example 1: Simple Workflow
graphviz-html -f workflow.dot -t "Deployment Workflow"workflow.dot:
digraph Workflow {
    rankdir=LR;
    node [shape=box, style=filled, fillcolor=lightblue];

    Dev -> Test -> Stage -> Prod;
    Test -> Dev [label="failed"];
    Stage -> Test [label="rollback"];
}
Example 2: Organizational Chart
graphviz-html -f org.dot -l dot -t "Company Structure" --openorg.dot:
digraph OrgChart {
    node [shape=box, style="rounded,filled", fillcolor=lightgray];

    CEO -> CTO;
    CEO -> CFO;
    CEO -> CMO;
    CTO -> DevLead;
    CTO -> QALead;
}
Example 3: Network Topology
graphviz-html -f network.dot -l neato -o network-map.htmlnetwork.dot:
graph Network {
    layout=neato;
    node [shape=circle];

    Router -- {Switch1 Switch2 Switch3};
    Switch1 -- {PC1 PC2 PC3};
    Switch2 -- {Server1 Server2};
}
⌨️ Keyboard Shortcuts
Once the HTML is generated and opened:
| Shortcut | Action |
|----------|--------|
| Ctrl/Cmd + S | Download DOT source |
| Ctrl/Cmd + R | Re-render diagram |
| Ctrl/Cmd + B | Toggle minimap |
🎨 UI Features
Editor Panel
- Syntax Highlighting - Full DOT language support
- Auto-completion - Smart suggestions
- Line Numbers - Easy navigation
- Minimap - Quick overview
- Word Wrap - Better readability
Diagram Panel
- Live Updates - See changes as you type (800ms debounce)
- Zoom Controls - Scale from 10% to 500%
- Pan & Scroll - Navigate large diagrams
- Export Options - SVG, PNG, or DOT source
Sample Library
Pre-loaded examples accessible from the dropdown:
- Basic Graph
- Cluster Subgraphs
- Git Workflow
- Opportunity Flow
- Org Chart Hierarchy
- Process Steps
- Unix System
Browser Requirements
- Modern browsers with ES6+ support
- JavaScript enabled
- SVG support
🎯 Use Cases
- Documentation - Visualize system architectures
- Workflows - Map business processes
- Data Flow - Show data pipelines
- Dependencies - Display module relationships
- State Machines - Illustrate state transitions
- Network Diagrams - Design network topologies
- Org Charts - Create organizational structures
📄 License
MIT © Mohan Chinnappan
Made with ❤️ for the Graphviz community