
hapi-monitor
v0.2.0
Published
Terminal session monitor for HAPI hubs — nvtop-style chart, sticky-cursor agent table, BBS-flavored TUI.
Maintainers
 heavygee
Readme
A live terminal monitor for a HAPI hub — the thing that orchestrates Cursor / Claude / Codex / Gemini agent sessions across your laptops, desktops, and remote runners.
You get an nvtop-style scrolling chart of how many agents are currently
working, a sticky-cursor agent table sorted by attention (STUCK?,
ZOMBIE, WORKING, OK, INACTIVE), live CPU/RAM, project-aware
truncation, and an alt-screen TUI with j/k navigation and an i toggle
for inactive sessions.
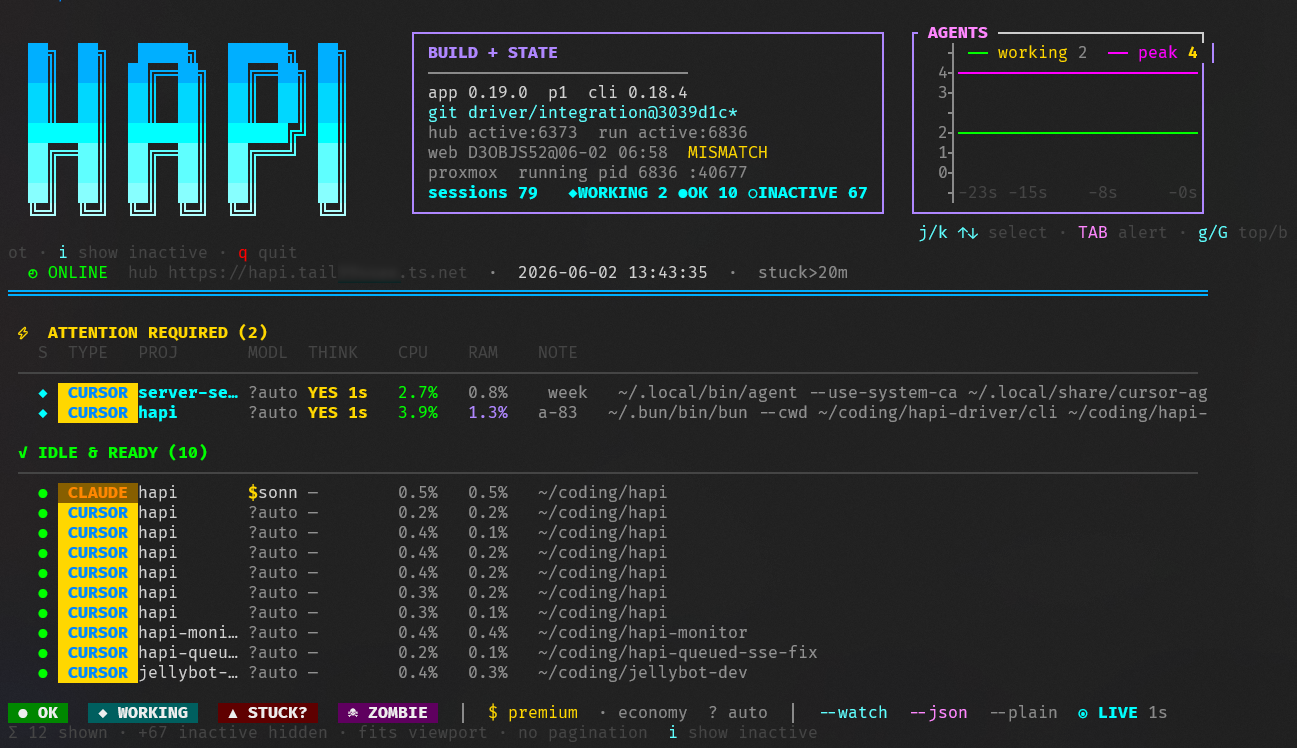
The screen is dense. docs/anatomy.md walks through every glyph, color, badge, and indicator line by line so a new operator can read the interface without guesswork.
Why this exists
HAPI ships with its own hub UI in the web app — this isn't a replacement for
that. This is the shell-native view: a single command, alt-screen TUI,
zero browser. Built for the operator who lives in tmux and wants
hapi-monitor --watch running in a side pane so they always know what their
fleet of agents is doing without alt-tabbing to a browser.
The project is not affiliated with the upstream tiann/hapi maintainers. It's a third-party operational tool built against the public HAPI hub API.
Install
Via npm (preferred)
# globally
npm install -g hapi-monitor
hapi-monitor --watch

# or one-shot without install
npx hapi-monitor --watch
From source
git clone https://github.com/heavygee/hapi-monitor.git
cd hapi-monitor
npm link        # makes `hapi-monitor` available on PATH
# or just run directly:
bash src/hapi-monitor.sh --watch
The C plotter binary (src/plotter/hapi-sessions-plot) is auto-built on
first run if cc (gcc / clang) is present. Otherwise the pure-Python
fallback kicks in — same data, slightly less crisp line rendering.
Requirements
| | |
|---|---|
| Required | Python 3.8+, bash 4+, a reachable HAPI hub, auth credentials |
| Optional | cc for the native C plotter (crisper chart) |
| Optional | tailscale to auto-detect a canonical Tailscale Service hub URL |
| Optional | systemctl, git for richer build/state info in the header |
| Platform | Linux / macOS / WSL2. Native Windows shells are not supported (no bash) |
Authentication
You need to give the script a JWT or a way to fetch one. Two ways:
Settings file (recommended for repeat use):
mkdir -p ~/.hapi
cat > ~/.hapi/settings.json <<'EOF'
{"cliApiToken": "<token from your hub admin UI>"}
EOF
The script exchanges the long-lived cliApiToken for a short-lived JWT via
POST {hub}/api/auth on each run, caches the JWT in-process, and
auto-refreshes on 401.
Override the file location with HAPI_SETTINGS.
Direct JWT (for ephemeral / CI use):
HAPI_JWT="eyJ..." hapi-monitorUsage
hapi-monitor              # one-shot snapshot
hapi-monitor --watch      # live updating, 1s refresh (default)
hapi-monitor --all        # include INACTIVE (disconnected) sessions
hapi-monitor --json       # machine-readable dump
hapi-monitor --plain      # no ANSI; pipe-friendly
hapi-monitor jellybot     # filter by substring (path / flavor / id)
Watch-mode keys
| key | action |
|---|---|
| j / ↓ | cursor down |
| k / ↑ | cursor up |
| g / G | jump top / bottom |
| TAB | next attention row (WORKING / STUCK? / ZOMBIE) |
| i | toggle INACTIVE rows on/off (always in the total count) |
| q / Q / ESC / Ctrl-C | quit |
The cursor is sticky-by-agent (session ID), not row index, so it stays on the same agent across re-sorts when statuses change.
Status meanings
| glyph | status | meaning |
|---|---|---|
| ● | OK | active, not thinking, runner PID alive |
| ◆ | WORKING | active, thinking less than HAPI_STUCK_MINUTES (default 20) |
| ▲ | STUCK? | thinking too long OR hub says active but PIDs missing |
| ☠ | ZOMBIE | active on THIS machine but no runner / agent process found in local ps |
| ○ | INACTIVE | disconnected; hidden by default, toggle with i |
Multi-machine note: the ZOMBIE check is only applied to sessions whose machineId matches this monitor's host. Sessions on other machines (a Windows install, a second Linux box) are classified purely from the hub's active / thinking flags - we have no way to introspect their /proc. Detection order:
HAPI_LOCAL_MACHINE_IDenv var (explicit override)machineIdfield in~/.hapi/settings.json(canonical - HAPI writes it on first runner start)- Vote-by-evidence fallback (matches session
hostPidAND first 8 chars ofagentSessionIdagainst local agent-shaped processes)
If all three fail (no env, no settings file, no live local agent visible) every session is treated as remote, which prefers missing a real local zombie over producing a false zombie on a remote row.
Environment variables
| var | default | purpose |
|---|---|---|
| HAPI_HUB_URL | http://127.0.0.1:3006 | Hub API target. Used for actual HTTP calls. |
| HAPI_HUB_PUBLIC_URL | auto-detect (Tailscale Service URL if tailscale present) | Display-only canonical hub URL shown in the header. |
| HAPI_JWT | — | Short-lived hub JWT; if set, skips the settings lookup. |
| HAPI_SETTINGS | ~/.hapi/settings.json | Path to JSON file containing {"cliApiToken": "...", "machineId": "..."} |
| HAPI_LOCAL_MACHINE_ID | (auto-detect) | Override the detected local machineId. Sessions whose machineId differs are classified from hub flags only (no local PID check / no false ZOMBIE). |
| HAPI_REPO | ~/coding/hapi/active (falls back to legacy ~/coding/hapi-active then ~/coding/hapi) | Repo root for build identifiers in the header. |
| HAPI_STUCK_MINUTES | 20 | Thinking longer than this → STUCK?. |
| HAPI_WATCH_SEC | 1 | Refresh interval for --watch (fractions ok). |
| HAPI_CHART_STATE | $TMPDIR/... | Sparkline history file (watch mode). |
| HAPI_SESSIONS_PLOT | src/plotter/hapi-sessions-plot | Native plotter binary path. |
| HAPI_HEALTH_IDLE_MAX | (fit terminal) | Cap idle rows. |
| HAPI_MONITOR_BASH | bash | Override bash binary path (npm wrapper). |
| NO_COLOR / FORCE_COLOR | — | Standard color control. |
Troubleshooting
HUB UNREACHABLE banner / Connection refused
Hub isn't reachable on HAPI_HUB_URL. The script keeps retrying every tick
— no need to relaunch. Verify with:
curl -fsS http://127.0.0.1:3006/api/health
systemctl status hapi-hub    # or whatever service runs your hub
no JWT and no settings file at /home/.../.hapi/settings.json
Either drop the settings file (see Authentication above) or pass HAPI_JWT.
hub auth rejected: HTTP 401
cliApiToken is stale or wrong. Regenerate via the hub admin UI / CLI and
update ~/.hapi/settings.json. The script auto-refreshes a JWT on 401 but
can't fix a bad cliApiToken.
Chart renders as ┐┘└┌ brick stairs instead of crisp lines
Native C plotter isn't built. Either install cc (gcc / clang) and run
npm run build:plotter, or accept the Python fallback.
Wrong / no hub URL shown in header
HAPI_HUB_PUBLIC_URL auto-detection uses tailscale status if available.
If you're not on Tailscale, set HAPI_HUB_PUBLIC_URL to whatever public /
external form is meaningful, or it'll fall back to HAPI_HUB_URL.
Contributing
See CONTRIBUTING.md. TL;DR: open an issue first (no ticket, no workee), then a PR with a conventional-commit title. Tests + lint must be green.
Security
See SECURITY.md for the private vulnerability reporting path.
License
MIT — see LICENSE.
Name story
Named simply because that's what it is: a monitor for HAPI. Earlier
candidates considered during the brainstorm: hapitop (htop/nvtop nod),
hapiscope (oscilloscope metaphor — the chart is the hook), hapeek
(peek + hapi). hapi-monitor won for plain searchability — when someone
googles "hapi monitoring tool", we want them to land here.
Related
- tiann/hapi — the upstream HAPI project itself