
highcharts-ternary-plot
v2.0.1
Published
Ternary / triangular plot plugin for Highcharts. Visualize three-component composition data with barycentric diagrams. TypeScript support included.
Maintainers
 blacklabel
Readme
Ternary Plot – Highcharts Plugin

![]()
Ternary Plot is an official Black Label plugin for Highcharts that adds a ternaryscatter series type — enabling triangular / barycentric diagrams for three-component compositional data. Drop it into any Highcharts project to get interactive ternary charts with full TypeScript support, no extra dependencies.
If you're looking for how to create a ternary chart in Highcharts, this plugin is the ready-to-use solution: it extends Highcharts with a native ternary coordinate system and a dedicated series type.
➖ Live demo
➖ GitHub repository
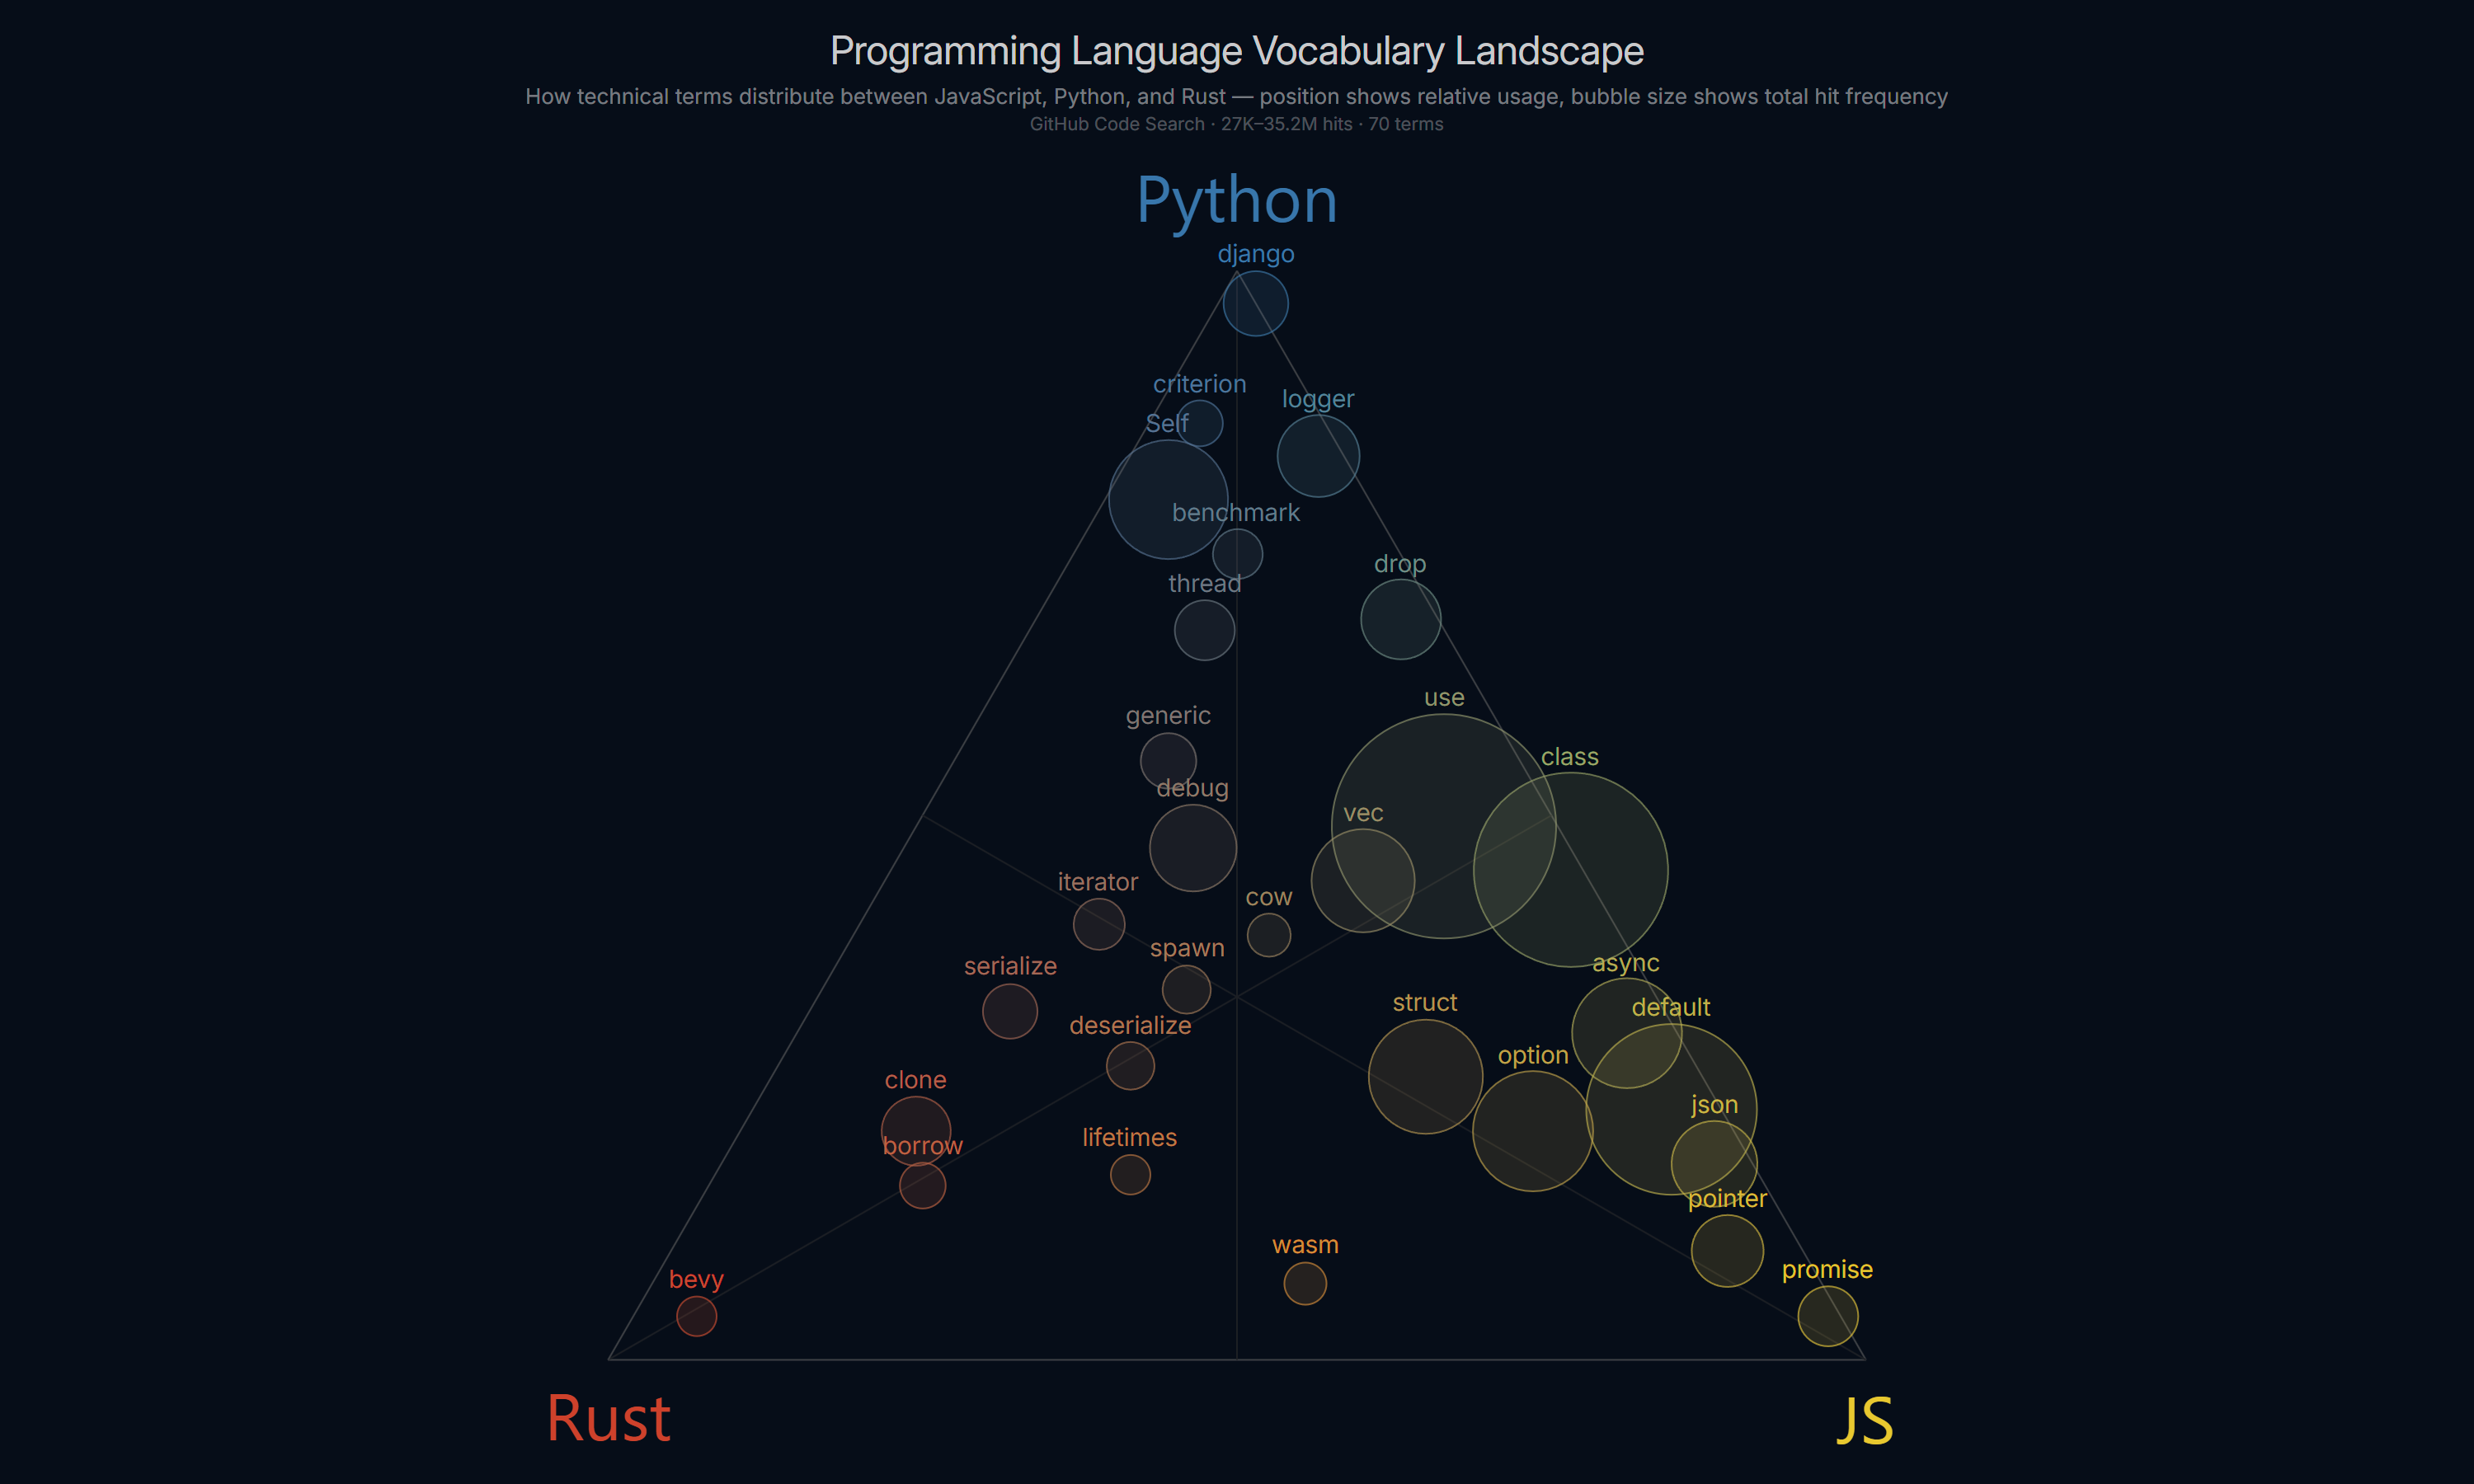
Table of Contents
- What is a ternary chart?
- When to use a ternary chart?
- Features
- Getting Started
- Minimal Code
- TypeScript
- Available Options
- Migrating from v1 to v2
- FAQ
- Development Setup
What is a ternary chart?
A ternary chart (also called a triangular diagram or barycentric plot) is a type of chart that visualizes data expressed as three components that always sum to a constant — typically 100%. Each data point is a composition of three parts (A, B, C), and its position within an equilateral triangle reflects the relative proportions of each component.
The three corners of the triangle each represent 100% of one component. A point in the center represents an equal mix of all three.
When to use a ternary chart?
Use a ternary chart when your data consists of three interdependent proportions that together make up a whole. The domain doesn't matter — what matters is the structure: three components, one total.
- How much of a presidential debate speech matched candidate A, B, or C in tone or vocabulary?
- Which programming language does a given term belong to — JavaScript, Python, or Rust?
- How do soil samples distribute between sand, silt, and clay?
- How do alloys distribute between three metals across a production batch?
- How do macronutrients (protein, fat, carbs) compare across food products?
- How does screen time split between three apps or categories per user?
If your data has three parts that sum to a constant and you want to see clustering, outliers, and gradients between three extremes — a ternary chart is the right tool.
Features
ternaryscatterseries type — scatter plot on triangular axes- Barycentric color blending via
componentColors— each point's color interpolated from three corner colors - Per-axis configuration (
a,b,c) with sharedcommonoptions - Separate styling for triangle sides (
lineColor,lineWidth,lineDashStyle) and grid lines (gridLineColor,gridLineWidth,gridLineDashStyle) - Median lines (vertex to midpoint of opposite side)
- Bubble sizing via
minSize/maxSizewith area-proportional scaling - Configurable
tickInterval, axis titles, labels, and spacing - Full TypeScript support — bundled type definitions, no
@typesinstall needed - Works with Highcharts themes and responsive rules
Getting Started
Compatibility
| Ternary Plot Version | Highcharts Version |
| -------------------- | ------------------ |
| 2.0.1 | 12.0.0+ |
Browser Support
All modern evergreen browsers are supported: Chrome, Firefox, Safari, Edge. Internet Explorer is not supported.
Installation
Install via NPM:
npm install highcharts highcharts-ternary-plot
# or
yarn add highcharts highcharts-ternary-plot
# or
pnpm add highcharts highcharts-ternary-plot
Then import and initialize:
import Highcharts from "highcharts";
import HighchartsTernaryPlot from "highcharts-ternary-plot";

HighchartsTernaryPlot(Highcharts);
Or include via a <script> tag after loading Highcharts:
<script src="https://code.highcharts.com/highcharts.js"></script>
<script src="https://cdn.jsdelivr.net/npm/[email protected]/js/ternary-plot.js"></script>
Minimal Code
Highcharts.chart('container', {
  chart: {
    ternary: true
  },

  series: [{
    type: 'ternaryscatter',
    data: [
      [20, 70, 10],
      [30, 40, 30],
      [20, 35, 45]
    ]
  }]
});
TypeScript
Type declarations are included in the package — no separate @types install needed. Importing the plugin automatically augments the Highcharts module with all ternary-specific types (TernaryOptions, TernaryPointOptions, SeriesTernaryScatterOptions, etc.).
import Highcharts from 'highcharts';
import HighchartsTernaryPlot from 'highcharts-ternary-plot';

HighchartsTernaryPlot(Highcharts);

Highcharts.chart('container', {
  chart: {
    ternary: {
      angle: 60,
      spacing: 40,
      sumTo: 100
    }
  },
  series: [{
    type: 'ternaryscatter',
    componentColors: {
      a: '#e74c3c',
      b: '#2ecc71',
      c: '#3498db'
    },
    data: [
      { a: 20, b: 10, c: 70 },
      { a: 80, b: 15, c: 5 },
      { a: 95, b: 3, c: 2 },
    ]
  }]
});
Available Options
chart.ternary
boolean | object — Enable and configure the ternary coordinate system. Set to true to use all defaults, or pass an options object.
| Option | Type | Default | Description |
| ----------------------- | ------------------------- | ------- | -------------------------------------------------------------------------------------------------------------- |
| chart.ternary | boolean \| TernaryOptions | — | Enable ternary mode. |
| chart.ternary.enabled | boolean | true | Set to false to disable while keeping the configuration object. |
| chart.ternary.angle | number | 60 | Angle in degrees between the base and sides of the triangle. 60 produces an equilateral shape. Range (0, 90). |
| chart.ternary.spacing | number | 35 | Pixel padding applied uniformly around the triangle. Increase to make room for axis labels. |
| chart.ternary.sumTo | number | 100 | The value that the three components must sum to. Use 1 for fractions, 100 for percentages. |
ternaryAxis
object — Configure the three axes. common applies to all axes; a, b, c allow per-axis overrides.
Structure
| Option | Description |
| -------------------- | ----------------------------------------- |
| ternaryAxis.common | Shared options applied to all three axes. |
| ternaryAxis.a | Options for the bottom axis (A). |
| ternaryAxis.b | Options for the right axis (B). |
| ternaryAxis.c | Options for the left axis (C). |
Grid lines
| Option | Type | Default | Description |
| ------------------- | -------- | --------- | --------------------------------------------------------- |
| tickInterval | number | 50 | Interval between grid lines. |
| gridLineColor | string | #d6d6d6 | Color of the internal grid lines. |
| gridLineWidth | number | 1 | Width of the internal grid lines in pixels. |
| gridLineDashStyle | string | 'Solid' | Dash style of the internal grid lines (DashStyleValue). |
| gridLineExtension | number | 0 | Extends grid lines beyond the triangle edges, in pixels. |
Triangle sides (axis lines)
| Option | Type | Default | Description |
| --------------- | -------- | --------- | ---------------------------------------------------- |
| lineColor | string | #d6d6d6 | Color of the triangle sides. |
| lineWidth | number | 1 | Width of the triangle sides in pixels. |
| lineDashStyle | string | 'Solid' | Dash style of the triangle sides (DashStyleValue). |
Median lines
| Option | Type | Default | Description |
| ------------------ | ------------------- | --------- | -------------------------------------------------------------------- |
| median | boolean \| object | — | Show or configure median lines (vertex → midpoint of opposite side). |
| median.color | string | #d6d6d6 | Color of the median lines. |
| median.width | number | 1 | Width of the median lines in pixels. |
| median.dashStyle | string | 'Solid' | Dash style of the median lines (DashStyleValue). |
Labels
| Option | Type | Default | Description |
| ----------------- | --------- | ------- | --------------------------------------------------------- |
| labels.enabled | boolean | — | Show or hide tick labels. |
| labels.style | object | — | CSS style object applied to label text. |
| labels.distance | number | 6 | Distance between labels and the triangle edge, in pixels. |
Title
| Option | Type | Default | Description |
| ----------------------- | --------------------------------- | ---------- | ------------------------------------------------------------ |
| title.text | string | — | Axis title text. |
| title.style | object | — | CSS style object applied to the title. |
| title.margin | number | 30 | Distance between the title and the triangle edge, in pixels. |
| title.position | 'corner' \| 'side' | 'corner' | Position of the title relative to the triangle. |
| title.offsetDirection | 'horizontal' \| 'perpendicular' | — | Direction the title offsets from its axis edge. Only applies when position is 'side'. |
| title.rotation | number | — | Title rotation in degrees. Overrides the automatic rotation. |
Series: ternaryscatter
Set series.type to 'ternaryscatter'. Data points accept [a, b, c] arrays or objects with a, b, c properties. The c value may be omitted — it is derived as sumTo - a - b.
For bubble sizing (minSize / maxSize), provide a total value on each point — this is the independent 4th dimension that drives marker area. Without it, all bubbles render at the same middle size and a console warning is emitted.
| Option | Type | Description |
| ----------------------------- | -------- | -------------------------------------------------------------------------------------------------- |
| series.minSize | number | Minimum marker radius in pixels for bubble sizing. Requires maxSize and point.total. |
| series.maxSize | number | Maximum marker radius in pixels for bubble sizing. Requires minSize and point.total. |
| series.componentColors | object | Barycentric color blending — each point's color is interpolated from three corner colors. |
| componentColors.a | string | Color at the A vertex. |
| componentColors.b | string | Color at the B vertex. |
| componentColors.c | string | Color at the C vertex. |
| componentColors.alpha | number | Opacity applied to all points (0–1). Overrides any alpha in the color strings. |
| componentColors.strokeAlpha | number | Opacity for the point stroke (border). Uses the same barycentric blend as fill but with this alpha. |
Migrating from v1 to v2
v2.0.0 introduces three breaking changes.
1. Data keys renamed: x, y, z → a, b, c
Series data and tooltip point references use the new key names.
// v1
data: [[10, 60, 30], [20, 50, 30]]
// tooltip: point.x, point.y, point.z

// v2
data: [[10, 60, 30], [20, 50, 30]]  // array order unchanged
// tooltip: point.a, point.b, point.c
Object notation also changed:
// v1
{ x: 10, y: 60, z: 30 }

// v2
{ a: 10, b: 60, c: 30 }
2. ternaryAxis changed from an array to an object
// v1
ternaryAxis: [
  { tickInterval: 10, title: { text: 'A' } },
  { tickInterval: 10, title: { text: 'B' } },
  { tickInterval: 10, title: { text: 'C' } }
]

// v2
ternaryAxis: {
  common: { tickInterval: 10 },  // shared options (optional)
  a: { title: { text: 'A' } },
  b: { title: { text: 'B' } },
  c: { title: { text: 'C' } }
}
3. chart.ternarySpacing moved into chart.ternary
// v1
chart: {
  ternary: true,
  ternarySpacing: 35
}

// v2
chart: {
  ternary: {
    spacing: 35
  }
}
FAQ
How to create a ternary chart in Highcharts?
Install the package (npm install highcharts-ternary-plot), import and call HighchartsTernaryPlot(Highcharts), then set chart.ternary: true and series.type: 'ternaryscatter'. See Minimal Code for a working example.
Does Highcharts support ternary plots natively?
No — Highcharts does not include a ternary chart type out of the box. This plugin adds it as a first-class series type with a native API.
Does this plugin work with TypeScript?
Yes. Type definitions are bundled — no separate @types package needed. Importing the plugin augments the Highcharts module automatically.
What version of Highcharts is required?
Highcharts 12.0.0 or later.
Can I use fractions instead of percentages?
Yes. Set chart.ternary.sumTo: 1 and provide data where a + b + c = 1.
Can I style the triangle sides separately from the grid lines?
Yes. Use lineColor, lineWidth, and lineDashStyle for the triangle sides, and gridLineColor, gridLineWidth, gridLineDashStyle for the internal grid lines. These are independent.
Does the plugin support bubble charts on a ternary axis?
Yes. Set minSize and maxSize on the series, and provide a total value on each point — this is the independent 4th dimension used for sizing. The plugin scales marker sizes with area-proportional interpolation. If total is omitted, all bubbles render at the middle size and a console warning is emitted.
Can I color points based on their position in the triangle?
Yes — use componentColors to define a color per vertex. Each point's fill is automatically blended by its a, b, c values.
Alternatives
If you need a ternary chart in Highcharts, this plugin is the only native solution — Highcharts itself does not include one.
Other JavaScript ternary chart libraries exist (e.g. Plotly, D3-ternary), but they don't integrate with the Highcharts ecosystem, themes, or responsive rules. If your project already uses Highcharts, this plugin gives you a consistent API with no additional dependencies.
Development Setup
If you want to work on this plugin locally:
- Clone the repository
git clone https://github.com/blacklabel/highcharts-ternary-plot.git
cd highcharts-ternary-plot- Install dependencies
npm install
# or
yarn install- Build the plugin
npm run buildThe compiled file will be available as js/ternary-plot.js.
Available commands:
| Command | Description |
| --------------------- | ---------------------------------------- |
| npm run build | Compile and bundle the plugin |
| npm run build:watch | Rebuild automatically on file changes |
| npm run typecheck | Run TypeScript type checking |
| npm test | Run tests |
| npm run lint | Lint TypeScript source files |
| npm run lint:fix | Lint and auto-fix TypeScript source files |
After building, load js/ternary-plot.js after Highcharts in your HTML to test locally.
Why Black Label Built This Plugin
At Black Label, we specialize in pushing the boundaries of data visualization. Over the past 15 years, we've worked with companies worldwide to build charting solutions that go beyond out-of-the-box libraries.
Highcharts is at the heart of much of our work, and this plugin grew directly out of real-world client needs:
- Visualizing compositional data using ternary charts
- Extending Highcharts with native ternary axes and series types
Ternary Plot is one of many plugins we've created to make Highcharts more flexible, more powerful, and more developer-friendly.
About Black Label
We're a Krakow-based team of data visualization experts, working closely with Highsoft and the global Highcharts community since 2010. Our expertise spans plugins, extensions, custom dashboards, and full-scale dataviz applications.
Ternary Plot is just one of the many innovations we've open-sourced. Explore more on our GitHub profile, read insights on our Blog, or connect with us at [email protected] to discuss how we can help bring your charts and dashboards to life.
➖ Learn more on our LinkedIn page.