
ideogram
v1.53.0
Published
Chromosome visualization for the web
Downloads
9,282
Maintainers
 eweitz
Readme
ideogram
![]()
![]()
Ideogram.js is a JavaScript library for chromosome visualization.
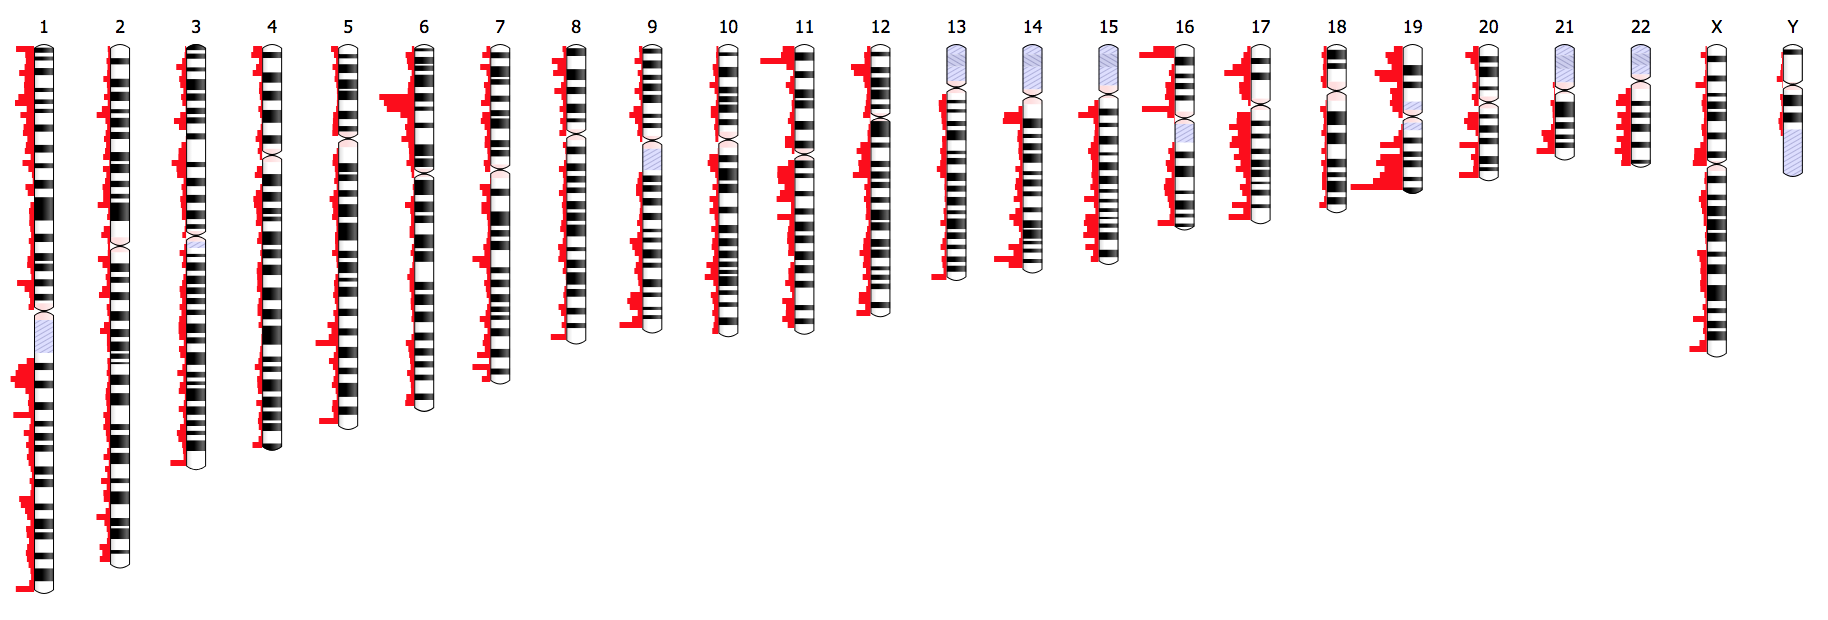
Ideogram supports drawing and animating genome-wide datasets for human, mouse, and many other eukaryotes. The Ideogram API for annotations supports histograms, heatmaps, overlays, and points of arbitrary shape and color layered in tracks. The Ideogram API also supports spanning annotations alone, or with heatmaps and histograms. Ideogram can depict haploid, diploid or higher ploidy genomes (e.g. plants), as well as aneuploidy, genetic recombination, and homologous features between chromosomes.
Ideogram can be embedded as a reusable component in any web page or application, and leverages D3.js and SVG to achieve fast, crisp client-side rendering. You can also integrate Ideogram with JavaScript frameworks like Angular, React, and Vue, as well as data science platforms like R and Jupyter Notebook.
Check out live examples, get up and running with your own deployment, skim basic usage, or dive into the full API!
A broader overview is also available. It discusses Ideogram's chromosome biology, technical architecture, and more.
Installation
To link directly to the latest release, copy this snippet:
<script src="https://cdn.jsdelivr.net/npm/[email protected]/dist/js/ideogram.min.js"></script>You can also easily use the library locally:
$ cd <your local web server document root>
$ git clone https://github.com/eweitz/ideogram.git
Then go to http://localhost/ideogram/examples/.
Or, if you use npm:
npm install ideogramYou can then import Ideogram into an application like so:
import Ideogram from 'ideogram';Usage
<head>
  <script src="https://cdn.jsdelivr.net/npm/[email protected]/dist/js/ideogram.min.js"></script>
</head>
<body>
<script>
  var ideogram = new Ideogram({
    organism: 'human',
    annotations: [{
      name: 'BRCA1',
      chr: '17',
      start: 43044294,
      stop: 43125482
    }]
  });
</script>
</body>
Many more usage examples are available at https://eweitz.github.io/ideogram/.
You can also find examples of integrating Ideogram with JavaScript frameworks like Angular, React, and Vue, as well as data science platforms like R and Jupyter Notebook.
API
See the Ideogram API reference for detailed documentation on configuration options and methods.