
interactive-world-map
v1.0.2
Published
Interactive world map with choropleth visualization, customizable colors, bubble markers, TypeScript support, and data utilities
Maintainers
 ehteshamnasim
Readme
Interactive World Map
An interactive, customizable world map library built with Plotly.js that provides choropleth visualization with bubble markers, configurable color schemes, and real-time controls.
Features
- Choropleth Visualization: Color-coded countries based on data values
- Bubble Markers: Add markers with custom sizes and hover text for specific locations
- Customizable Colors: Configure min/max colors, land default color, and water color
- Color Presets: 6 built-in color themes (blue, green, red, purple, orange, teal)
- Interactive Legend: Vertical color legend bar with configurable position and size
- Responsive Design: Full viewport fit with no scrolling
- Real-time Controls: Live configuration panel to adjust map settings
- TypeScript Support: Full TypeScript definitions included
- Data Loading: Load from URLs, JSON objects, or use country names
- Data Validation: Automatic validation of country codes
- Country Name Resolution: Use country names instead of ISO codes
- Event System: Callbacks for clicks, hovers, data updates, and errors
- Utility Functions: Helper functions for data manipulation
- No Zoom: Clean, fixed view without zoom interactions
Installation
Using NPM
npm install interactive-world-mapUsing CDN
<link rel="stylesheet" href="https://cdn.jsdelivr.net/npm/[email protected]/interactive-map.min.css">
<script src="https://cdn.plot.ly/plotly-2.27.0.min.js"></script>
<script src="https://cdn.jsdelivr.net/npm/[email protected]/interactive-map.min.js"></script>
Local Installation
- Download the package
- Include the required files in your HTML:
<link rel="stylesheet" href="interactive-map.css">
<script src="https://cdn.plot.ly/plotly-2.27.0.min.js"></script>
<script src="interactive-map.js"></script>
Quick Start
Basic Usage
<!DOCTYPE html>
<html>
<head>
  <link rel="stylesheet" href="interactive-map.css">
</head>
<body>
  <div id="map-container"></div>

  <script src="https://cdn.plot.ly/plotly-2.27.0.min.js"></script>
  <script src="interactive-map.js"></script>
  <script>
    const config = {
      containerId: 'map-container',
      minColor: '#8db5d5',
      maxColor: '#0d5592',
      landDefaultColor: '#e0e8f0',
      waterColor: '#a8c5dd'
    };

    const data = {
      'USA': 100,
      'GBR': 80,
      'FRA': 75,
      'DEU': 90,
      'JPN': 85
    };

    const map = new InteractiveMap(config);
    map.render(data);
  </script>
</body>
</html>
With Bubble Markers
const markers = [
  { location: 'New York', lat: 40.7128, lon: -74.0060, size: 20, text: 'New York<br>Population: 8.3M' },
  { location: 'London', lat: 51.5074, lon: -0.1278, size: 15, text: 'London<br>Population: 9M' },
  { location: 'Tokyo', lat: 35.6762, lon: 139.6503, size: 25, text: 'Tokyo<br>Population: 14M' }
];

const config = {
  containerId: 'map-container',
  minColor: '#8db5d5',
  maxColor: '#0d5592',
  markers: markers
};

const map = new InteractiveMap(config);
map.render(data);
Loading Data from URL
const map = new InteractiveMap('map-container', config);

// Load from JSON file
await map.loadData({
  url: 'https://example.com/country-data.json',
  validateCodes: true
});

// Or load from object with country names
await map.loadData({
  data: {
    'United States': 100,
    'United Kingdom': 80,
    'France': 75
  },
  useCountryNames: true
});
Using Color Presets
const map = new InteractiveMap('map-container');
map.render(data);

// Apply a color preset
map.applyColorPreset('green');  // Options: blue, green, red, purple, orange, teal

// Or get all presets
const presets = InteractiveMap.getColorPresets();
Event Callbacks
map.setCallbacks({
  onLoad: () => console.log('Map loaded!'),
  onDataUpdate: (data) => console.log('Data updated:', data),
  onError: (error) => console.error('Error:', error),
  onCountryClick: (code, value) => console.log(`Clicked ${code}: ${value}`)
});
Adjusting Bubble Sizes
// Make all bubbles 1.5x larger
map.setBubbleSizeMultiplier(1.5);

// Make bubbles smaller
map.setBubbleSizeMultiplier(0.7);

// Reset to original size
map.setBubbleSizeMultiplier(1);
Using Utility Functions
// Generate sample data for testing
const sampleData = MapUtils.generateSampleData(20);
map.render(sampleData);

// Generate sample markers
const markers = MapUtils.generateSampleMarkers(5);
map.updateMarkers(markers);

// Get top 10 countries
const topCountries = MapUtils.getTopCountries(data, 10);

// Normalize values to 0-100 range
const normalized = MapUtils.normalizeValues(data);

// Filter by region
const europeData = MapUtils.filterByRegion(data, 'europe');
Configuration Options
Basic Configuration
| Option | Type | Default | Description |
|--------|------|---------|-------------|
| containerId | string | 'map-container' | ID of the container element |
| minColor | string | '#8db5d5' | Color for minimum data values |
| maxColor | string | '#0d5592' | Color for maximum data values |
| landDefaultColor | string | '#e0e8f0' | Color for countries without data |
| waterColor | string | '#a8c5dd' | Color for oceans and seas |
Legend Configuration
| Option | Type | Default | Description |
|--------|------|---------|-------------|
| colorBarX | number | 0.98 | Horizontal position (0-1, right-aligned) |
| colorBarY | number | 0.15 | Vertical position from bottom (0-1) |
| colorBarLen | number | 0.3 | Length of the color bar (0-1) |
| colorBarThickness | number | 12 | Thickness in pixels |
Marker Configuration
Each marker in the markers array should have:
{
  location: string,    // Name of the location
  lat: number,        // Latitude
  lon: number,        // Longitude
  size: number,       // Size of the bubble (1-50)
  text: string        // Hover text (supports HTML)
}
API Reference
InteractiveMap Class
Constructor
new InteractiveMap(config)Creates a new map instance with the specified configuration.
Parameters:
config(Object): Configuration object with the options listed above
Methods
render(data, markers)
map.render(data, markers)Renders the map with the specified data and markers.
Parameters:
data(Object): Country data as key-value pairs where keys are ISO 3-letter country codesmarkers(Array, optional): Array of marker objects to display on the map
Example:
const data = {
  'USA': 100,
  'GBR': 80,
  'CHN': 95
};

const markers = [
  { location: 'New York', lat: 40.7128, lon: -74.0060, size: 20, text: 'NYC' }
];

map.render(data, markers);
loadData(options)
await map.loadData(options)Load data from a URL or object with optional validation and conversion.
Parameters:
options(Object):url(string, optional): URL to load JSON data fromdata(Object, optional): Data object to load directlyuseCountryNames(boolean, optional): Convert country names to ISO codesvalidateCodes(boolean, optional): Validate country codes (default: true)markers(Array, optional): Markers to display
Example:
await map.loadData({
  url: 'data.json',
  validateCodes: true
});
updateData(data)
map.updateData(data)Update map data without full re-initialization.
Parameters:
data(Object): New country data
updateMarkers(markers)
map.updateMarkers(markers)Update or add markers to the map.
Parameters:
markers(Array): Array of marker objects
setBubbleSizeMultiplier(multiplier)
map.setBubbleSizeMultiplier(multiplier)Adjust the size of all bubble markers by a multiplier.
Parameters:
multiplier(number): Size multiplier (e.g., 1.5 for 150% size, 0.5 for 50% size)
Example:
// Make bubbles 1.5x larger
map.setBubbleSizeMultiplier(1.5);

// Make bubbles smaller
map.setBubbleSizeMultiplier(0.75);
setCallbacks(callbacks)
map.setCallbacks(callbacks)Set event callback functions.
Parameters:
callbacks(Object): Object with callback functionsonLoad: Called when map finishes loadingonDataUpdate: Called when data is updatedonError: Called on errorsonCountryClick: Called when country is clickedonMarkerClick: Called when marker is clicked
setTheme(theme)
map.setTheme(theme)Change the map theme.
Parameters:
theme(string): 'light' or 'dark'
applyColorPreset(preset)
map.applyColorPreset(preset)Apply a built-in color preset or custom preset.
Parameters:
preset(string|Object): Preset name ('blue', 'green', 'red', 'purple', 'orange', 'teal') or preset object
validateCountryCodes(data)
const invalid = map.validateCountryCodes(data)Validate country codes in data.
Parameters:
data(Object): Country data to validate
Returns: Array of invalid country codes
Static Methods
InteractiveMap.countryNameToCode(name)
const code = InteractiveMap.countryNameToCode('United States');
// Returns: 'USA'
Convert country name to ISO 3-letter code.
Parameters:
name(string): Country name
Returns: ISO code or null if not found
InteractiveMap.getColorPresets()
const presets = InteractiveMap.getColorPresets();Get all available color presets.
Returns: Array of color preset objects
MapUtils Helper Library
The package includes map-utils.js with helpful functions for data manipulation:
Available Functions
generateSampleData(countries)
Generate random sample data for testing.
const data = MapUtils.generateSampleData(20); // 20 random countriesgenerateSampleMarkers(count)
Generate random markers for testing.
const markers = MapUtils.generateSampleMarkers(5); // 5 random city markerscsvToMapData(csv)
Convert CSV string to map data format.
const csv = `code,value
USA,100
GBR,80`;
const data = MapUtils.csvToMapData(csv);
getTopCountries(data, n)
Get top N countries by value.
const top10 = MapUtils.getTopCountries(data, 10);normalizeValues(data)
Normalize all values to 0-100 range.
const normalized = MapUtils.normalizeValues(data);filterByRegion(data, region)
Filter countries by region. Available regions: north-america, south-america, europe, asia, middle-east, africa, oceania.
const europeOnly = MapUtils.filterByRegion(data, 'europe');mergeData(datasets, method)
Merge multiple datasets using different methods: sum, average, max, min.
const merged = MapUtils.mergeData([data1, data2, data3], 'average');sortByValue(data, ascending)
Sort countries by value.
const sorted = MapUtils.sortByValue(data, false); // Descending orderCountry Codes
The map uses ISO 3166-1 alpha-3 country codes. Common examples:
USA- United StatesGBR- United KingdomFRA- FranceDEU- GermanyCHN- ChinaJPN- JapanIND- IndiaBRA- BrazilCAN- CanadaAUS- Australia
For a complete list, see ISO 3166-1 alpha-3.
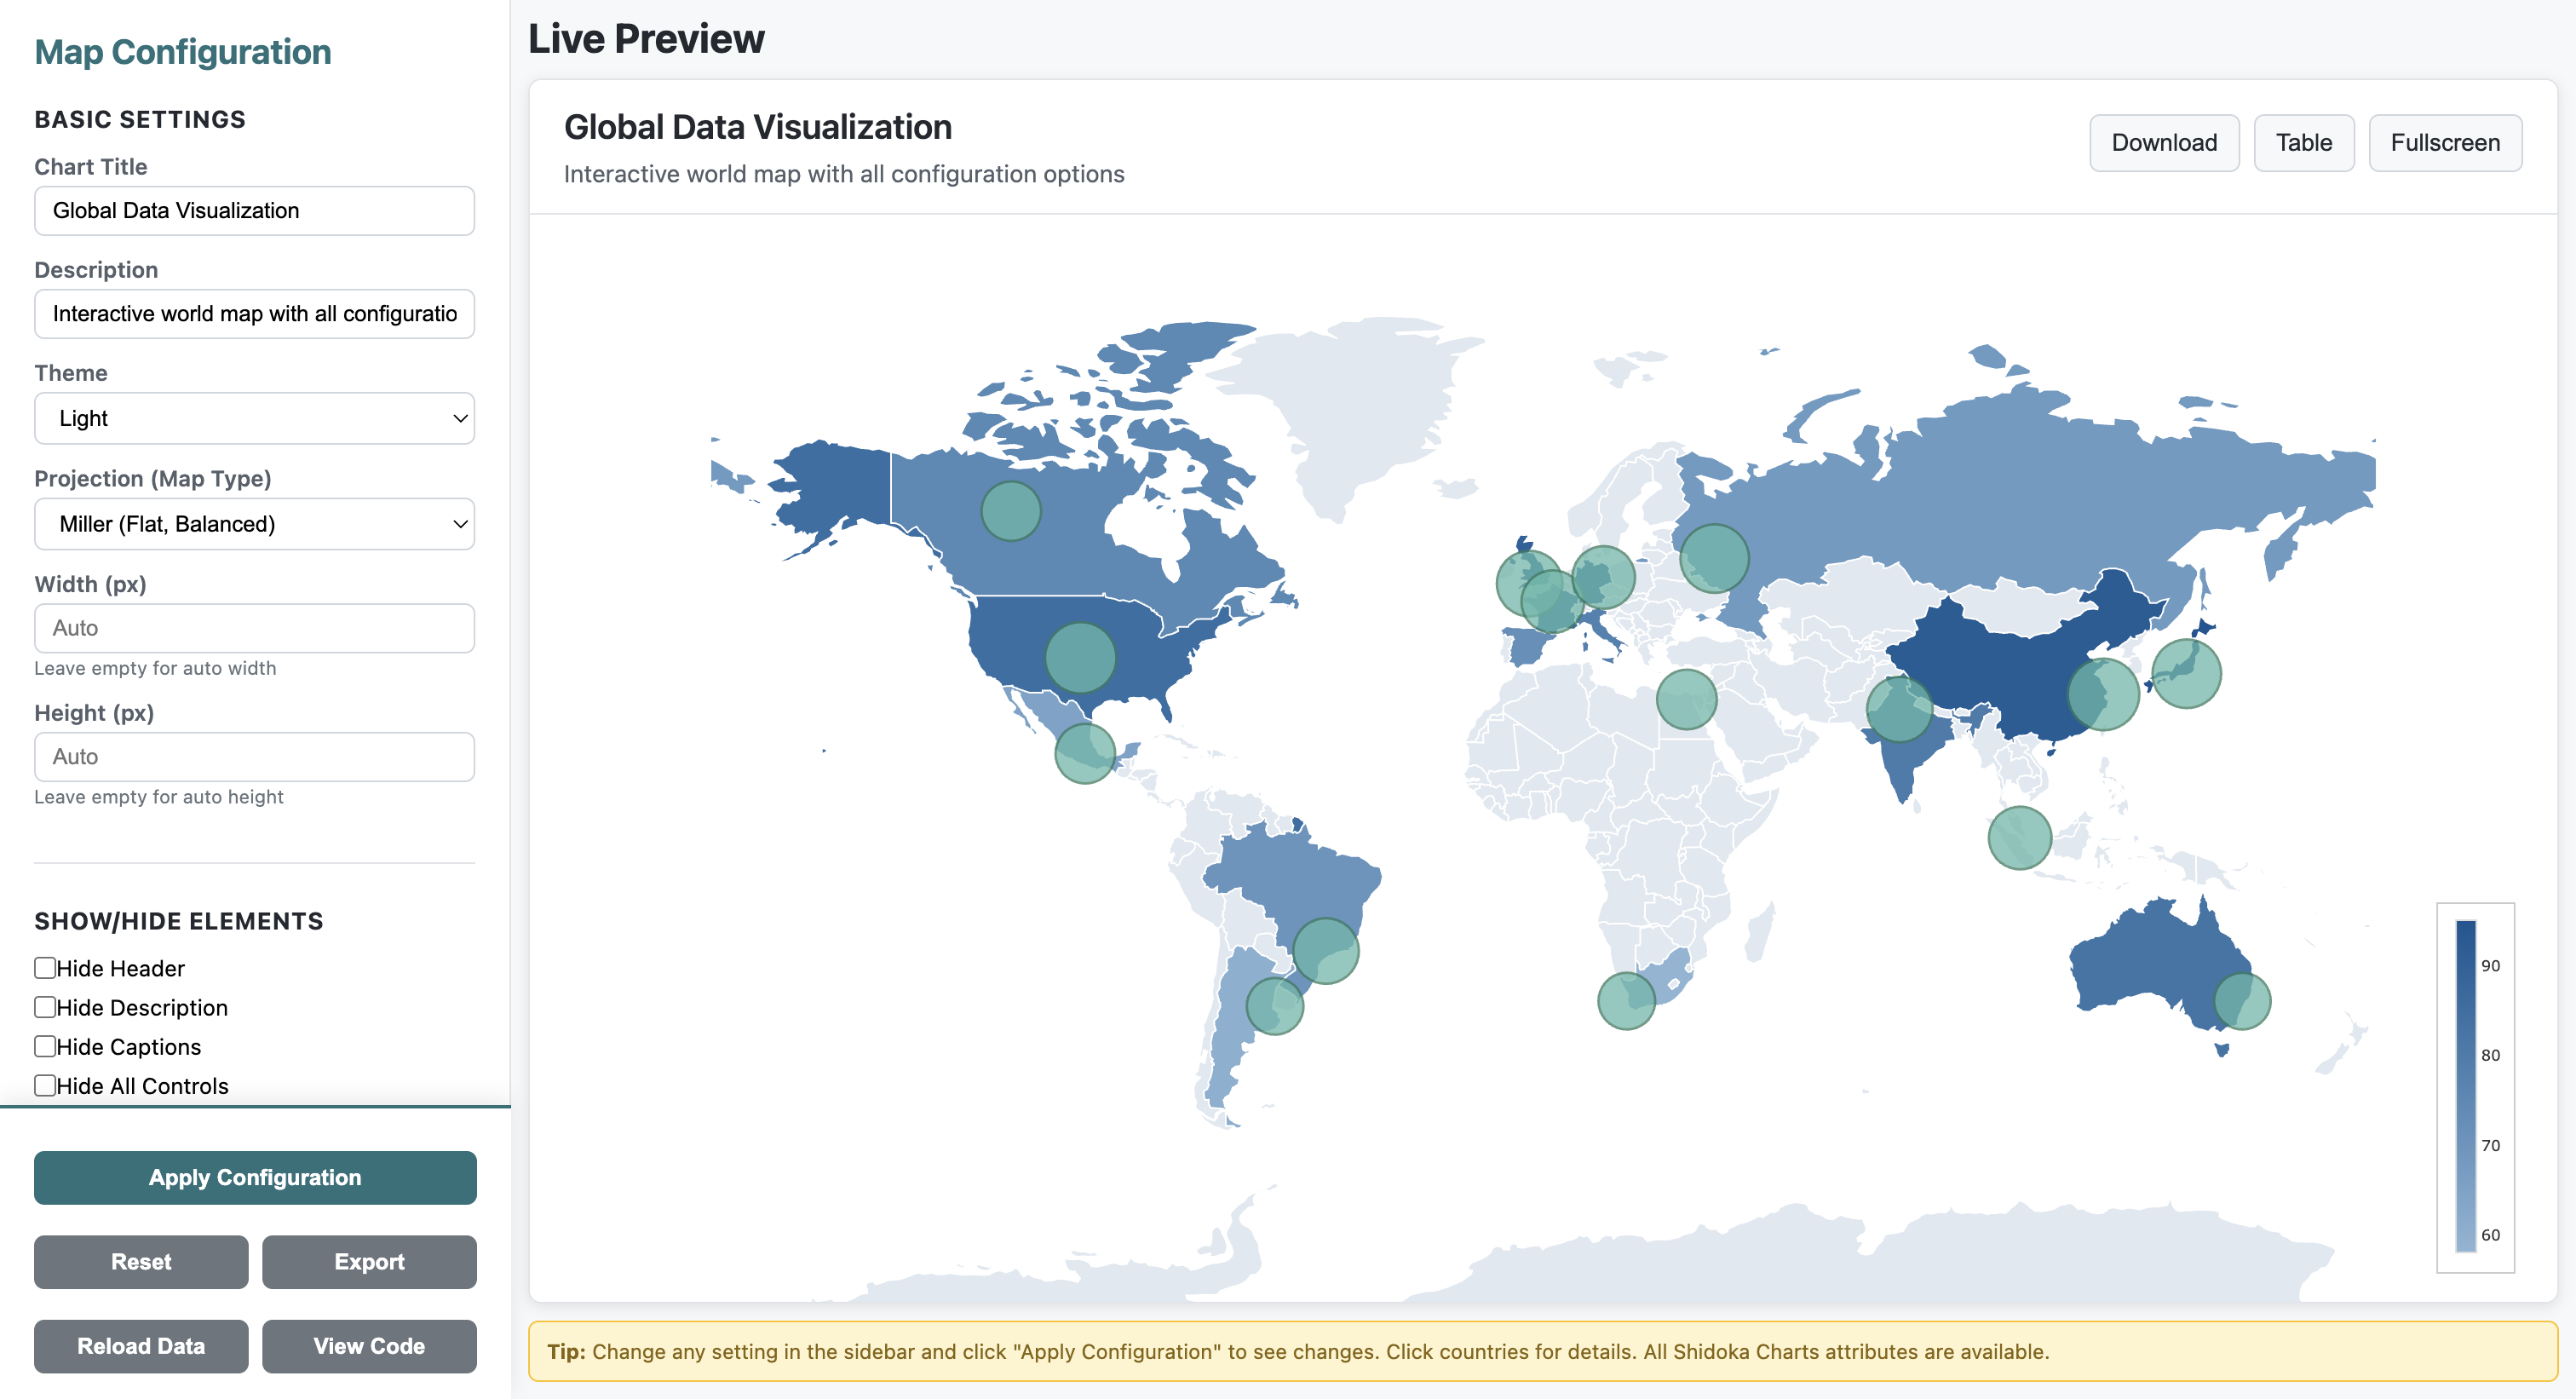
Demo
Try the Live Demo - Interactive configuration panel with all features
The package includes a demo file (demo.html) that provides a full interactive configuration panel. Open it in a browser to:
- Adjust colors in real-time
- Configure legend position and size
- Add and test bubble markers
- Toggle various map settings
npm run demoCode Examples
The package includes an examples.html file with comprehensive code examples showing:
- Basic map setup
- Adding bubble markers
- Customizing colors
- Dynamic data updates
- Multiple configuration scenarios
Browser Support
- Chrome (latest)
- Firefox (latest)
- Safari (latest)
- Edge (latest)
Dependencies
- Plotly.js (^2.27.0)
License
MIT
Repository
https://github.com/ehteshamnasim/interactive-world-map
Issues
Report issues at: https://github.com/ehteshamnasim/interactive-world-map/issues
Contributing
Contributions are welcome! Please feel free to submit a Pull Request.