
itbot
v1.0.8
Published
BrowserBot is a wrapper of the Chrome DevTool. It uses a self language to execute steps in a browser session. The key insight our research follows the idea that even for the same steps performed in the browser, we can get "different" internal datas from t
Downloads
42

Readme
BrowserBot
BrowserBot is a wrapper of the Chrome DevTool. It uses a self language to execute steps in a browser session. The key insight our research follows the idea that even for the same steps performed in the browser, we can get "different" internal datas from the browser, as we presented in previous works.
Recording
Chrome provides several profiling infos in the DevTool view, most of them can be gathered using the specific DevTool protocol through a websocket channel. BrowserBot records and saves those metrics.
- [x] Screnshots of the session every x milliseconds
- [x] Network profiling (Raw event recording)
- [x] JavaScript code profiling
- [x] JavaScript code coverage
- [x] Generated V8 bytecode
- [x] MHTML snapshot of the DOM
Troubleshooting
- Chrome does not open: You need to set a environment variable to the chrome binary if you dont have it, for example, for MacOS
export chrome='/Applications/Google Chrome.app/Contents/MacOS/Google Chrome' - The port 9222 is busy: You need to set a environment variable to the debugging port, if you dont have it, for example, for MacOS
export chromePort=9223 - Scripts mentioned in the profiling result are not saved: Install curl
How to use it ?
- Run tests:
npm run test
TODO
Steps language
BrowsetBot read from a script the steps to perform in the browser. The script file presents the instructions one per line. A instruction is composed by the opcode and the parameters for it, for example, goto <url>.
| opcode | operator1 | operator2 | operator3 | description |
|---|-----|---|---|---|
| goto | url | | | Navigate the page to |
| focus | CSSSelector | | | Focus an input in the page that match with the selector |
| sleep | X | | | Idle state for X milliseconds |
| char | C | | | Send key event (C) to the browser |
| text | text | delay | max_delay (optional) | Send the text to the browser, key by key, with a minimun delay provided by operator2. If operator3 is provided, then the delay is a random variable between operator2 and operator3, i.e. operator2 + Math.random()*(operator3 - operator2) |
| key | C | | | Send special key to the Browser session, for example, key Enter |
TODO add more instructions like mouse events
Example
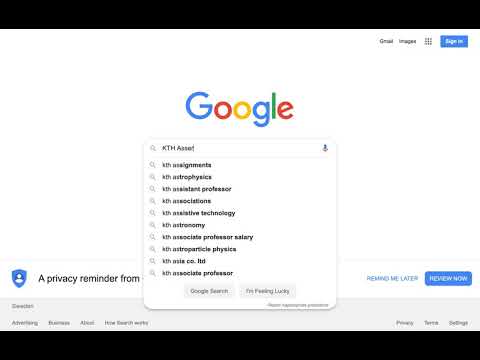
Perform and record a query to google
goto https://www.google.com
focus [name=q]
sleep 2000

text 'KTH Assert' 200 400

key Enter

sleep 2500
Background
BrowserBot uses the DevTool protocol from Chrome. It is like puppeteer but much much simpler. The following steps can be implemented under any stack, we used JS because we love it :).
Steps
Choose the debugging port: i.e. 9222
Open a browser with --remote-debugging-port=9222
Execute query to http://localhost:9222/json
The resulting json is like this:
[ {
"description": "",
"devtoolsFrontendUrl": "/devtools/inspector.html?ws=localhost:9222/devtools/page/926A781407E057C7AE6A2C6F1E61B371",
"id": "926A781407E057C7AE6A2C6F1E61B371",
"title": "Document",
"type": "page",
"url": "https://kth.se",
"webSocketDebuggerUrl": "ws://localhost:9222/devtools/page/926A781407E057C7AE6A2C6F1E61B371"
} ]
Every tab in the browser session will be represented in this json object as an array entry. The properties of each entry are: page description, id, title of the page, url of the page and the websocket address to access the debugging interface.
Then, open a websocket channel targeting the tab webSocketDebuggerUrl
Start to talking to chrome debugging interface like Runtime.enable method call https://chromedevtools.github.io/devtools-protocol/v8/Runtime at open channel event.
// NodeJS example ws.send( JSON.stringify({{id: 1, method: 'Runtime.enable'}}))// NodeJS example ws.send( JSON.stringify({{id: 1, method: 'Network.enable'}}))Listen for incoming messages:
// NodeJS example
ws.on('message', function incoming(data) {
    console.log(data);
});
How to execute remote methods ?
Following the DevTools documentation, basically to run it, you need to send a WS message as follows:
{
    "id": "RequestUniqueID",
    "method": "MethodName",
    "params": {
        "key": "value" // For each value described as parameter in documentation
    }
}
The call result is showed in the Runtime listener with the unique sent Id as identifier
{
    "id":"RequestUniqueID",
    "result":
        {
            "result":
            {
                "type":"undefined"
            }
        }
}
Example: Execute JavaScript code in specific page
// NodeJS example

ws.send({
    "id": 4,
    "method": "Runtime.enable"
})

ws.send({
    "id": 2,
    "method": "Runtime.evaluate",
    "params": {
        "expression": "1 + 2"
    }
})
Result
{
    "id":2,
    "result":
    {
        "result":
        {
            "type":"number",
            "value":2,
            "description":"2"
        }
    }
}
Other examples here