
joplin-plugin-function-plot
v1.0.0
Published
This plugin render a fenced JSON options into a function plot. It is essentially a Joplin wrapper of the function-plot library of Mauricio Poppe, which does most of the heavy lifting.

Readme
Function Plot
This plugin render a fenced JSON options into a function plot. It is essentially a Joplin wrapper of the function-plot library of Mauricio Poppe, which does most of the heavy lifting.
Usage
Some simple examples can be found in the example below. For advanced usage please check the document of function-plot. Note that some features of the library are not supported by the plugin such as linked graphs, tip function, etc. Basically anything that outside the JSON options are not supported.
One important warning is that you need to write the options in JSON format while examples in function-plot is actually javascript objects. Meaning that you need to double-quote all keys, do not use single quote, and do not leave ending comma.
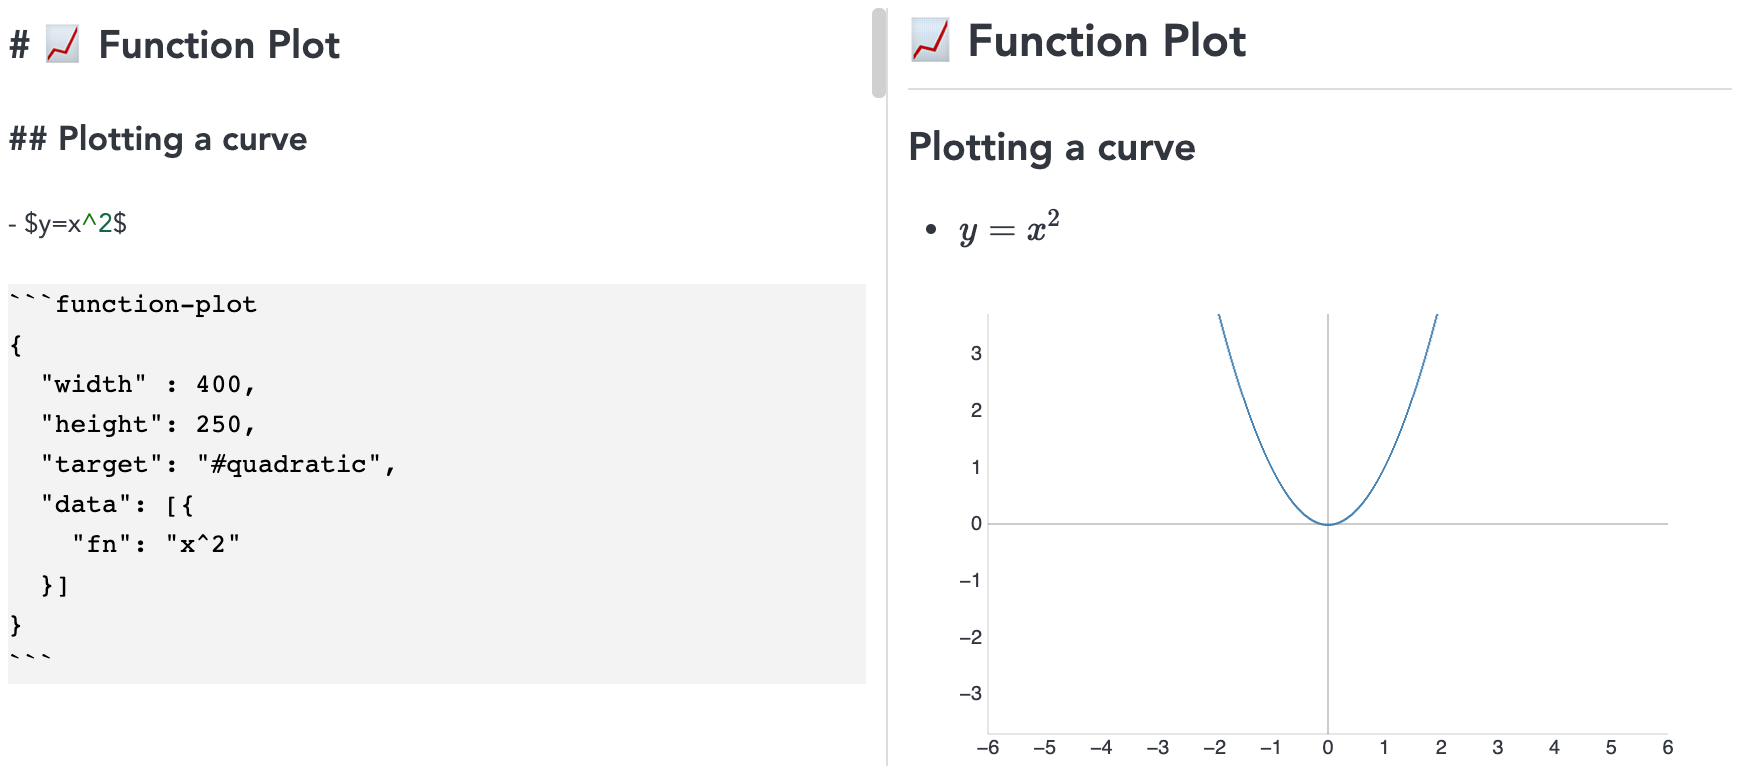
# 📈 Function Plot

## Plotting a curve

- $y=x^2$

```function-plot
{
  "width" : 400,
  "height": 250,
  "target": "#quadratic",
  "data": [{
    "fn": "x^2"
  }]
}
```


- Advanced
```function-plot
{
  "width" : 400,
  "height": 250,
  "target": "#quadratic",
  "data": [{
    "fn": "x^2"
  }],
  "title": "Function y = x * x",
  "xAxis": {
    "label": "x - axis",
    "domain": [-6,6]
  },
  "yAxis": {
    "label": "y - axis"
  },
  "disableZoom": true,
  "grid": true
}
```


## Derivative
```function-plot
{
  "width" : 400,
  "height": 250,
  "target": "#derivative",
  "data": [{
    "fn": "x^2",
    "derivative": {
      "fn": "2 * x",
      "x0": 2,
      "updateOnMouseMove": true
    }
  }]
}
```

## Range and closed path
- $sin(x) +3$
```function-plot
{
  "width" : 400,
  "height": 250,
  "target": "#closed",
  "xAxis": {"domain": [-2, 12]},
  "data": [{
    "fn": "3 + sin(x)",
    "range": [2, 8],
    "closed": true
  }]
}
```

## Multiple graphs
```function-plot
{
  "width" : 400,
  "height": 250,
  "target": "#multiple",
  "data": [
    { "fn": "x", "color": "pink" },
    { "fn": "-x" },
    { "fn": "x * x" },
    { "fn": "x * x * x" },
    { "fn": "x * x * x * x" }
  ]
}
```


## Parametric Function
```function-plot
{
  "width" : 400,
  "height": 250,
  "target": "#parametric-circle",
  "yAxis": {"domain": [-1.897959183, 1.897959183]},
  "xAxis": {"domain": [-3, 3]},
  "data": [{
    "x": "cos(t)",
    "y": "sin(t)",
    "fnType": "parametric",
    "graphType": "polyline"
  }]
}

```

## Constants
- $\pi$
```function-plot
{
  "width" : 400,
  "height": 250,
  "target": "#pi-constant",
  "data": [
    {"fn": "sin(x)"},
    {"fn": "sin(x+PI/4)"},
    {"fn": "sin(x+PI/2)"}]
}
```

- $e$

```function-plot
{
  "width" : 400,
  "height": 250,
  "target": "#euler-constant",
  "data": [
    {"fn": "E^x", "graphType":"polyline"}
  ]

}
```
Acknowledgement
- This plugin is not possible without the function-plot library of Mauricio Poppe