
langgraph-inspector
v0.1.1
Published
Live terminal debugger and offline ASCII graph renderer for LangGraph.js — no LangSmith account, no network calls.

Maintainers
 mrinalanand
Readme
langgraph-inspector
Live terminal debugger and offline ASCII graph renderer for LangGraph.js.
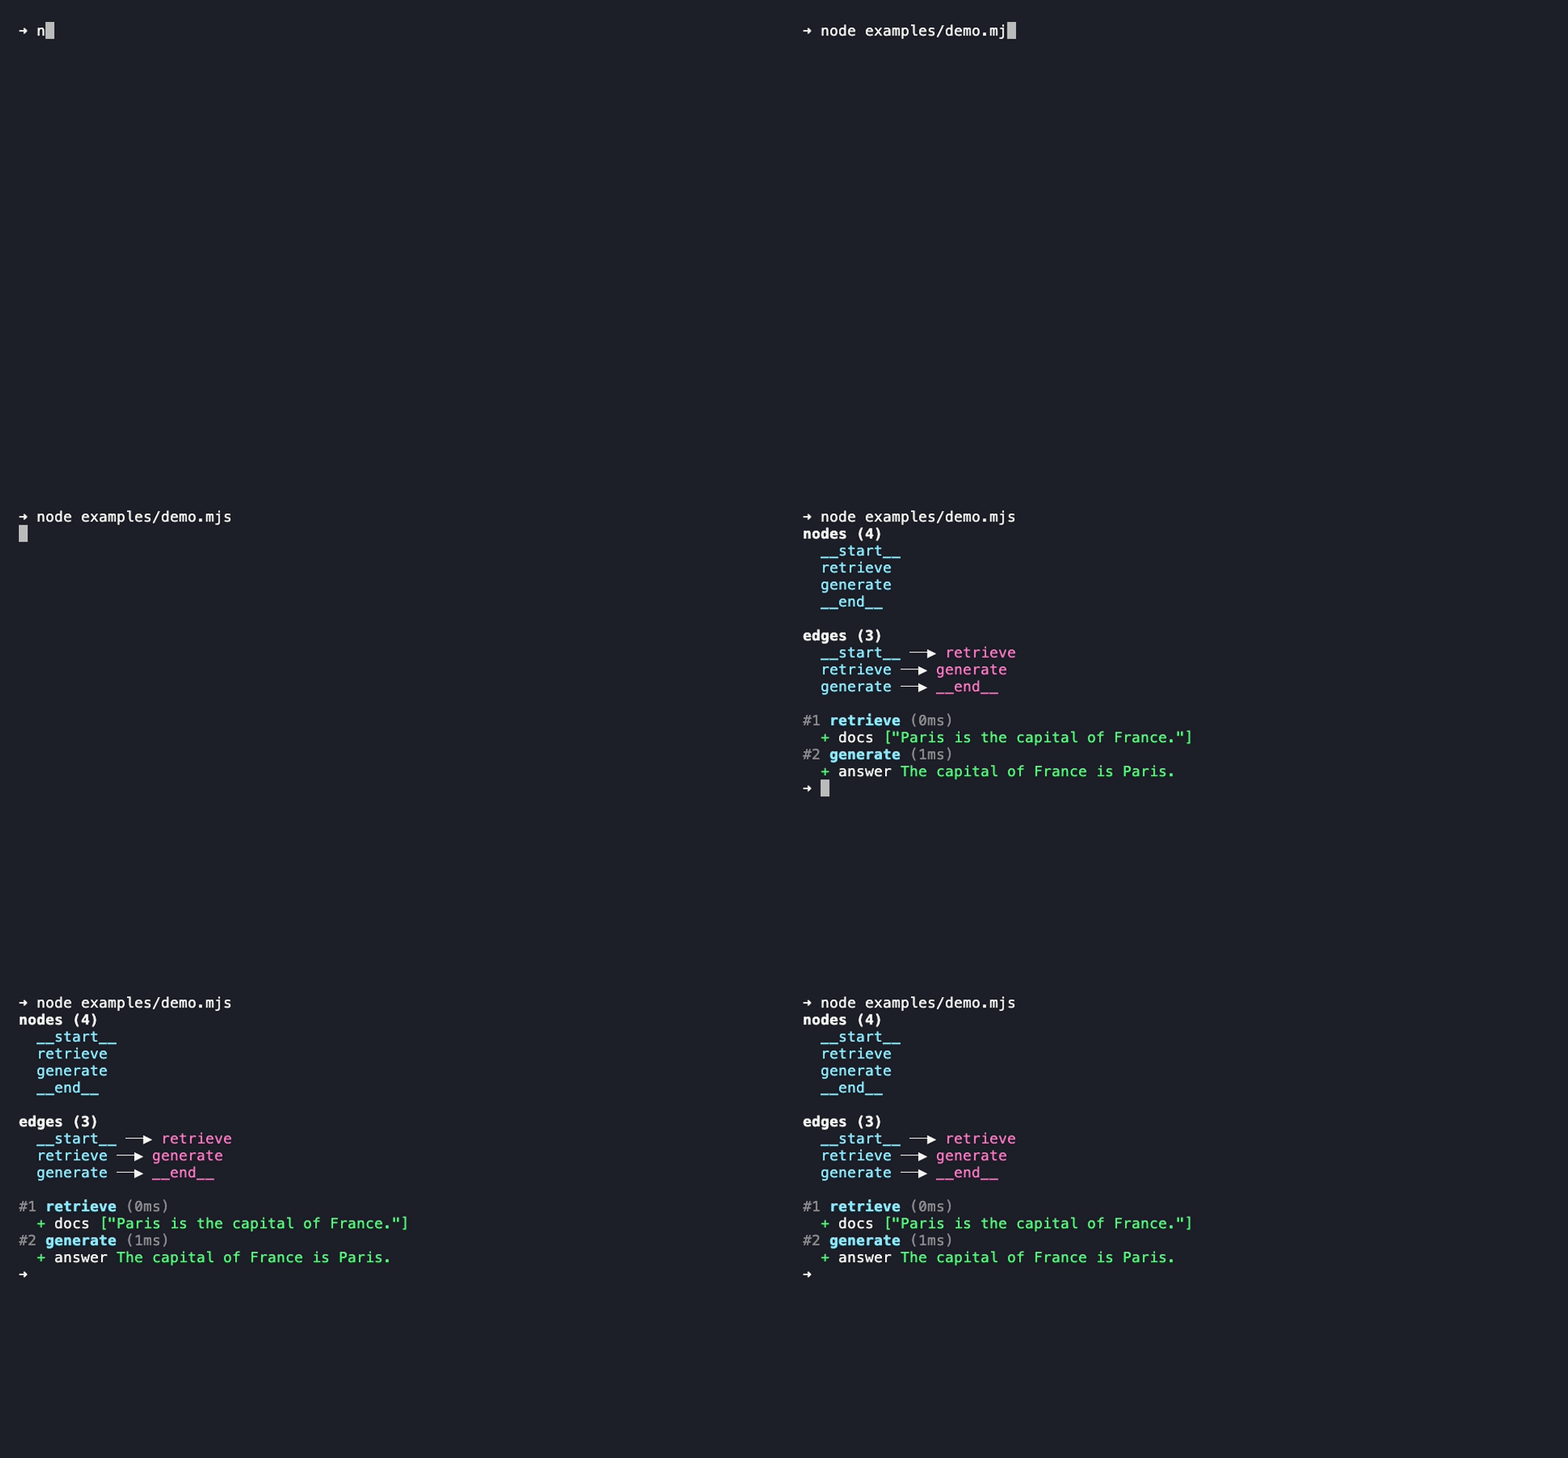
No LangSmith account. No network call. Just npm install and see what your agent is doing, in your terminal.
Why
LangGraph.js ships getGraph().drawMermaidPng(), but that calls out to the mermaid.ink API over the network to render — it doesn't work offline or in a locked-down CI runner, and it only gives you the static structure, not what happened during a run. The supported way to see live execution is LangSmith, a hosted product that needs an account and API key.
langgraph-inspector is for the 30 seconds before you want any of that: npm install, wrap your stream, see every node fire with a diff of what it changed.
Install
npm install langgraph-inspectorLive state diffs while your graph runs
import { logStream } from "langgraph-inspector";

const stream = await app.stream(input, { streamMode: "updates" });

for await (const chunk of logStream(stream)) {
  // logStream only observes — chunk is exactly what app.stream() yielded
}
#1 retrieve (142ms)
+ docs ["Paris is the capital of France", "..."]
#2 generate (890ms)
+ answer "The capital of France is Paris."Offline ASCII graph diagram
import { renderGraph } from "langgraph-inspector";

const drawable = app.getGraph(); // or await app.getGraphAsync()
console.log(renderGraph(drawable));
nodes (5)
__start__
retrieve
generate
fallback
__end__
edges (5)
__start__ ──▶ retrieve
retrieve ─┬─▶ generate (hasContext)
└─▶ fallback (needsMoreContext)
fallback ──▶ retrieve
generate ──▶ __end__Cyclic edges (retry/loop-back nodes, common in agent graphs) are printed as plain edges — this never recurses and never hangs.
CLI
Point it at a compiled JS module that exports your compiled graph (build your TS first):
npx langgraph-inspector ./dist/graph.js
npx langgraph-inspector ./dist/graph.js:app   # explicit export name
API
logStream(source, options?)
Wraps an AsyncIterable of LangGraph updates-mode chunks (Record<nodeName, partialState>) and yields the same chunks straight through, printing each node's step number, elapsed time, and a shallow diff against the accumulated state.
| option | default | |
|-----------|---------|---|
| diff | true | print what each node changed |
| timing | true | print elapsed ms/s per step |
| color | auto (TTY) | force ANSI color on/off |
| write | process.stdout.write | override the output sink |
renderGraph(drawableGraph, options?)
Takes the object returned by compiledGraph.getGraph() / getGraphAsync() and returns a plain-text ASCII diagram string.
diffState(before, after)
The shallow diff used internally by logStream — exported standalone in case you want to log changes some other way.
Caveats
logStream diffs the raw value each node returns, not the result after your channel reducers run. If a channel appends to a list (e.g. a messages reducer), the diff shows the node's raw contribution for that step — the same value streamMode: "updates" gives you — not the final accumulated list. That's a per-step debug trace, not a reducer simulator.
License
MIT © Mrinal Anand