
leaflet-graphicscale
v0.0.4
Published
A graphic scale for Leaflet.js that looks sharp
Downloads
4,547
Maintainers
 nerik
nerikReadme
DEPRECATED

leaflet-graphicscale
A animated graphic scale for Leaflet.js that looks sharp.
Demo : http://nerik.github.io/leaflet-graphicscale/demo/
Why ?
Because scale is an important component of a map, and it is often overlooked. Leaflet does have a default scale component (http://leafletjs.com/reference.html#control-scale), but honestly it's kind of boring.
This plugin provides a more interesting alternative with more customizability.
Contributing
Yes, please. I haven't had the time to make proper tests but they would be much needed. Also I've heard that there are some parts on the globe where they don't use the metric system, so if you'd like to add your measurement system be my guest (furlongs, wiffles, smoots, miles... http://en.wikipedia.org/wiki/List_of_humorous_units_of_measurement)
To run the demo locally (you'll need sass):
npm run devGetting started
Using minified files
<!DOCTYPE html>
<html lang="en">
<head>
    <meta charset="UTF-8">
    <link rel="stylesheet" href="leaflet.css" />
    <link rel="stylesheet" href="Leaflet.GraphicScale.min.css" />
</head>
<body>
    <div id="map"></div>
    <script src="vendor/leaflet.js"></script>
    <script src="../dist/Leaflet.GraphicScale.min.js"></script>
    <script>
        var map = L.map('map');
        L.tileLayer('...').addTo(map);
        var graphicScale = L.control.graphicScale([options]).addTo(map);
    </script>
</body>
</html>
See below for [options]
Compile from source (using browserify and sass)
npm install -S leaflet-graphicscaleSASS :
@import './node_modules/leaflet-graphicscale/src/Leaflet.GraphicScale.scss';JS :
require('leaflet-graphicscale');
var graphicScale = L.control.graphicScale().addTo(map);
Options
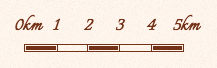
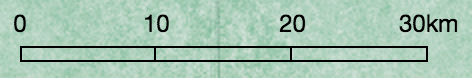
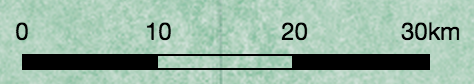
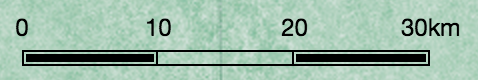
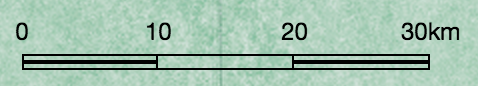
fill: false|'fill'|'hollow'|'line'
Default: false
- false/'nofill'
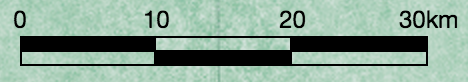
- 'fill'
- 'hollow'
- 'line'
doubleLine: false|true
Default: false
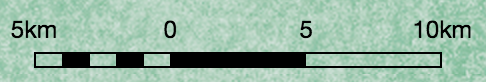
showSubunits: false|true
Default: false. Show smaller divisions on the left of the zero.
minUnitWidth: (Number)
Default: 30. The minimum width of a scale unit.
maxUnitsWidth: (Number)
Default: 240. The maximum width of the scale without subunits.
labelPlacement: 'auto'|'top'|'bottom'
Default: auto. Display the distance label on top/on the bottom of the scale bar. If set to auto, labels will be placed on top when the scale control is on the bottom of the map, and on the bottom when the scale control is on the top of the map (position parameter)
position:
See http://leafletjs.com/reference.html#control
updateWhenIdle:
See http://leafletjs.com/reference.html#control-scale