
loadflux
v1.0.3
Published
Lightweight server monitoring dashboard for Node.js - embed Grafana like metrics in your existing server
Downloads
132
Maintainers
 kritebh
Readme
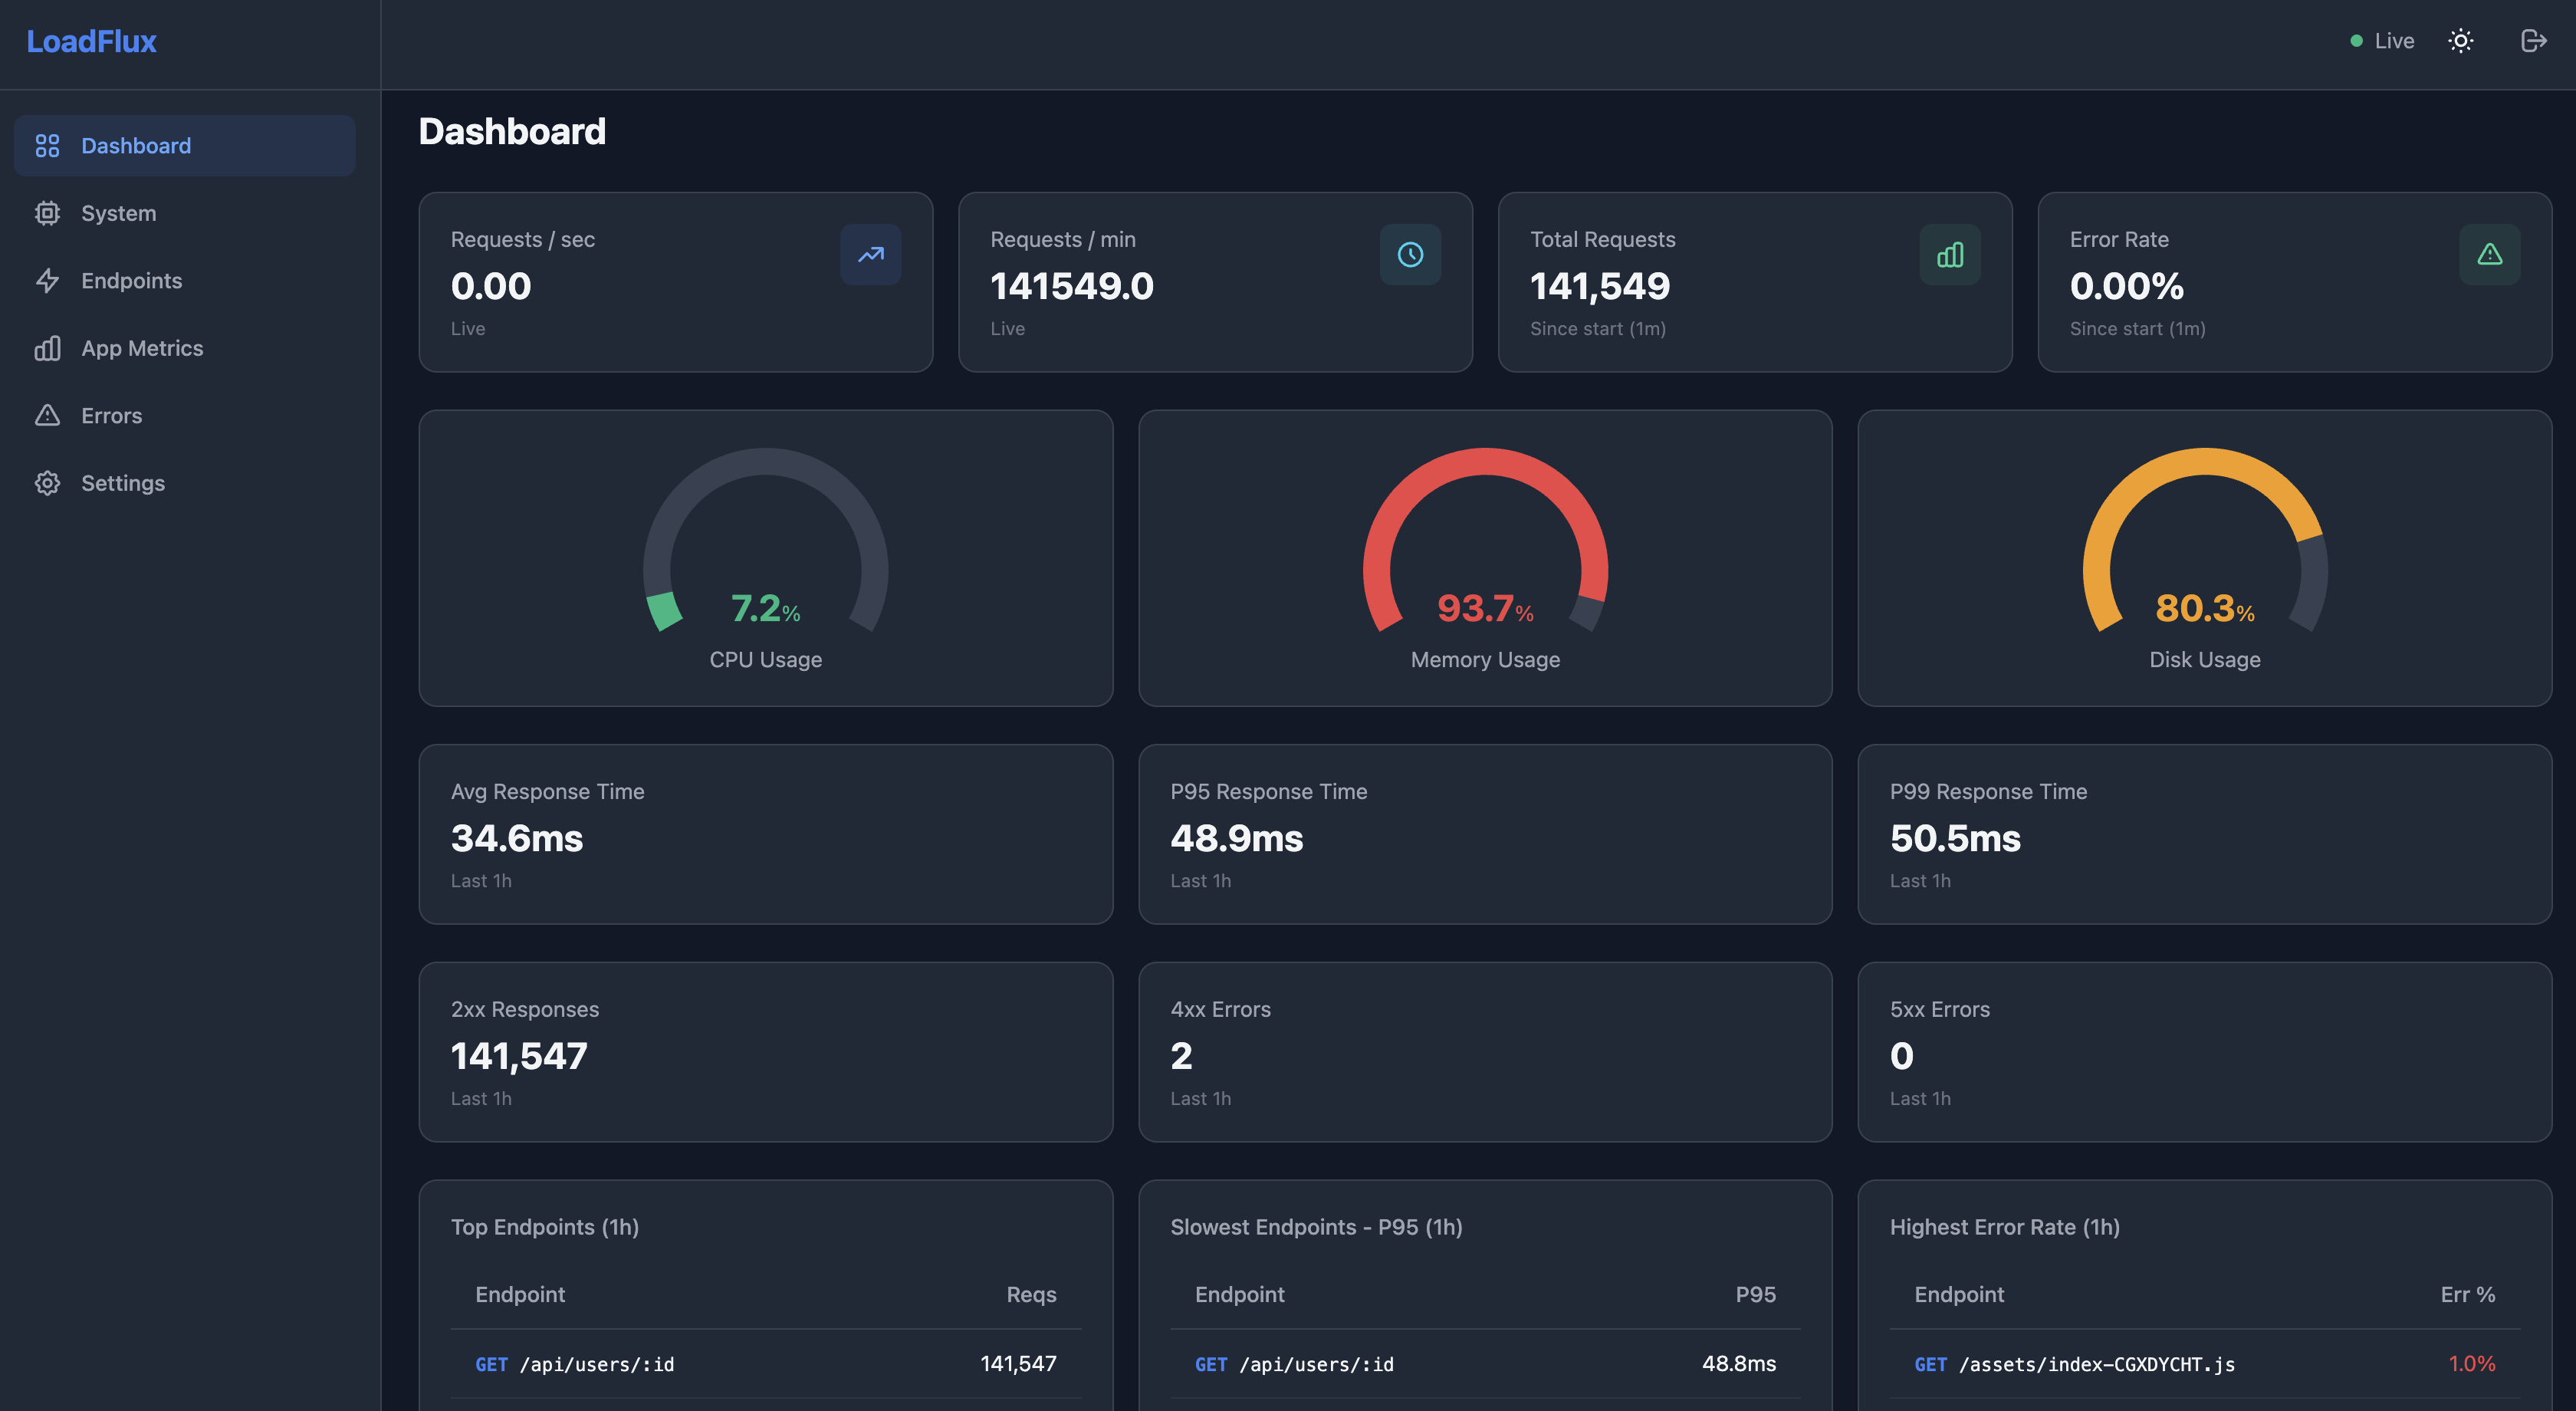
LoadFlux
Lightweight, embeddable server monitoring dashboard for Node.js. Drop a single middleware into your Express or Fastify app and get a full Grafana-like dashboard no separate process, no external services.
Features
- Real-time dashboard with live SSE updates every 2 seconds
- System metrics — CPU, memory, disk usage, network I/O
- App metrics — heap usage, event loop delay, GC pause time
- Endpoint analytics — request count, latency percentiles (p50/p90/p95/p99), error rates
- Error tracking — error log with status codes, durations, and stack traces
- Configurable retention and slow request thresholds
- Password-protected with bcrypt hashing and HMAC-SHA256 session tokens
- Dark/light theme with custom from/to date-time ranges (default rolling last hour) on historical pages
- Search on Endpoints and Errors; HTTP status filter on Errors
- SQLite by default (zero-config), optional MongoDB support
- JSON export for all metrics
- Works with Express, Fastify, and NestJS (via their underlying framework)
Quick Start
npm install loadfluxExpress
import express from "express";
import { loadflux } from "loadflux";

const app = express();

app.use(loadflux({
  auth: { username: "admin", password: "secret" }
}));

app.get("/api/users", (req, res) => res.json({ users: [] }));

app.listen(3000);
// Dashboard at http://localhost:3000/loadflux
Fastify
import Fastify from "fastify";
import { loadfluxFastify } from "loadflux";

const app = Fastify();

app.register(loadfluxFastify({
  path: "/monitor",
  auth: { username: "admin", password: "secret" }
}));

app.get("/api/users", async () => ({ users: [] }));

await app.listen({ port: 3000 });
// Dashboard at http://localhost:3000/monitor
Documentation
For detailed guides, all dashboard pages, configuration reference, and more — visit the full docs:
Configuration
loadflux({
  // Dashboard URL path (default: "/loadflux")
  path: "/loadflux",

  // Authentication credentials
  auth: {
    username: "admin",
    password: "secret",
  },

  // Database backend
  database: {
    adapter: "sqlite",             // "sqlite" (default) or "mongodb"
    connectionString: "./loadflux.db", // SQLite path or MongoDB URI
  },

  // Collection intervals
  collection: {
    systemInterval: 5000,    // System metrics polling (ms)
    aggregationWindow: 5000, // Request aggregation flush (ms)
  },

  // Data retention
  retention: {
    days: 90,                 // Keep metrics for N days
    cronExpression: "0 2 * * *", // Cleanup schedule
  },

  // Flag requests slower than this (ms)
  slowRequestThreshold: 500,

  // Routes to exclude from monitoring
  excludeRoutes: ["/health", "/ready"],

  // Optional: see Configuration Options in the docs for disableOnLocalhost,
  // listenHost (LOADFLUX_LISTEN_HOST / HOST), and trustProxy (LOADFLUX_TRUST_PROXY).
});
Environment variables:
LOADFLUX_USERNAME=admin
LOADFLUX_PASSWORD=secret
# LOADFLUX_LISTEN_HOST=0.0.0.0   # bind host hint for disableOnLocalhost
# LOADFLUX_TRUST_PROXY=1        # behind a trusted reverse proxy only
Requirements
- Node.js >= 22.0.0
Tech Stack
| Component | Technology | |-----------|------------| | Server metrics engine | TypeScript, better-sqlite3, node-cron | | Dashboard UI | React 19, Tailwind CSS, Chart.js | | Real-time updates | Server-Sent Events (SSE) | | Auth | bcryptjs + HMAC-SHA256 tokens | | Build | tsup (server), Vite (UI) |
Development
# Install dependencies
npm install

# Build everything (server + UI)
npm run build

# Dev mode (server with watch)
npm run dev

# Dev mode (UI with Vite dev server)
npm run dev:ui

# Run tests
npm test

# Run the example server (requires build first)
node examples/test-server.mjs