
logml
v2.1.2
Published
Development of an integrated logical modelling tool from the beginning steps of logical graph modelling to the final simulations outputs.
Downloads
53


Readme
Logml
![]()


Logml is a logical modelling framework based on the Boolean network theory where classic Boolean operators are replaced with fuzzy operators and where edges are tuned in order to adapt the speed and the strength of the signal that they transmit.
This tool is an adaptation of a methodology developed at Novadiscovery and freely accessible at:
Table of contents
Installation
Requirements
Fortran
For Linux, install gfortran
sudo apt-get update
sudo apt-get install gfortran
For OSX, Check that gcc (that comes with gfortran) has been correctly
installed. If not, install it via brew:
brew install gccNodeJS
Just install the last stable version from https://nodejs.org, or use Node Version Manager
Logml
To install Logml, just run the following command :
npm install -g logmlNow you can use the logml command:
logml --helpUsage
The Logml modelling and simulation tool takes a logical graph (.graphml format) as input. The tool will automatically parse the graph and generate the corresponding code. The logical model is then executed and results are plotted via a dedicated web interface.
Logical graph
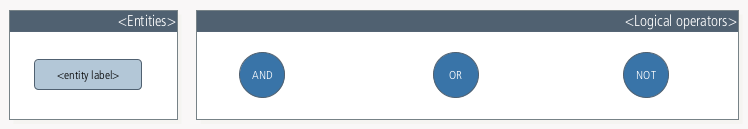
A logical graph is a special type of diagramatic structure in which entities are linked by logical relations symbolized by the logic operators: AND, OR and NOT.
We use for that the yED graph editor (which is freely available and runs on all major platforms), and the following graphical ontology:
Please find bellow an example of a logical graph, which will be used throughout this tutorial:
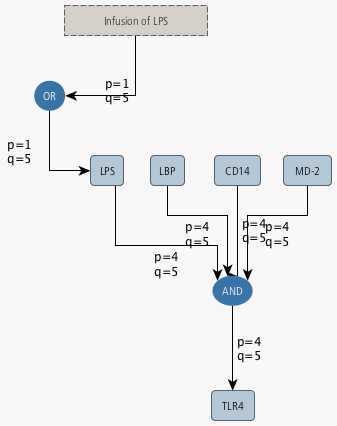
In order to ensure the proper functioning of Logml tool, the following instructions must be observed carefully during the creation of the logical graph in yED.
Annotation of nodes
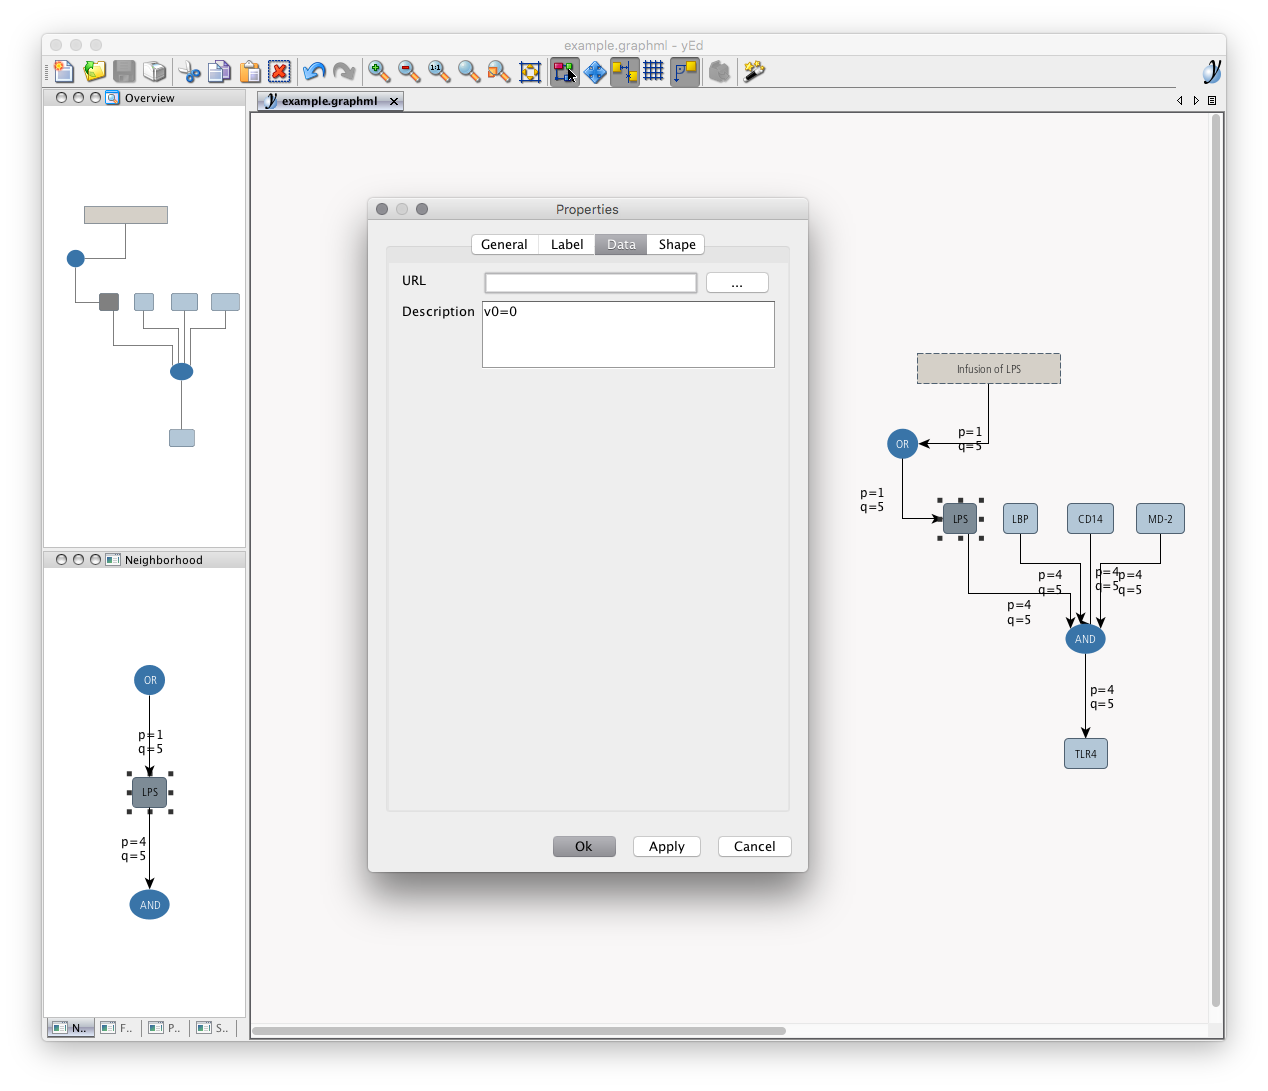
Each node of the graph (entity) need to be annotated (in yED, right click on the node > properties > data) with its qualitative initial values (integers only, and between 0 and 5). The node initial states are defined as following:
| Annotation | Meaning |
|:-----------|:----------|
| v0=5 | full |
| v0=4 | much more |
| v0=3 | much |
| v0=2 | few |
| v0=1 | fewer |
| v0=0 | none |
Please find below an example of node annotation:
Annotation of edges
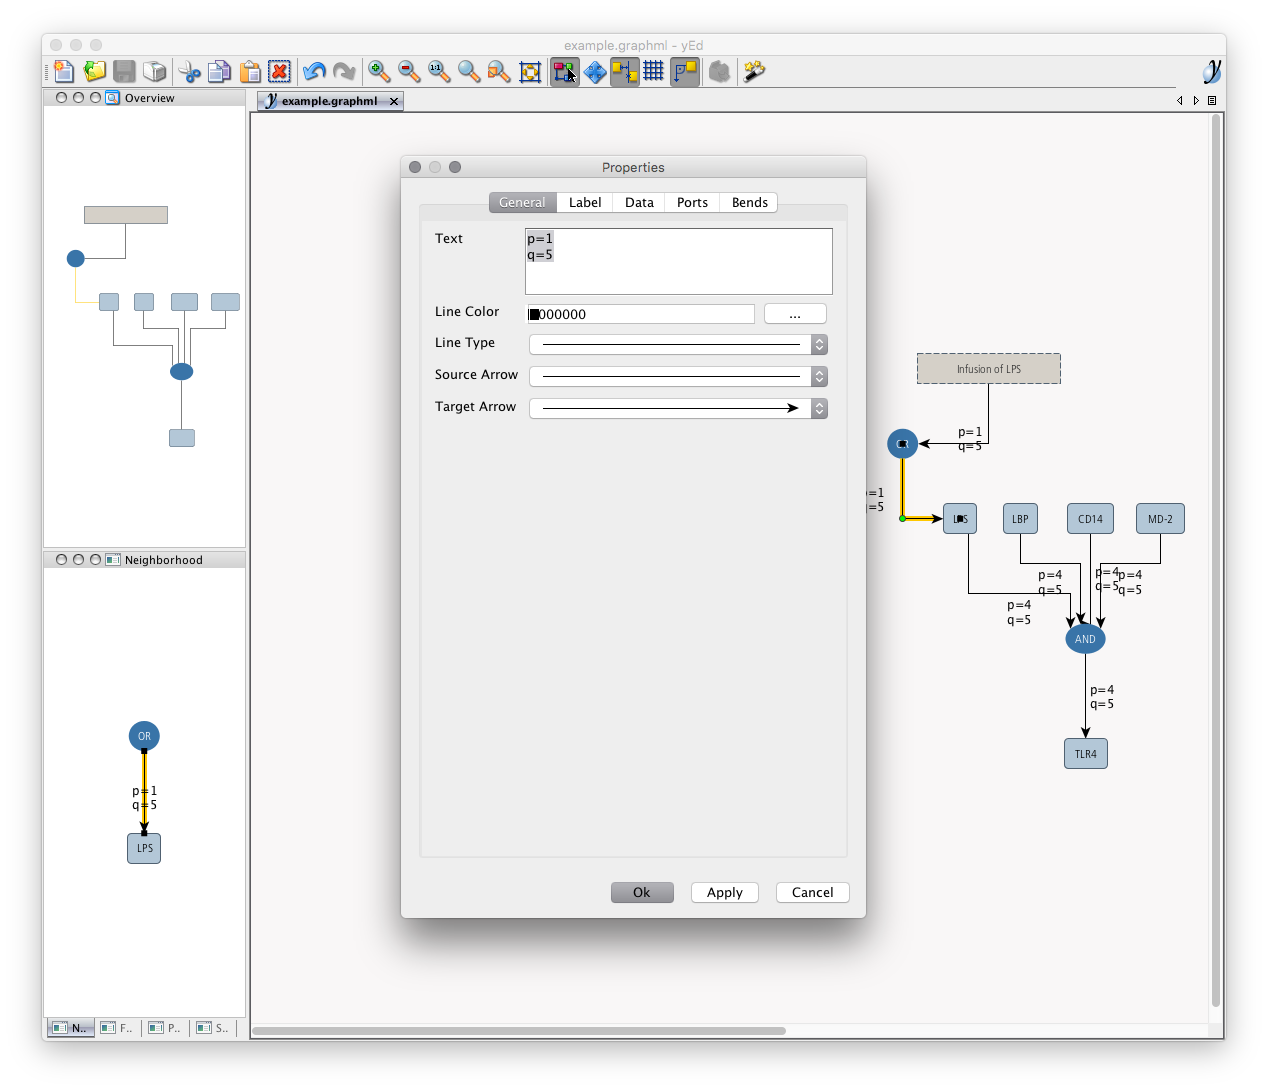
Each edge need to be annotated (in yED, right click on the edge > properties > general) with its qualitative p and q values (integers only, and between 0 and 5).
- For each edges,
pis the portion of its value which is updated at each iteration:
| Annotation | Meaning |
|:-----------|:--------------|
| p=5 | instantaneous |
| p=4 | faster |
| p=3 | fast |
| p=2 | slow |
| p=1 | slower |
| p=0 | down |
- For each edges,
qis the weakening of its value at each iteration:
| Annotation | Meaning |
|:-----------|:--------|
| q=5 | strong |
| q=4 | weaker |
| q=3 | weak |
| q=2 | faint |
| q=1 | fainter |
| q=0 | down |
Please find below an example of edge annotation:
Annotation of perturbed nodes
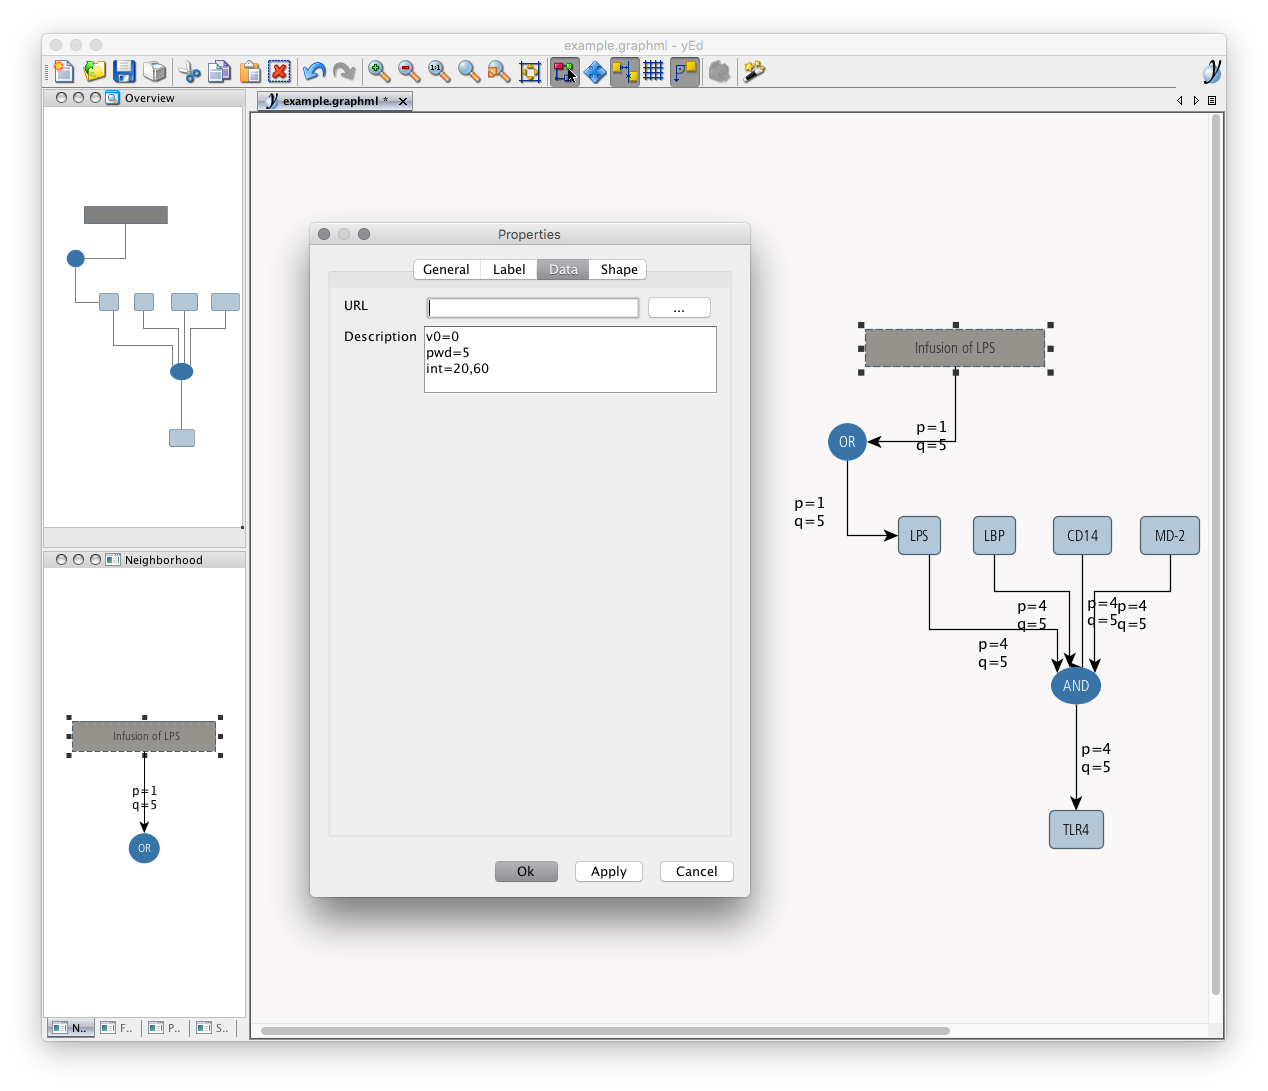
We can identify nodes that will be the subject of a disturbance by annotating (in yED, right click on the entity > properties > data) with:
- the strength of the disturbance applied to the node. The disturbed states will be defined as following (integers only, and between 0 and 5):
| Annotation | Meaning |
|:-----------|:----------|
| pwd=5 | full |
| pwd=4 | much more |
| pwd=3 | much |
| pwd=2 | few |
| pwd=1 | fewer |
| pwd=0 | none |
- the interval of iterations at which disturbances begin and end respectively. The intervals will be defined as following (integers only, and between 0 and 100):
int=20,60: in this case, perturbations will start after 20% of iterations, and will stop after 60% of iterations.
An example of disturbance annotation is presented in the following screenshot:
Run Logml
logml --help

    Usage: logml <input>

    Options:

		-h, --help             output usage information
    -V, --version          output the version number
    -d, --dolphin          Output an human readable version of the parsed graph
    -i, --iterations <n>   The number of iterations performed during a run
    -o, --output <folder>  The output folder
    -w, --watch            Watch for any changes and update the output (if input is a file)
    -v, --verbose          Print out informations on build (activate --verbose)
    -s, --server [port]    Create a plotting server (activate --verbose)
    -p, --open             Open url on start
    -f --faster            Prevent some size optimisation, faster, bigger (stronger)
    --output-edge          Output default vpop edges to csv stream
    --output-node          Output default vpop nodes to csv stream
    --input-edge <string>  Input vpop edges from csv file
    --input-node <string>  Input vpop nodes from csv file
    --silent               Prevent verbose mode
Example
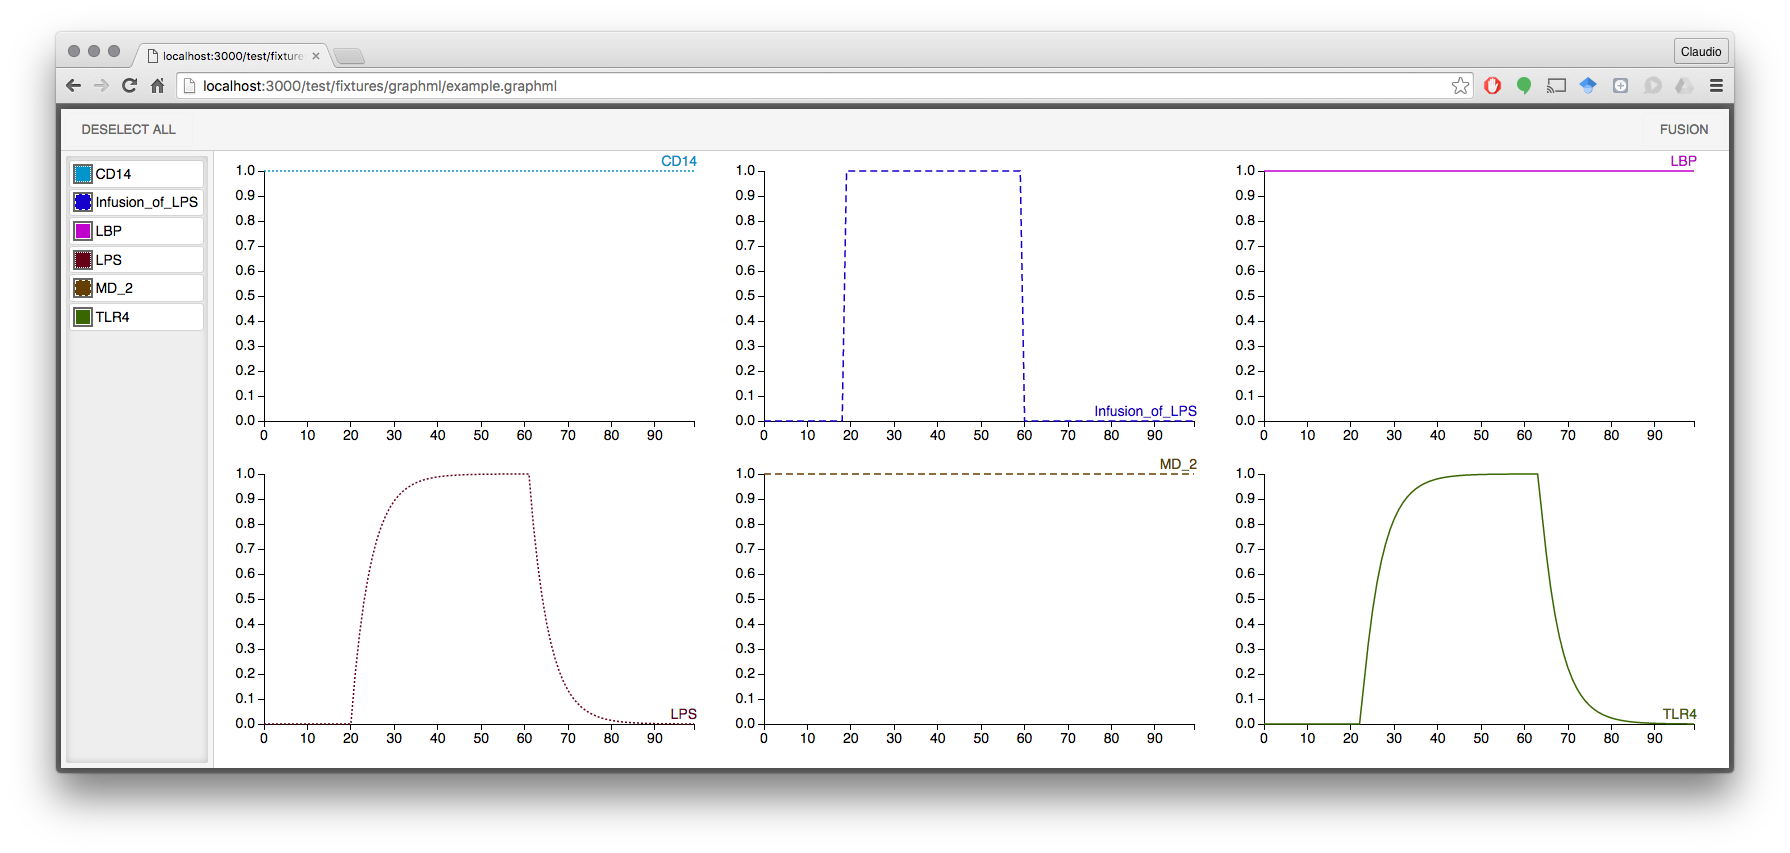
We used the following Logml command with the example.graphml:
logml example.graphml -o ./tmp -wsvpAnd we obtained the following output result:
License: MIT - Novadiscovery
![]()