
logview-local
v0.2.1
Published
An expandable local browser console for Node.js logs. Install globally, use across projects without code changes.

Maintainers
 mktdev
Readme
Logview Local

A browser console for your Node.js logs. Install once, use across projects.
Keep your existing console.log() calls and explore objects, arrays, errors, Maps, Sets, and circular references in an expandable local viewer. No imports or dependencies added to your projects.
Install globally
Requires Node.js 20 or newer and npm.
Install from npm:
npm install -g logview-localThis installs the logview-local command. No global project configuration or build step is required.
To upgrade, run npm install -g logview-local@latest. Stop any running collector with Ctrl+C, launch it again, and refresh the viewer to load the updated interface.
You can also install directly from the public GitHub repository:
npm install -g github:mk-tdev/logviewQuick start
Run the included sample:
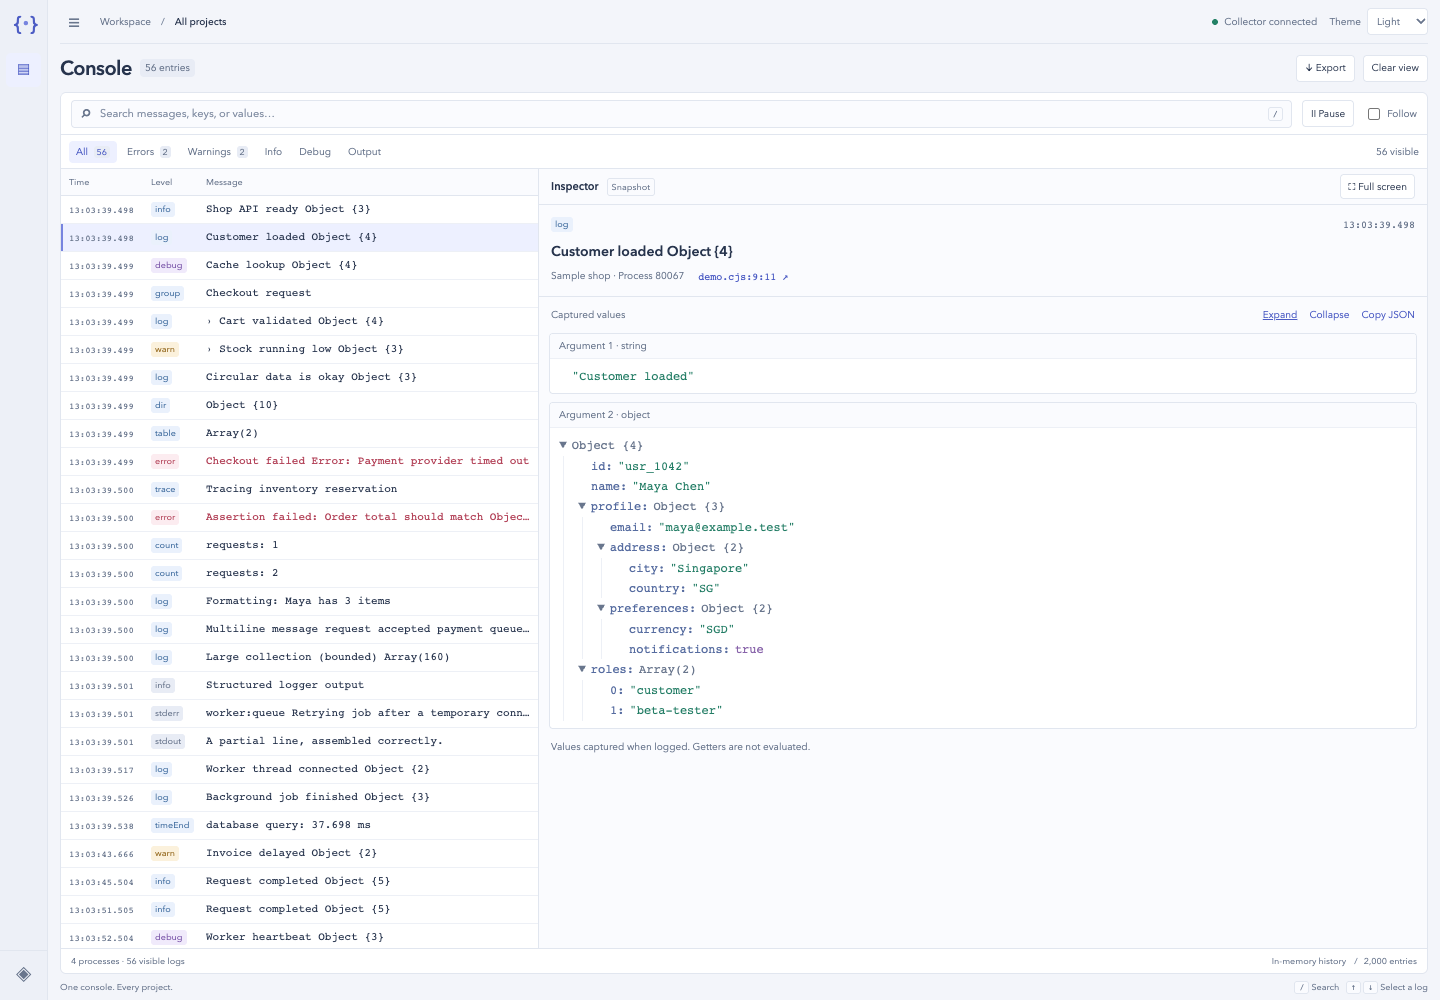
logview-local demoOpen http://127.0.0.1:4317. Select Customer loaded to explore nested objects. The inspector preserves values from the moment they were logged, even if the application changes them later.
In any existing Node project, prefix your usual command:
logview-local npm run devMore examples:
logview-local node app.js
logview-local npx tsx src/index.ts
logview-local npx nodemon app.js
logview-local run --project payments -- npm run dev
Use an explicit -- when you need to separate Logview options from command arguments:
logview-local run -- node app.js --port 3000
logview-local run --port 4320 --project api -- npm run dev
Your terminal output continues normally. The launcher starts a collector if needed or connects to an existing one. Only commands started through Logview are captured.
Multiple projects, one dashboard
Start a shared collector in one terminal:
logview-local serveThen run each project through Logview in its own terminal:
# From the API project directory:
logview-local run --project api -- npm run dev

# From the worker project directory:
logview-local run --project worker -- npm start
Both appear in the same dashboard. Filter by project or process in the sidebar.
A launcher connected to an existing collector returns its command's exit code and leaves the shared collector running. A launcher that starts its own collector keeps serving history after its command exits. Press Ctrl+C in the owning terminal to stop its command tree and collector. History disappears when the collector closes.
Commands and options
| Command | Purpose |
| --- | --- |
| logview-local <command> [args...] | Run and capture a command. |
| logview-local run -- <command> [args...] | Explicit run form. |
| logview-local serve | Start a shared collector without an application. |
| logview-local demo | Run the bundled sample and stream new logs. |
| logview-local demo -- --once | Emit the showcase once; keep owned collector history available. |
| logview-local --help | Show usage. |
| logview-local --version | Show the installed version. |
| Option | Default | Purpose |
| --- | --- | --- |
| --port <number> | 4317, or LOGVIEW_PORT | Collector port. |
| --project <name> | Current directory name | Label processes in the sidebar. |
Logview options go before the command or its -- separator. --port selects the collector's port, not your application's port. Open the localhost URL printed by the launcher; it does not automatically open your browser.
The bundled sample covers nested data, circular references, special JavaScript types, getters, errors with causes, assertions, timers, counters, groups, tables, format placeholders, multiline strings, JSON logs, raw stream output, partial lines, a forked process, and a worker thread. It requires no accounts, API keys, or extra packages.
Viewer
- Compact, single-line logs leave most of the desktop workspace to the inspector.
- Use ☰ in the top bar to minimize or restore the sidebar. Your desktop preference is remembered; mobile navigation opens as a drawer.
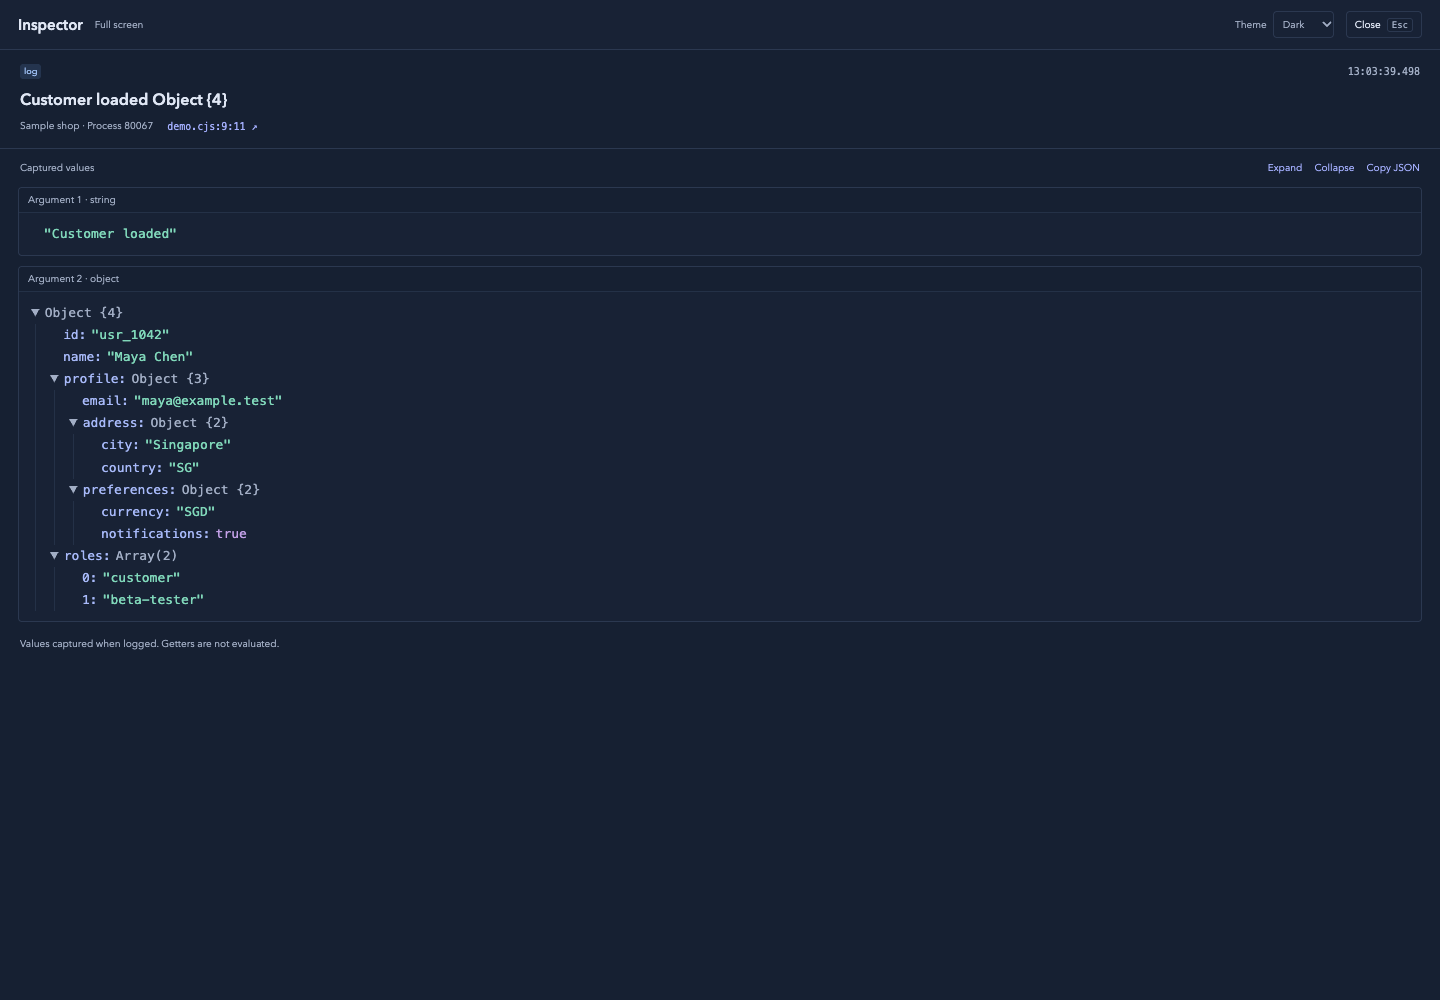
- Click Full screen in the inspector to inspect values across the whole viewport. Close or Esc returns to the console, preserving the selected entry and expanded branches.
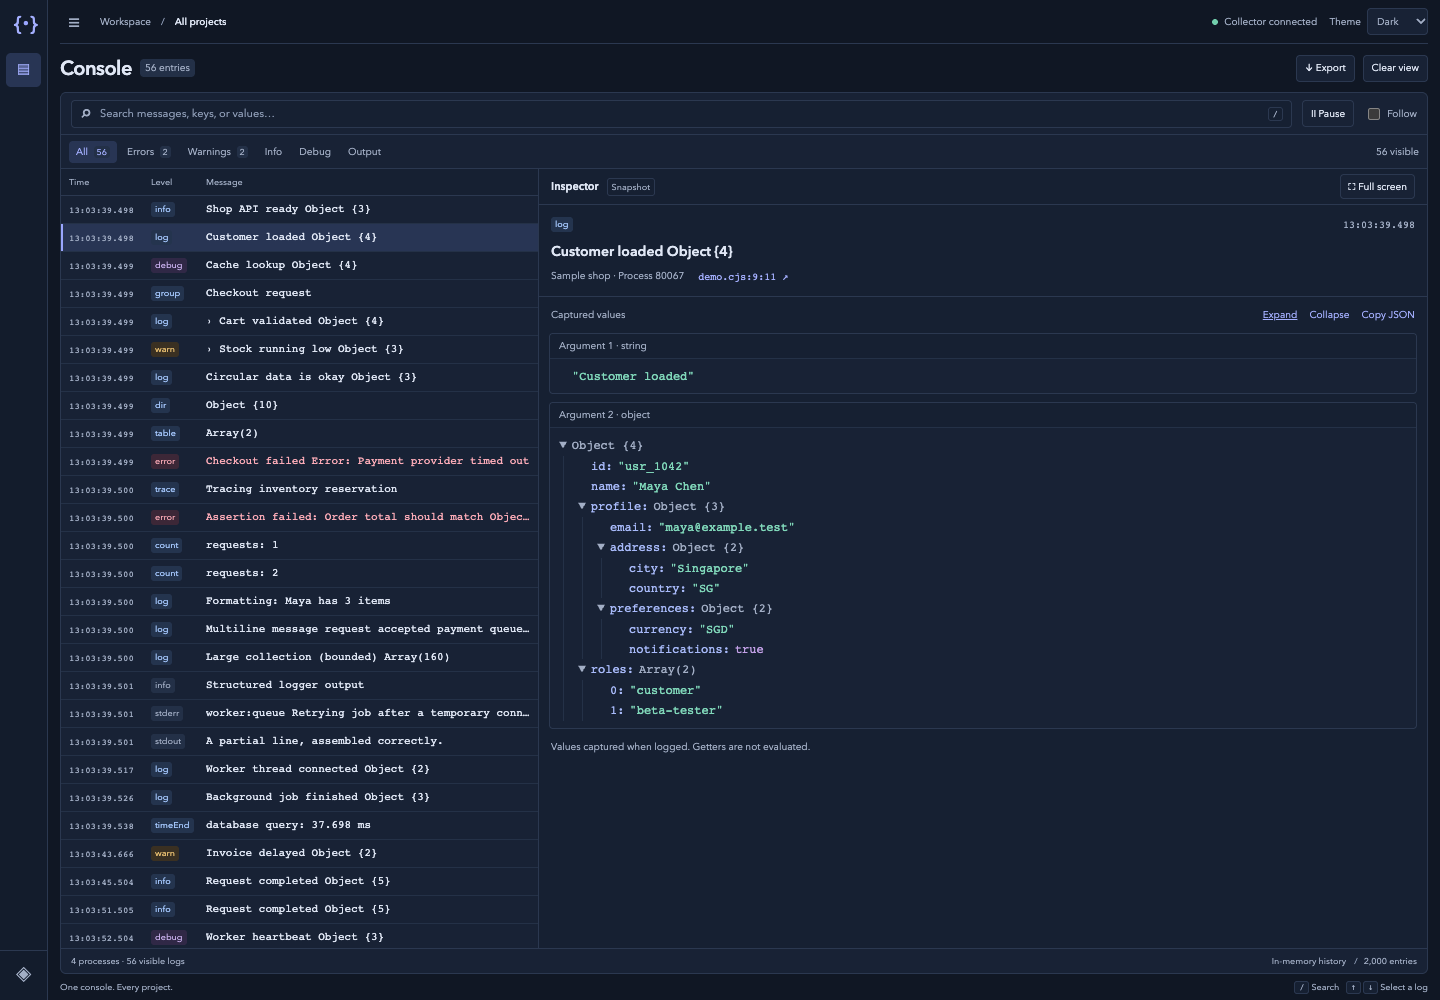
- Choose System, Light, or Dark in the theme selector. The choice is saved in your browser, and System follows operating system changes. Theme controls are also available in the full-screen inspector.
- Select a log and expand its captured arguments independently.
- Search keys and values, including captured descendants that are collapsed.
- Filter errors, warnings, info, debug, raw output, projects, and processes.
- Pause rendering while capture continues. Resume displays retained history.
- Disable Follow to keep your scroll position while logs arrive.
- Click a source location to open VS Code using its URL handler.
- Copy JSON copies the selected entry's typed argument snapshots; Export downloads the currently filtered entries as JSON.
- Clear view hides existing entries in this browser tab. Other viewers retain their history; reloading restores the collector’s retained entries.
- Press
/to search, then use arrow keys outside the input to select entries.
Dark mode
Full-screen inspector
How capture works
The launcher adds the bundled CommonJS capture module to NODE_OPTIONS=--require … only for the launched command. It preserves existing NODE_OPTIONS. The preload wraps console.* and the stdout/stderr write methods, calls the original methods, and sends bounded snapshots to the loopback collector. It is runtime instrumentation; your application source is unchanged.
Console values are captured before terminal formatting. Direct stdout/stderr writes are assembled into lines; valid JSON is parsed into expandable values. Numeric JSON log levels such as Pino's 30, 40, and 50 map to info, warning, and error. Existing debug output is captured when enabled by the app’s usual DEBUG setting. Capture does not enable disabled logs.
Node child processes and worker threads normally inherit the preload. Worker console forwarding is suppressed in parent capture to avoid duplicate entries. The viewer receives initial history and incremental events over Server-Sent Events; no WebSocket dependency or build step is needed.
Events are batched asynchronously, with a bounded synchronous helper at process exit for final delivery, including explicit process.exit(). Uncaught exceptions are observed with uncaughtExceptionMonitor; Node's crash behavior is preserved.
Limits of this first version
- Intended for local development. Automated integration and global-package tests pass on Linux with Node.js 20, 22, and 24, and macOS with Node.js 24. Windows is not yet verified.
- Capture applies to commands launched through Logview, not arbitrary processes already running on your machine.
- Logs written only to files, direct filesystem writes to file descriptors, native subprocess logs that bypass Node stream methods, and processes that remove the preload/environment are not captured.
- Worker threads that explicitly opt out of inherited preloads are unsupported. A parent that manually forwards a captured child's piped output can create duplicate text entries.
SIGKILLcannot flush final logs. Signal-terminated processes may remain marked connected until the collector restarts; there is no process-health polling yet.- The collector keeps up to 2,000 events or 16 MiB, whichever comes first, and 100 process records. Lifecycle events also count toward retention. Logs have no on-disk persistence; theme and sidebar preferences are stored locally in your browser.
- Each snapshot has a depth limit of 16, 100 children per object, 3,000 nodes, a 20,000-character per-string limit, and a shared 200,000-character string budget. Omitted data is marked. Search covers captured values only.
- Getters, custom inspectors, and
toJSONare not deliberately evaluated. Proxy reflection traps can execute. Private fields and inherited properties are not captured. Tables appear as expandable row arrays rather than a spreadsheet. - Snapshots represent capture-time values; they are not live object references. JSON copying/export preserves this typed snapshot format, including reference and truncation markers.
- Capture has serialization, stack collection, and network overhead. Queues are bounded to 500 pending events / 4 MiB; entries can be dropped under load or when the collector is unavailable. Exit-time delivery is best-effort and bounded to roughly 1.8 seconds. The interface is not virtualized for sustained high-volume logging.
- The server binds only to
127.0.0.1, checks Host/Origin, and authenticates ingestion with a session token. This is not an isolation boundary against other applications running as your local user. Captured values may contain secrets; there is no automatic redaction.
Develop and test
git clone https://github.com/mk-tdev/logview.git
cd logview
npm run check
npm test
npm run test:package
npm run demo
There are no runtime or development dependencies to install. The package smoke test builds a tarball, installs it into a temporary global npm prefix whose path contains spaces, invokes the actual logview-local executable, captures an unrelated project, and runs the bundled demo. Temporary files are removed afterward.
For local development, npm link makes your checkout available as the global logview-local command. See PUBLISHING.md for registry release instructions and CHANGELOG.md for releases.
Integration tests launch real Node processes against an ephemeral loopback collector. They cover capture-time snapshots, console/stdout deduplication, explicit exits and crashes, child and worker capture, authentication and retention, live streaming, CLI reuse, the sample app, and an unavailable collector.
Source files:
bin/logview.cjs       Launcher and command lifecycle
lib/capture.cjs       Automatically preloaded capture hook
lib/snapshot.cjs      Bounded, typed object snapshots
lib/deliver.cjs       Exit-time delivery helper
lib/server.cjs        Local collector, retention, and SSE stream
web/                 Buildless browser viewer
examples/            Ordinary Node.js sample apps
test/                Node integration tests
The typed snapshot serializer was adapted from Object Inspector (MIT). Logview includes its own copy and runs independently. See LICENSE.