
magic_events_dashboard
v0.1.3
Published
The magic_events dashboard for Vue 3: are events leaving PostgreSQL, what waits and why, and which consumer is behind — headless, or ready-made.

Maintainers
 rsansores
Readme
magic_events_dashboard
The dashboard of magic_events, for Vue 3: whether events are leaving PostgreSQL, what waits in the outbox and why, what was set aside, and which consuming system is behind. One green banner when events flow, which is most of the time.
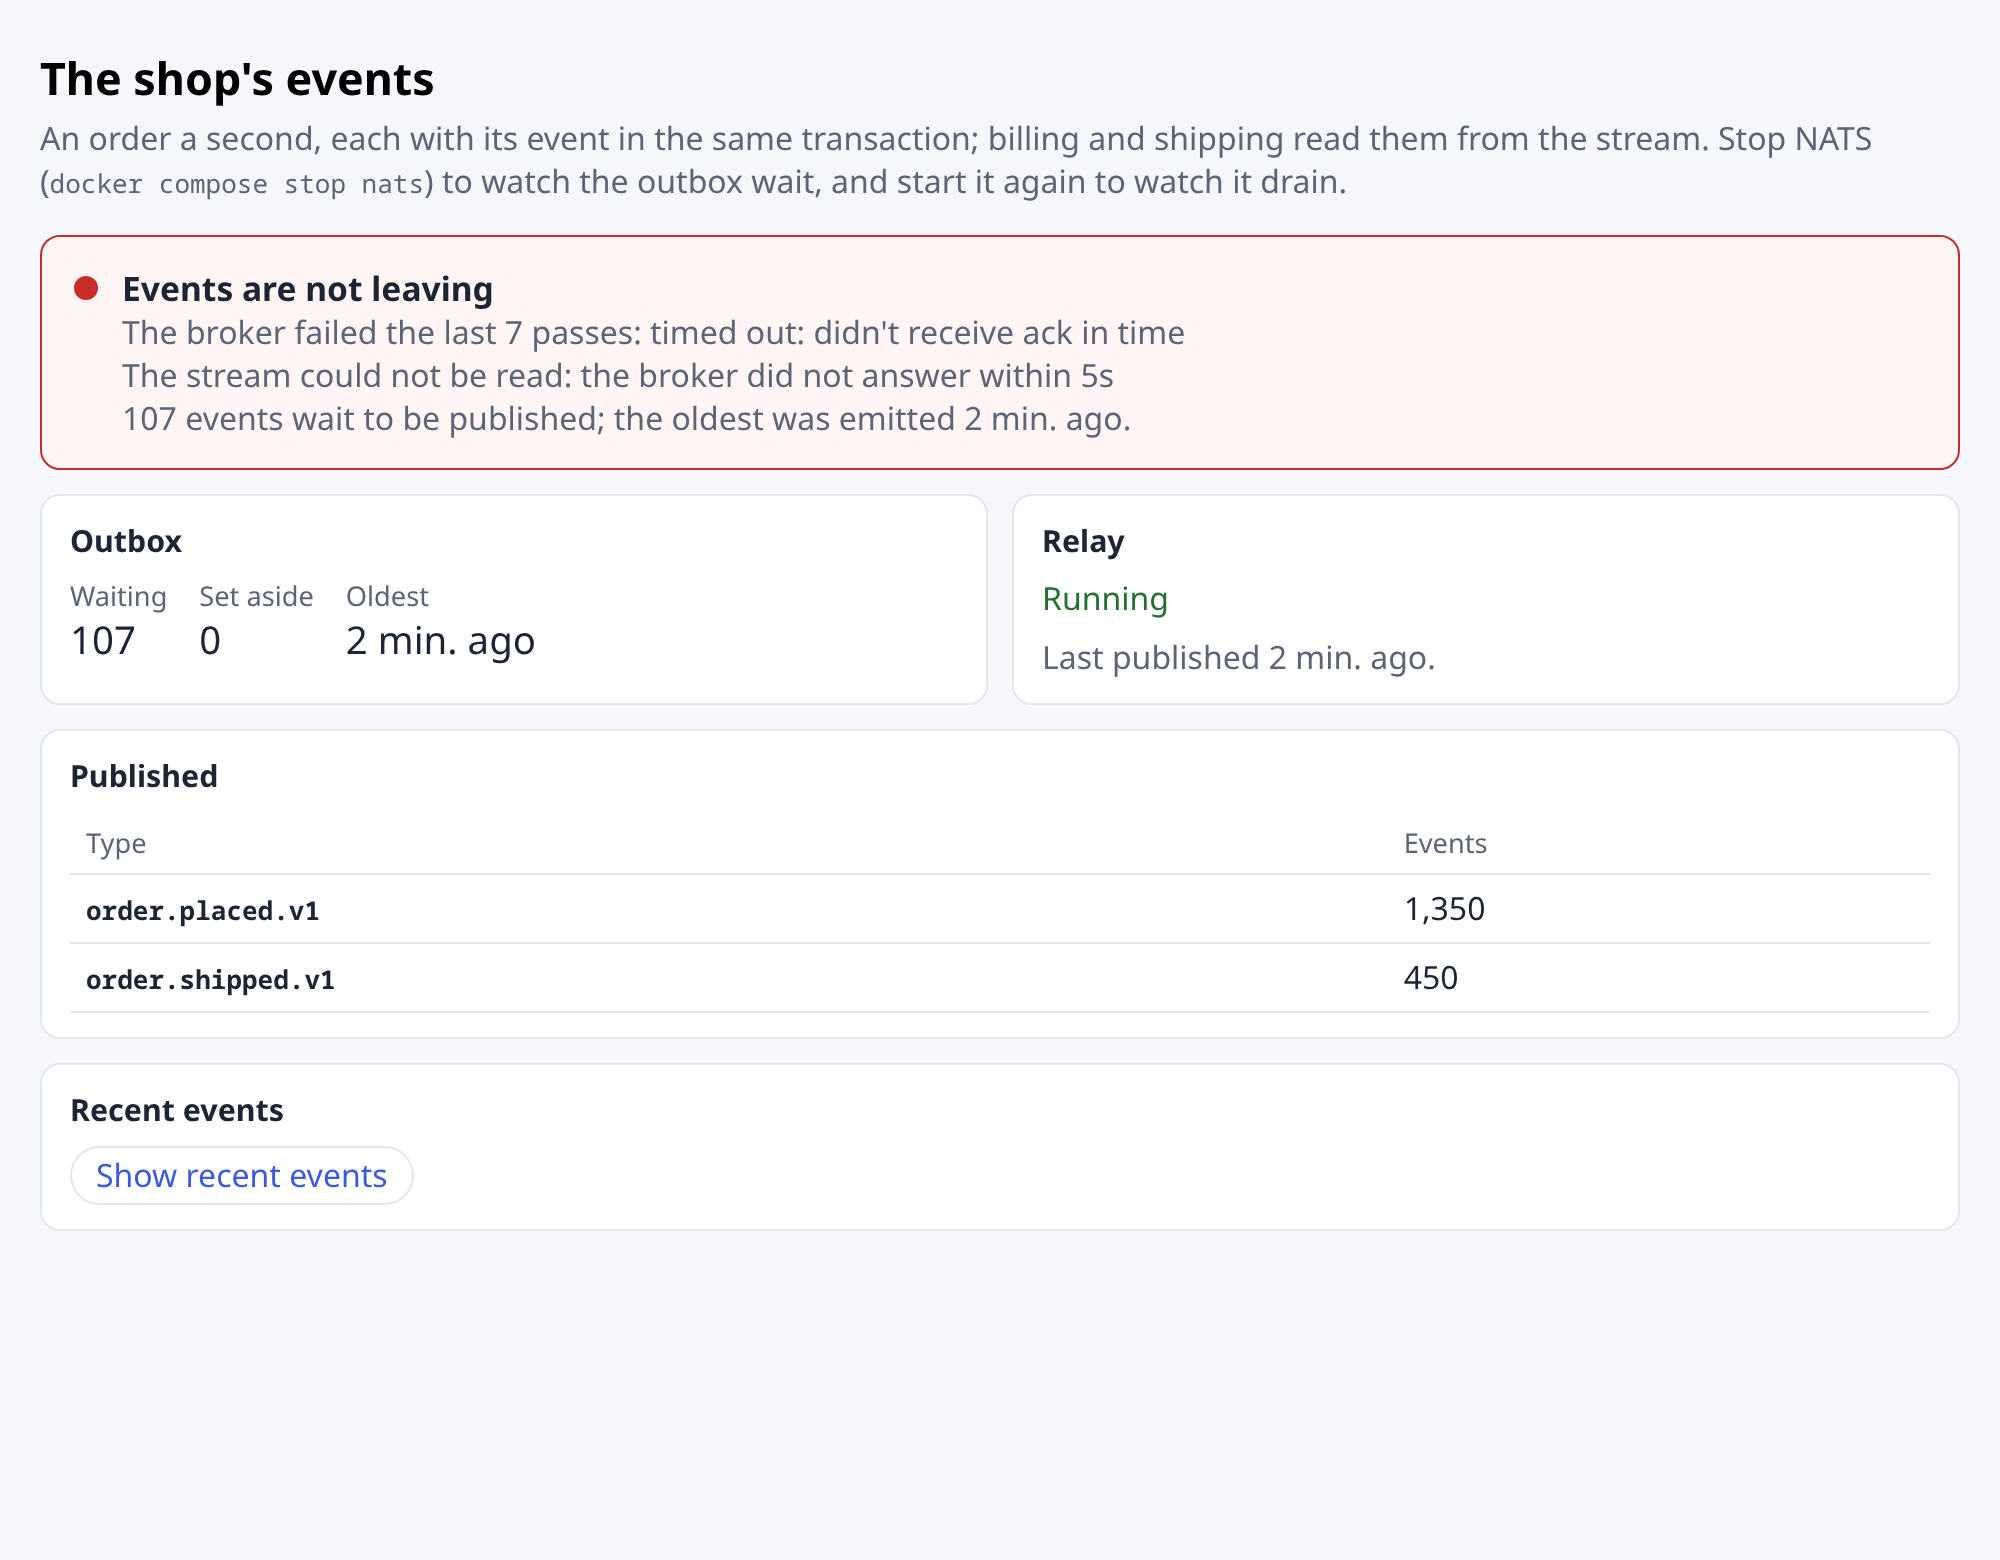
It knows no URL. Your server asks the relay (Events::status, and
Events::recent if you show recent events) from its own handlers, behind its
own authorization, with the Filter the caller may see, and returns the
answers as they are. You hand the dashboard the functions that fetch them.
pnpm add magic_events_dashboardIt needs Vue 3.5 or later, and is ESM only: import it (a bundler does; a
CommonJS require finds no entry point).
The ready-made dashboard
<script setup lang="ts">
import { EventsDashboard, type Recent, type Status } from 'magic_events_dashboard'
import 'magic_events_dashboard/styles.css'

// An error answer is an error: the dashboard says why it has nothing to show.
async function get<T>(path: string): Promise<T> {
  const answer = await fetch(path)
  if (!answer.ok) throw new Error(`${answer.status} ${answer.statusText}`)
  return (await answer.json()) as T
}
const fetchStatus = () => get<Status>('/admin/events/status')
const fetchRecent = () => get<Recent>('/admin/events/recent')
</script>

<template>
  <EventsDashboard :fetch-status="fetchStatus" :fetch-recent="fetchRecent" />
</template>
| Prop | What it is |
| ------------------------ | ---------------------------------------------------------------------------------------------- |
| fetchStatus | fetches Events::status's answer from your handler |
| fetchRecent | fetches Events::recent's answer; without it, no recent events are shown |
| every | how often the status is fetched again, in ms (10 s); 0 fetches it once |
| lagAfter, stuckAfter | how long an event may wait in the outbox before the events are lagging (1 min), stuck (15 min) |
| consumerLag | how many pending messages make a consumer "behind" (1,000) |
| locale, messages | see below |
The banner's mood is the worst of what it finds: down when no process
runs the relay, the broker fails it, or the stream cannot be read; stuck
when the broker refused an event for good (it is set aside until
Events::unpark), or the oldest event waited past stuckAfter;
lagging when it waited past lagAfter, or a consumer is behind; ok
otherwise. Each reason is a sentence under the title.
An answer carries the version of its JSON (contract): one this dashboard
does not read is refused, with a message that says so, rather than drawn
wrong. Every time is measured against the database's clock in the answer
(at), moved on by the time passed in the page — never against the
browser's clock.
Views and what they show
A status for Filter::all() — an operator's view — carries the consumers
and the counts of what was published. A status for a narrower filter (one
store's subjects, say) leaves both out, and the dashboard leaves out their
sections: a consumer's lag is the whole stream's, and the counts are kept
by type alone, so neither can be narrowed by subject.
Its look
Every colour and size is a CSS variable; set them on .med or any ancestor:
--med-font (a font family), --med-fg, --med-muted, --med-bg,
--med-card, --med-border, --med-accent, --med-ok, --med-warn,
--med-danger, --med-ok-soft, --med-warn-soft, --med-danger-soft,
--med-radius, --med-gap. The defaults keep every text at a contrast of
4.5:1 or more against what it is drawn on. They are a light scheme and do not
follow prefers-color-scheme: a host with a dark theme sets the variables for
it, which is also what keeps the contrast.
The same, with your own components
<EventsDashboard> takes your colours, font and spacing (its variables,
above), but its markup and layout are its own. An app with a design system of
its own — its own cards, tables, alerts — does not use the component: it calls
useEventsDashboard in a component of its own, and draws every part with its
own pieces. The package gives it the state and the words; nothing of its look
comes along, and its stylesheet is not imported.
<script setup lang="ts">
// Your component: your Alert, StatCard and DataTable, the dashboard's state.
import { useEventsDashboard } from 'magic_events_dashboard'
import { Alert, DataTable, StatCard } from '@/components/ui'
import { fetchEventsStatus } from '@/api/events'

const { banner, status, consumers, error, t } = useEventsDashboard(fetchEventsStatus)
</script>

<template>
  <Alert v-if="error" tone="danger">{{ error }}</Alert>
  <template v-else-if="banner && status">
    <Alert :tone="banner.mood === 'ok' ? 'success' : 'danger'" :title="banner.title">
      <p v-for="line in banner.lines" :key="line">{{ line }}</p>
    </Alert>
    <StatCard :label="t('outbox.pending')" :value="status.outbox.pending" />
    <DataTable v-if="consumers" :rows="consumers" :columns="['name', 'pending', 'ackPending']" />
  </template>
</template>
What it hands you:
import { describeReason, useEventsDashboard } from 'magic_events_dashboard'

const dash = useEventsDashboard(fetchStatus, { every: 10_000 })
dash.error.value // why the status cannot be shown (a fetch failed, another contract), or null
dash.stale.value // why the last fetch failed while an older answer is shown, or null
dash.speech.value // how to say things; null until an answer that reads has come
dash.banner.value // { mood: 'ok' | 'lagging' | 'stuck' | 'down', title, lines }
dash.health.value // { mood, reasons }: each reason a fact, worst first
dash.status.value // the answer itself, once it reads
dash.consumers.value // furthest behind first; null for a narrowed view
dash.published.value // { byDay, byType }; null for a narrowed view
dash.refresh() // fetch now
useEventsDashboard fetches, and keeps the database's time moving, while it
is called in a component's setup or an effect scope; called anywhere else it
has nothing to tie a timer to, and fetches nothing until refresh().
Over your own data layer
An app that reads its server through a data layer — vue-query, Pinia, a
socket — reads the relay's answers the way it reads everything else, with its
own cache, polling and errors, and hands them to useEventsView. It fetches
nothing: it works out the same state from whatever answer it is given now,
and follows the next.
import { useQuery } from '@tanstack/vue-query'
import { useEventsView } from 'magic_events_dashboard'

const status = useQuery({
  queryKey: ['events', 'status'],
  queryFn: fetchEventsStatus,
  refetchInterval: 10_000,
})
const recent = useQuery({
  queryKey: ['events', 'recent'],
  queryFn: fetchEventsRecent,
  refetchInterval: 10_000,
})

const view = useEventsView(status.data, { recent: recent.data })
view.error.value // another contract, or a time that does not read; null while there is no answer
view.banner.value // as above, and health, status, consumers, published, speech
view.recent.value // the recent events, newest first; null without an answer that reads
view.recentError.value // a recent answer of another contract, or null
A failed or pending read is the data layer's to say (status.isError,
status.isPending): useEventsView has no fetch of its own to fail.
Everything that does not need Vue — the types, healthOf, consumersOf,
publishedByDay, publishedByType, recentOf, the sentence functions and
translator — is also in magic_events_dashboard/core.
Languages
English is built in. With vue-i18n in the host, the dashboard follows its
global locale on its own (vue-i18n is not a dependency); pin one with
locale (pt-BR and pt_BR both read as pt-BR, and fall back to pt),
and add a language, or reword any message, with messages — English stands
in for a key a locale lacks. A message with a count has a form per plural
category of the locale (Intl.PluralRules), other always:
{
  en: { 'mood.ok': 'All events delivered to the stream' },
  fr: { 'reason.parked': { one: '{n} événement mis de côté.', other: '{n} événements mis de côté.' } },
}
The keys are in src/core/i18n.ts.
Versions
The dashboard reads the JSON of the crate of the same version: release and
upgrade them together. A field the crate adds is ignored. The contract
number (status::CONTRACT) changes when a field is removed or renamed, or
comes to mean something else, and the dashboard refuses an answer of a
contract it does not read. Its types are generated from the crate's
(src/core/contract/types.ts), and the crate's tests write what it answers
into src/core/contract/fixtures/, which the dashboard's type-check holds
field for field to those types and its tests read.
License
MIT OR Apache-2.0.