
magic_sync_dashboard
v0.5.1
Published
The magic_sync dashboard for Vue 3: is every replica holding what it should, which tables are on their way, and what waits for a fix — headless, or ready-made.

Maintainers
 rsansores
Readme
magic_sync_dashboard
The dashboard of magic_sync, for Vue 3: whether every replica holds what it should, which tables are on their way, and what waits for a fix. One green banner when everything is in sync, which is most of the time.
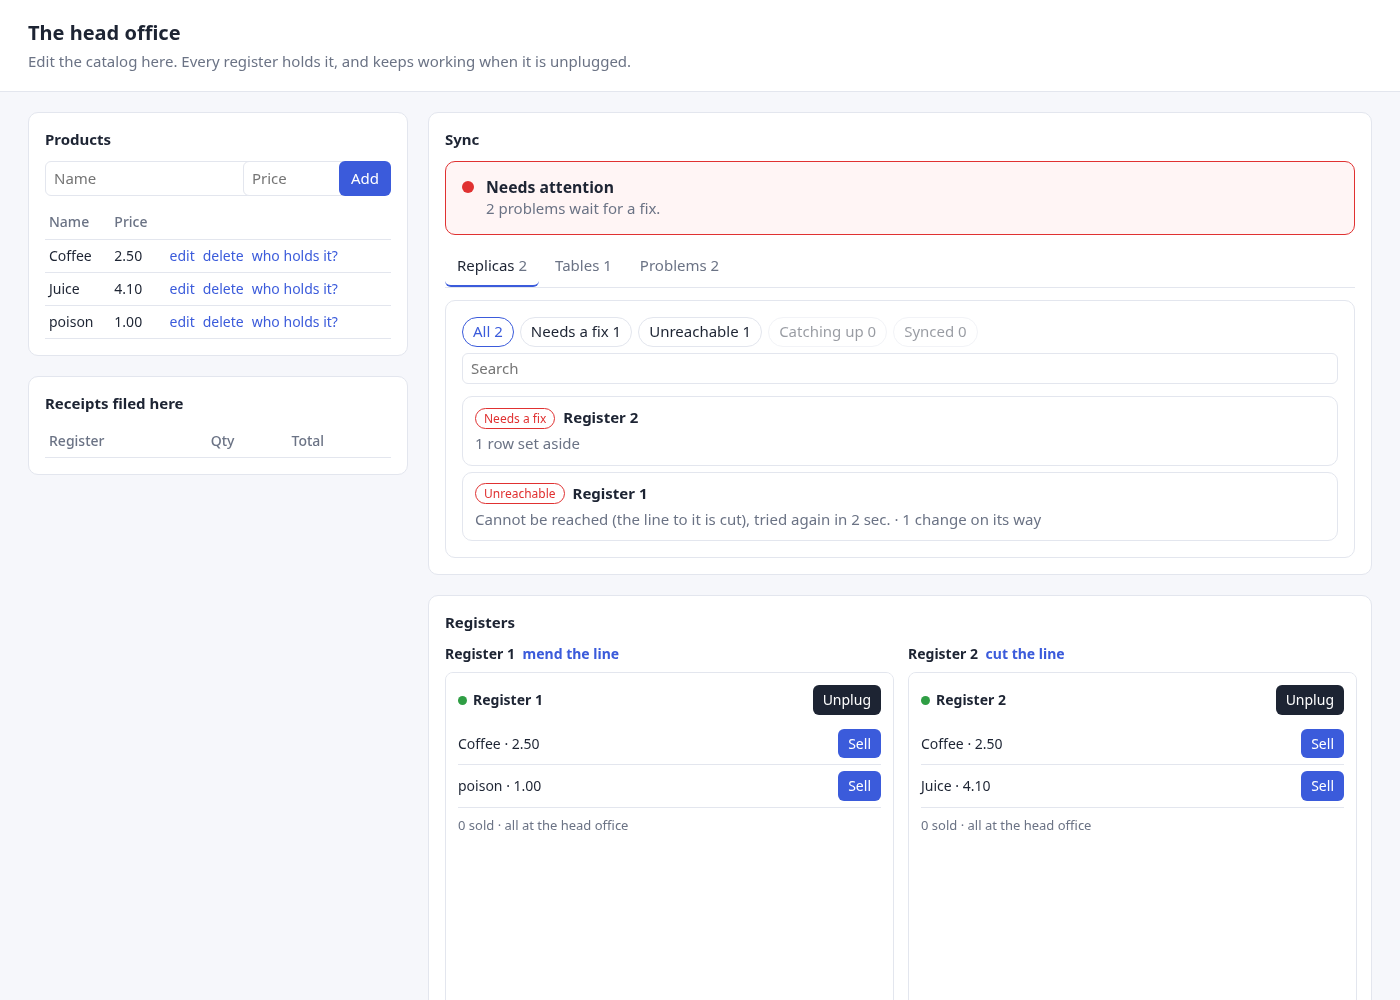
It fetches nothing. Your server asks the engine (Engine::overview,
Engine::states, Engine::listing, Engine::progress,
Engine::row_progress) from its own
handlers, behind its own authentication, over the replicas the caller may
see, and returns the answers as they are. The dashboard draws them.
pnpm add magic_sync_dashboardIt needs Vue 3.5 or later, and is ESM only: import it (a bundler does; a
CommonJS require finds no entry point).
The ready-made dashboard
<script setup lang="ts">
import { ref } from 'vue'
import {
  SyncDashboard,
  type Listing,
  type Overview,
  type Progress,
  type ReplicaState,
  type States,
} from 'magic_sync_dashboard'
import 'magic_sync_dashboard/styles.css'

const overview = ref<Overview | null>(null)
const states = ref<States | null>(null)
const listing = ref<Listing | null>(null)
const progress = ref<Progress | null>(null)
const replica = ref<Listing | null>(null)
const selected = ref<string | null>(null)
const filter = ref<ReplicaState | null>(null)
const offset = ref(0)
// Fetch `overview` and `states` every few seconds, `listing` for `filter` and `offset`,
// and, for `selected`, `progress` and `replica` (a listing over it alone), from your own endpoints.
</script>

<template>
  <SyncDashboard
    v-model:selected="selected"
    v-model:filter="filter"
    v-model:offset="offset"
    :overview="overview"
    :states="states"
    :listing="listing"
    :progress="progress"
    :replica="replica"
    :names="{ '0190a1b2-…': 'Register 1' }"
    :labels="{ products: 'Products' }"
  />
</template>
| Prop | What it is |
| --------------------------------- | ------------------------------------------------------------------------------------------------------------- |
| overview | Engine::overview's answer; null while loading |
| states | Engine::states's answer: a tile of every replica; without it, a tile of each of the overview's worst |
| listing | Engine::listing's answer for filter and offset; without it, the overview's worst are listed (see below) |
| progress | Engine::progress's answer for the selected replica |
| replica | Engine::listing's answer over the selected replica alone (Scope::Replicas(&[id])): its row, on any page |
| names, labels | your names for replicas and tables: a map, or a function |
| v-model:selected | the replica being looked at; keep it in your URL if you like |
| v-model:filter | the state the replicas are listed in (null: all of them) |
| v-model:state | the counter picked: the tiles and the replicas that need attention narrowed to it, the engine's or yours |
| v-model:offset, pageSize | where the page of the listing begins, and the limit you ask it for (50) |
| levels, placeOf | where your replicas are: the tiles gather in a cluster per place (see below) |
| v-model:level, v-model:within | the level the tiles are clustered by, and the places they are narrowed to |
| group | the group you gather each table in: (table) => ({ key, label, order }) |
| checks | what you check of a replica, shown before the engine's own check |
| combine | a state of your own from the engine's and your checks (see below): filtered by, and counted with states |
| locale, messages | see below |
| unansweringAfter, stuckAfter | when a replica is "not answering" (15 min) and when waiting changes need attention (15 min), in ms |
The slot replica-extra (given { replica }) goes under a replica's
checks: whatever else your system shows of it.
An answer carries the version of its JSON (contract): one this dashboard
does not read is refused, with a message that says so, rather than drawn
wrong. Every time is measured against the server's now in the answer, moved
on by the time passed in the page — never against the browser's clock.
What only your system knows
The engine knows whether each replica holds what it should and when it last heard from it. Your system knows more, and says it as functions:
// Where each replica is, the widest level first: a cluster of tiles per
// place, and a cluster's header leads a level down.
const levels = [
  { key: 'region', label: 'Region' },
  { key: 'store', label: 'Store' },
]
const placeOf = (replica: string, level: string) => places[replica]?.[level] ?? null // { key, label }
// The group of each table: a replica's tables roll up in them.
const group = (table: string) => groups[table] // { key, label, order }
// What you check of a replica, read before the engine's own check.
const checks = (replica: string) => [
  { key: 'link', label: 'Link', status: online[replica] ? 'ok' : 'failing', line: '…' },
]
A passing check stays quiet; one that fails is drawn in its tone, or the
attention colour.
Where one row is
"Which replicas hold this product?" belongs next to the product, in your own
listing: ask Engine::row_progress with its key, and show the answer with
RowPlaces (or useRowPlaces, without looks):
<RowPlaces :places="rowProgress" :names="registerNames" />Wishes
What the head office wished of the replicas' settings, and how each replica
answered: ask Engine::wishes for a page of them, and show it with
WishList (or useWishes, without looks). A wish's table and key are the
engine's; setting names it for a person:
<WishList :wishes="wishListing" :names="registerNames" :setting="(w) => settingNames[w.key]" />Each replica's line on the dashboard already counts its wishes not carried out, waiting, refused and changed there first.
Its look
Every colour and size is a CSS variable; set them on .msd or any ancestor:
--msd-font (a font family), --msd-fg, --msd-muted, --msd-bg, --msd-card,
--msd-border, --msd-accent, --msd-ok, --msd-warn,
--msd-danger, --msd-quiet, --msd-off, --msd-unknown, --msd-ok-soft, --msd-warn-soft,
--msd-danger-soft, --msd-quiet-soft, --msd-off-soft, --msd-unknown-soft, --msd-accent-soft,
--msd-ok-tile, --msd-tile (a tile's size), --msd-radius, --msd-gap. The defaults keep every text at a contrast of
4.5:1 or more against what it is drawn on. They are a light scheme and do not
follow prefers-color-scheme: a host with a dark theme sets the variables for
it, which is also what keeps the contrast.
The same, with your own components
A host with a design system of its own calls useSyncDashboard in its own
component and draws the same answers with its own parts, saying them with the
sentence functions of the core:
import { describeReplica, describeTable, describeProblem, useSyncDashboard } from 'magic_sync_dashboard'

const dash = useSyncDashboard({ overview, states, listing, filter, selected, progress, names, labels })
dash.error.value // why the answer cannot be shown (another contract), or null
dash.speech.value // how to say things; null until an answer that reads has come
dash.banner.value // { mood: 'healthy' | 'catching_up' | 'attention' | 'empty', title, lines }
dash.summary.value // counts per state, the worst replicas, tables, problems
dash.tally.value // [{ state, tone, label, n }], worst first: the counters
dash.grid.value // the tiles in clusters: { level, deeper, trail, clusters, total, tones }
dash.attention.value // [{ id, name, standing, line }]: the replicas not settled, worst first — of every
// replica with `states` (`line` null for one whose row is on no page at hand), else the page's;
// with `states` the whole list, which the ready-made view shows a page (`pageSize`) at a time
dash.page.value // the replicas to list: rows, offset, total
dash.tables.value // the tables over the fleet: lagging groups, settled groups
dash.progress.value // the selected replica, per table: upToDate of should
dash.detail.value // the selected replica: standing, checks, heard, totals, down, up, problems
const speech = dash.speech.value
if (speech) {
  describeReplica(row, speech) // ["Last answered 3 hr. ago.", "2 rows set aside."]
  describeTable(table, speech) // ["840 rows on their way.", "5 replicas are behind on it."]
  describeProblem(problem, speech) // { title, about, reason, facts }
}
Once you pass states, the replicas that need attention are of every
replica, and listing only lends them their sentences: its rows say what
each waits on, and a replica on no page at hand is listed without one. The
ready-made view then shows them pageSize at a time, a button showing the
next ones, and no pager of the listing.
It also takes replica, levels, placeOf, level, within, group,
checks, combine and state. combine is a state of your own made from
the engine's and your checks, (state, checks) => ({ state, tone, label }) |
null, which the tiles and the replicas that need attention take, and the
counters too once you pass states: counting a state of your own needs
every replica, so without states the counters are the engine's counts;
state narrows the tiles and the replicas that need attention to
one state, yours or the engine's, while filter stays the engine's state
you list by. Whether a replica's rows going up wait is the engine's
judgement, by your server's Settings::behind_after, so the dashboard has
no copy of it. A
Tone — attention, off, silent, unknown, moving, ok, worst first
— is what your design system colours a state by.
useSyncDashboard keeps the server's time moving while it is called in a
component's setup or an effect scope; called anywhere else it has nothing to
tie a timer to, and the times it says stay as of the last answer.
Everything that does not need Vue — the types, summarize, pageOf,
progressOf, tilesOf, gridOf, downOf, upOf, drawnOf, attentionOf,
countersOf, checksOf, the sentence functions and translator — is also in
magic_sync_dashboard/core, as pure functions of the answers.
Languages
English and Spanish are built in. With vue-i18n in the host, the dashboard
follows its global locale on its own (vue-i18n is not a dependency); pin
one with locale (es-MX and es_MX both read as es-MX, and fall back to
es), and override or add messages with messages. A message with a count
has a form per plural category of the locale (Intl.PluralRules), other
always:
{
  en: { 'mood.healthy': 'All registers are up to date' },
  fr: { 'replica.pending': { one: '{n} modification en route.', other: '{n} modifications en route.' } },
}
Versions
The dashboard reads the JSON of the engine of the same version: release and
upgrade them together. A field the engine adds is ignored; a word it adds
to a state (a replica's, a row's, a note's) is shown by this dashboard as
unknown, with the word it came as, and counted. The contract number (status::CONTRACT)
changes when a field or a word is removed or renamed, or a word comes to mean
something else, and the dashboard refuses an answer of a contract it does not
read. Its types are generated from the engine's (src/core/contract/types.ts),
and the engine's tests write what it answers into
src/core/contract/fixtures/, which the dashboard's type-check holds field for
field to those types and its tests read.
License
MIT OR Apache-2.0.