
mc-pg-studio
v2.0.3
Published
One-stop PostgreSQL developer studio — SQL editor, schema explorer, PL/pgSQL editor, AI Sidekick, and more. Runs as a local Node.js server with a world-class web UI.
Maintainers
 mohanchinnappan
Readme
pg-studio
One-stop PostgreSQL developer studio — a local Node.js CLI that opens a rich browser UI for exploring, querying and managing your Postgres databases with world class Analytics.
Features
| Category | Capabilities |
|---|---|
| Connection | Connect to any local or remote PostgreSQL instance with host, port, user, password, database, and optional SSL |
| Explorer | Collapsible tree of Tables, Views, Indexes, Functions, and Sequences — live search bar filters all objects instantly; click any object to open its DDL |
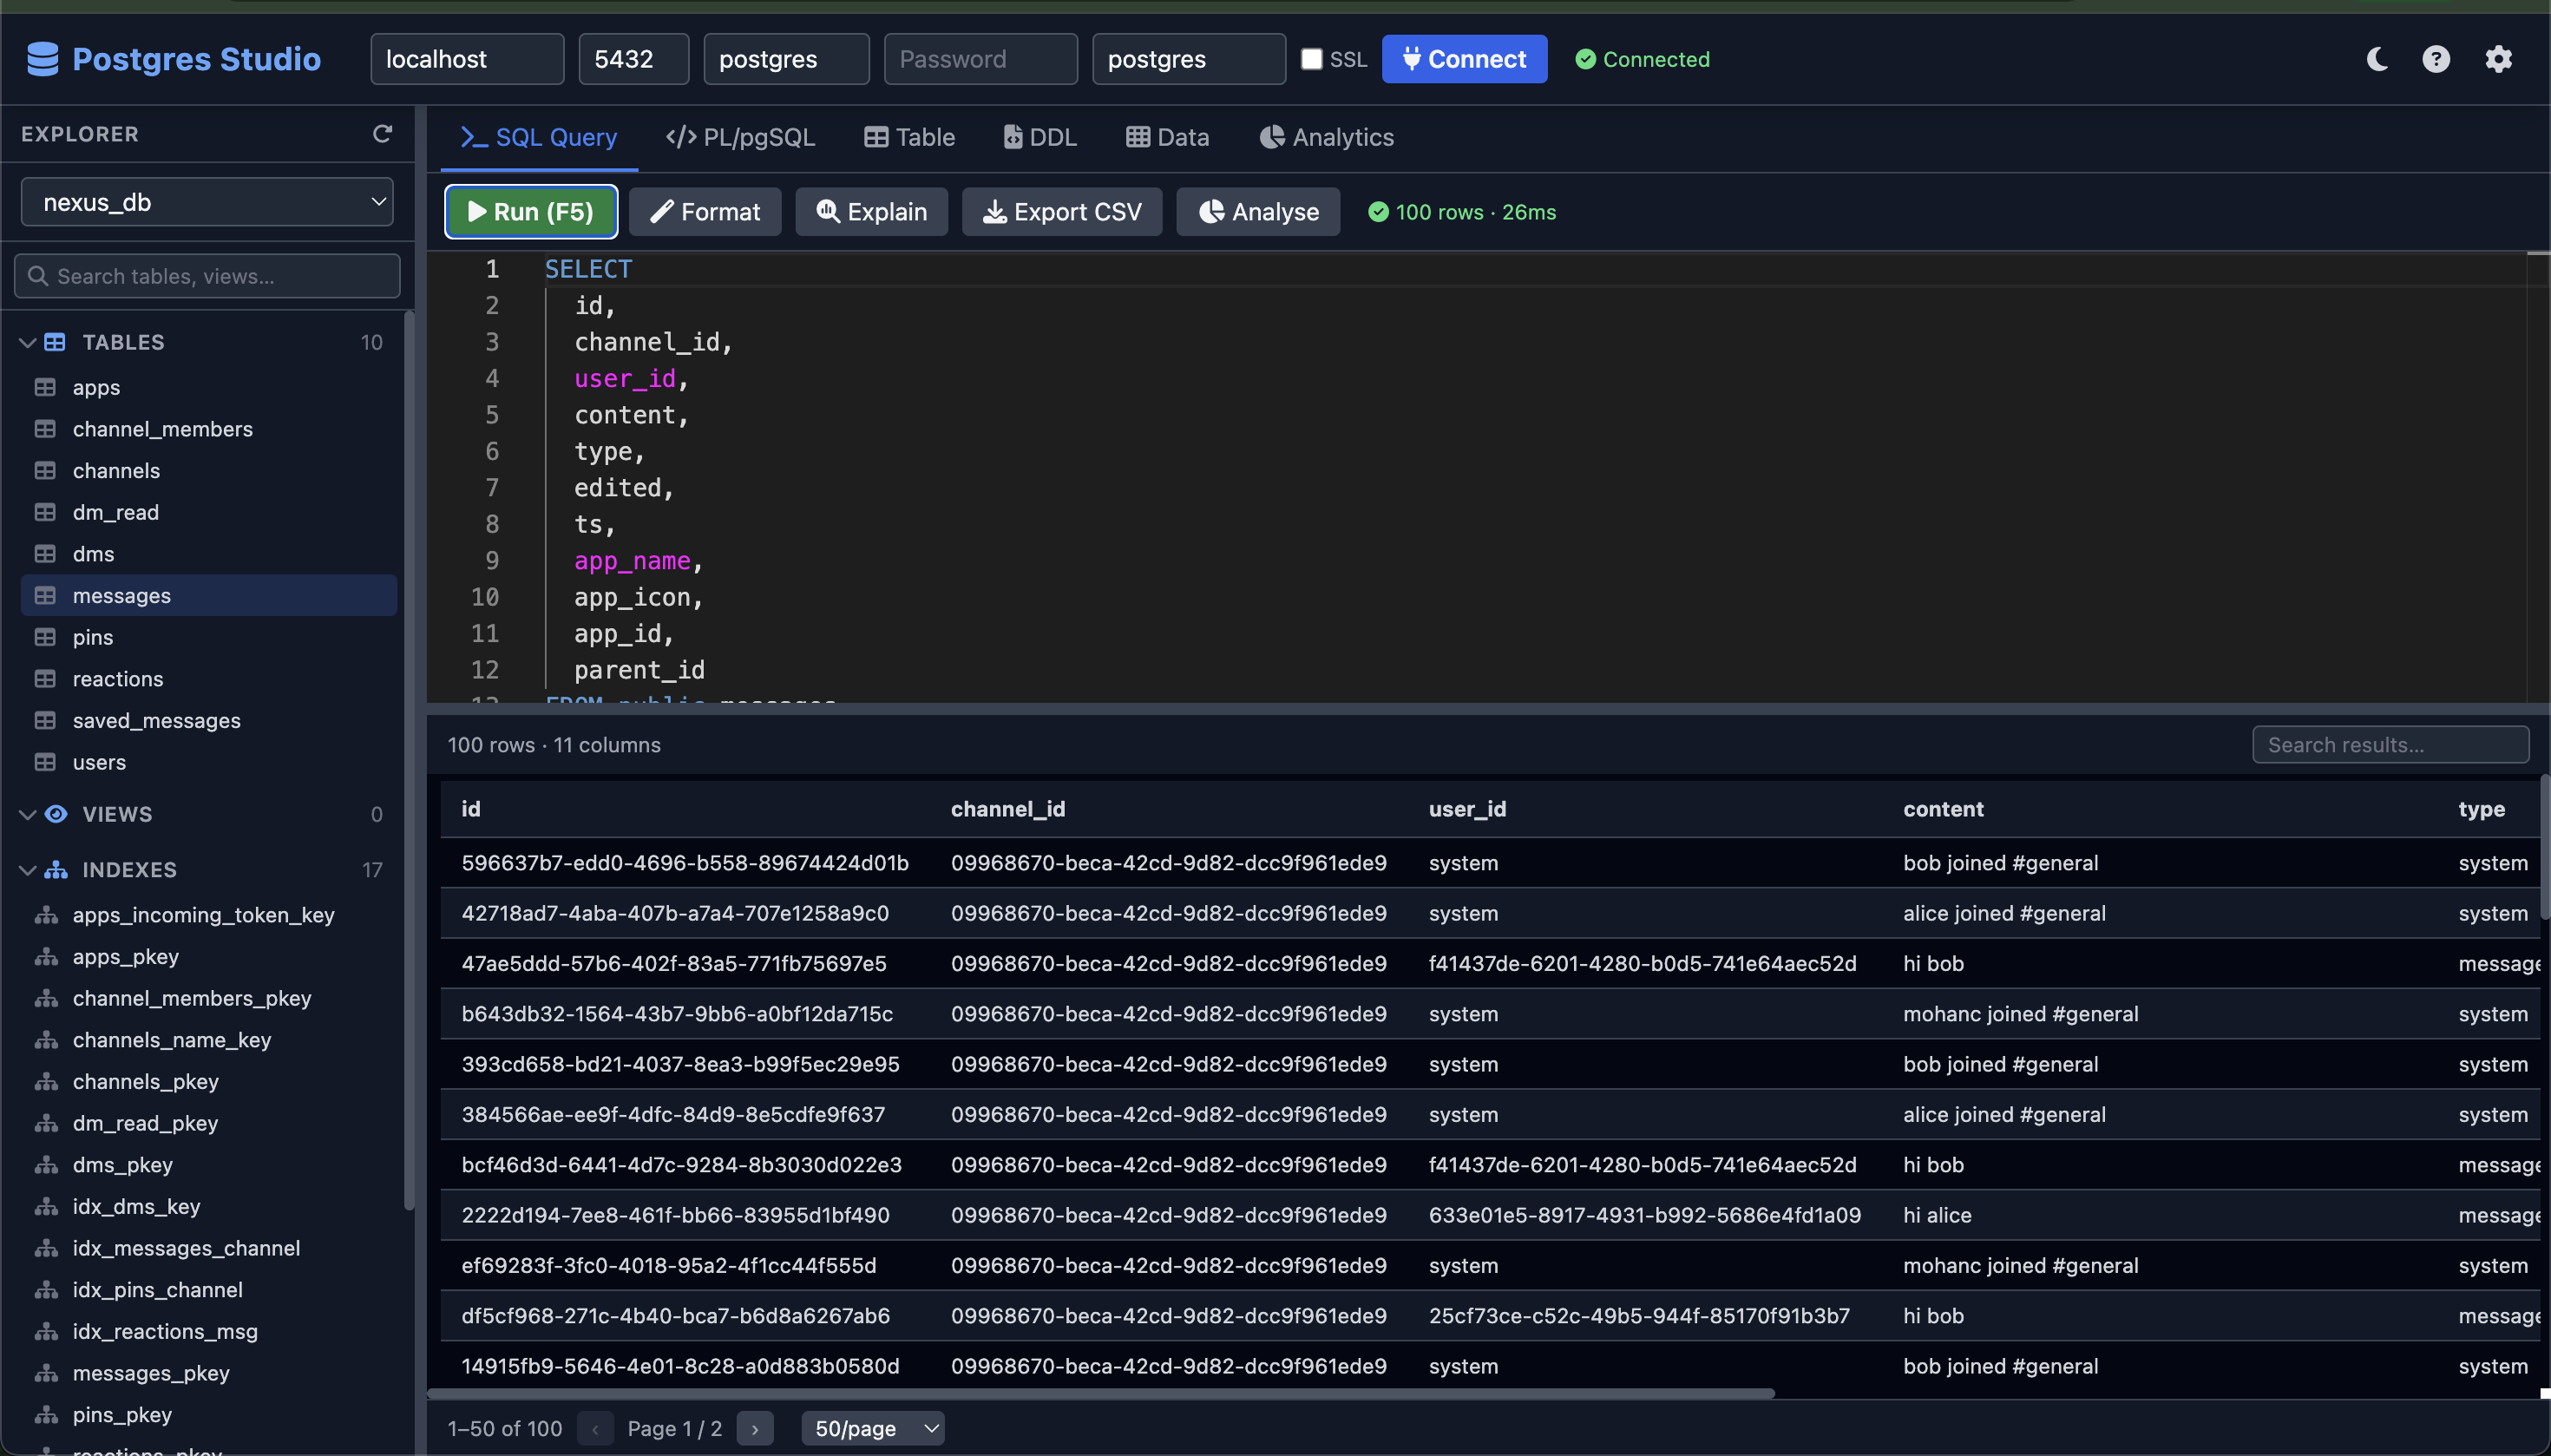
| SQL Editor | Monaco editor with SQL syntax highlighting, keyword + table + column autocomplete, F5 / Ctrl+Enter to run, Ctrl+Shift+F to format |
| PL/pgSQL Editor | Dedicated Monaco editor — write, execute, save to DB (CREATE OR REPLACE), and drop functions; load existing functions by name |
| DDL Viewer | Read-only Monaco view of CREATE TABLE, CREATE VIEW, and CREATE FUNCTION DDL with a one-click Copy button |
| Table Builder | Visual column designer — pick types, constraints, primary keys — generates and executes CREATE TABLE |
| Query Results | DataTable with live search/filter, click-to-sort columns, pagination, page-size selector, CSV export, and inline Result Analytics |
| Data Editor | Inline row editor — edit cells in place, insert new rows, delete with confirmation; PK columns auto-detected; NULL-aware |
| Analytics Dashboard | Per-column KPI cards, doughnut/bar charts for categoricals, histograms for numerics, line charts for date timelines, null-coverage bars, numeric stats (min/max/avg/sum/stddev), SVG export per chart and full dashboard |
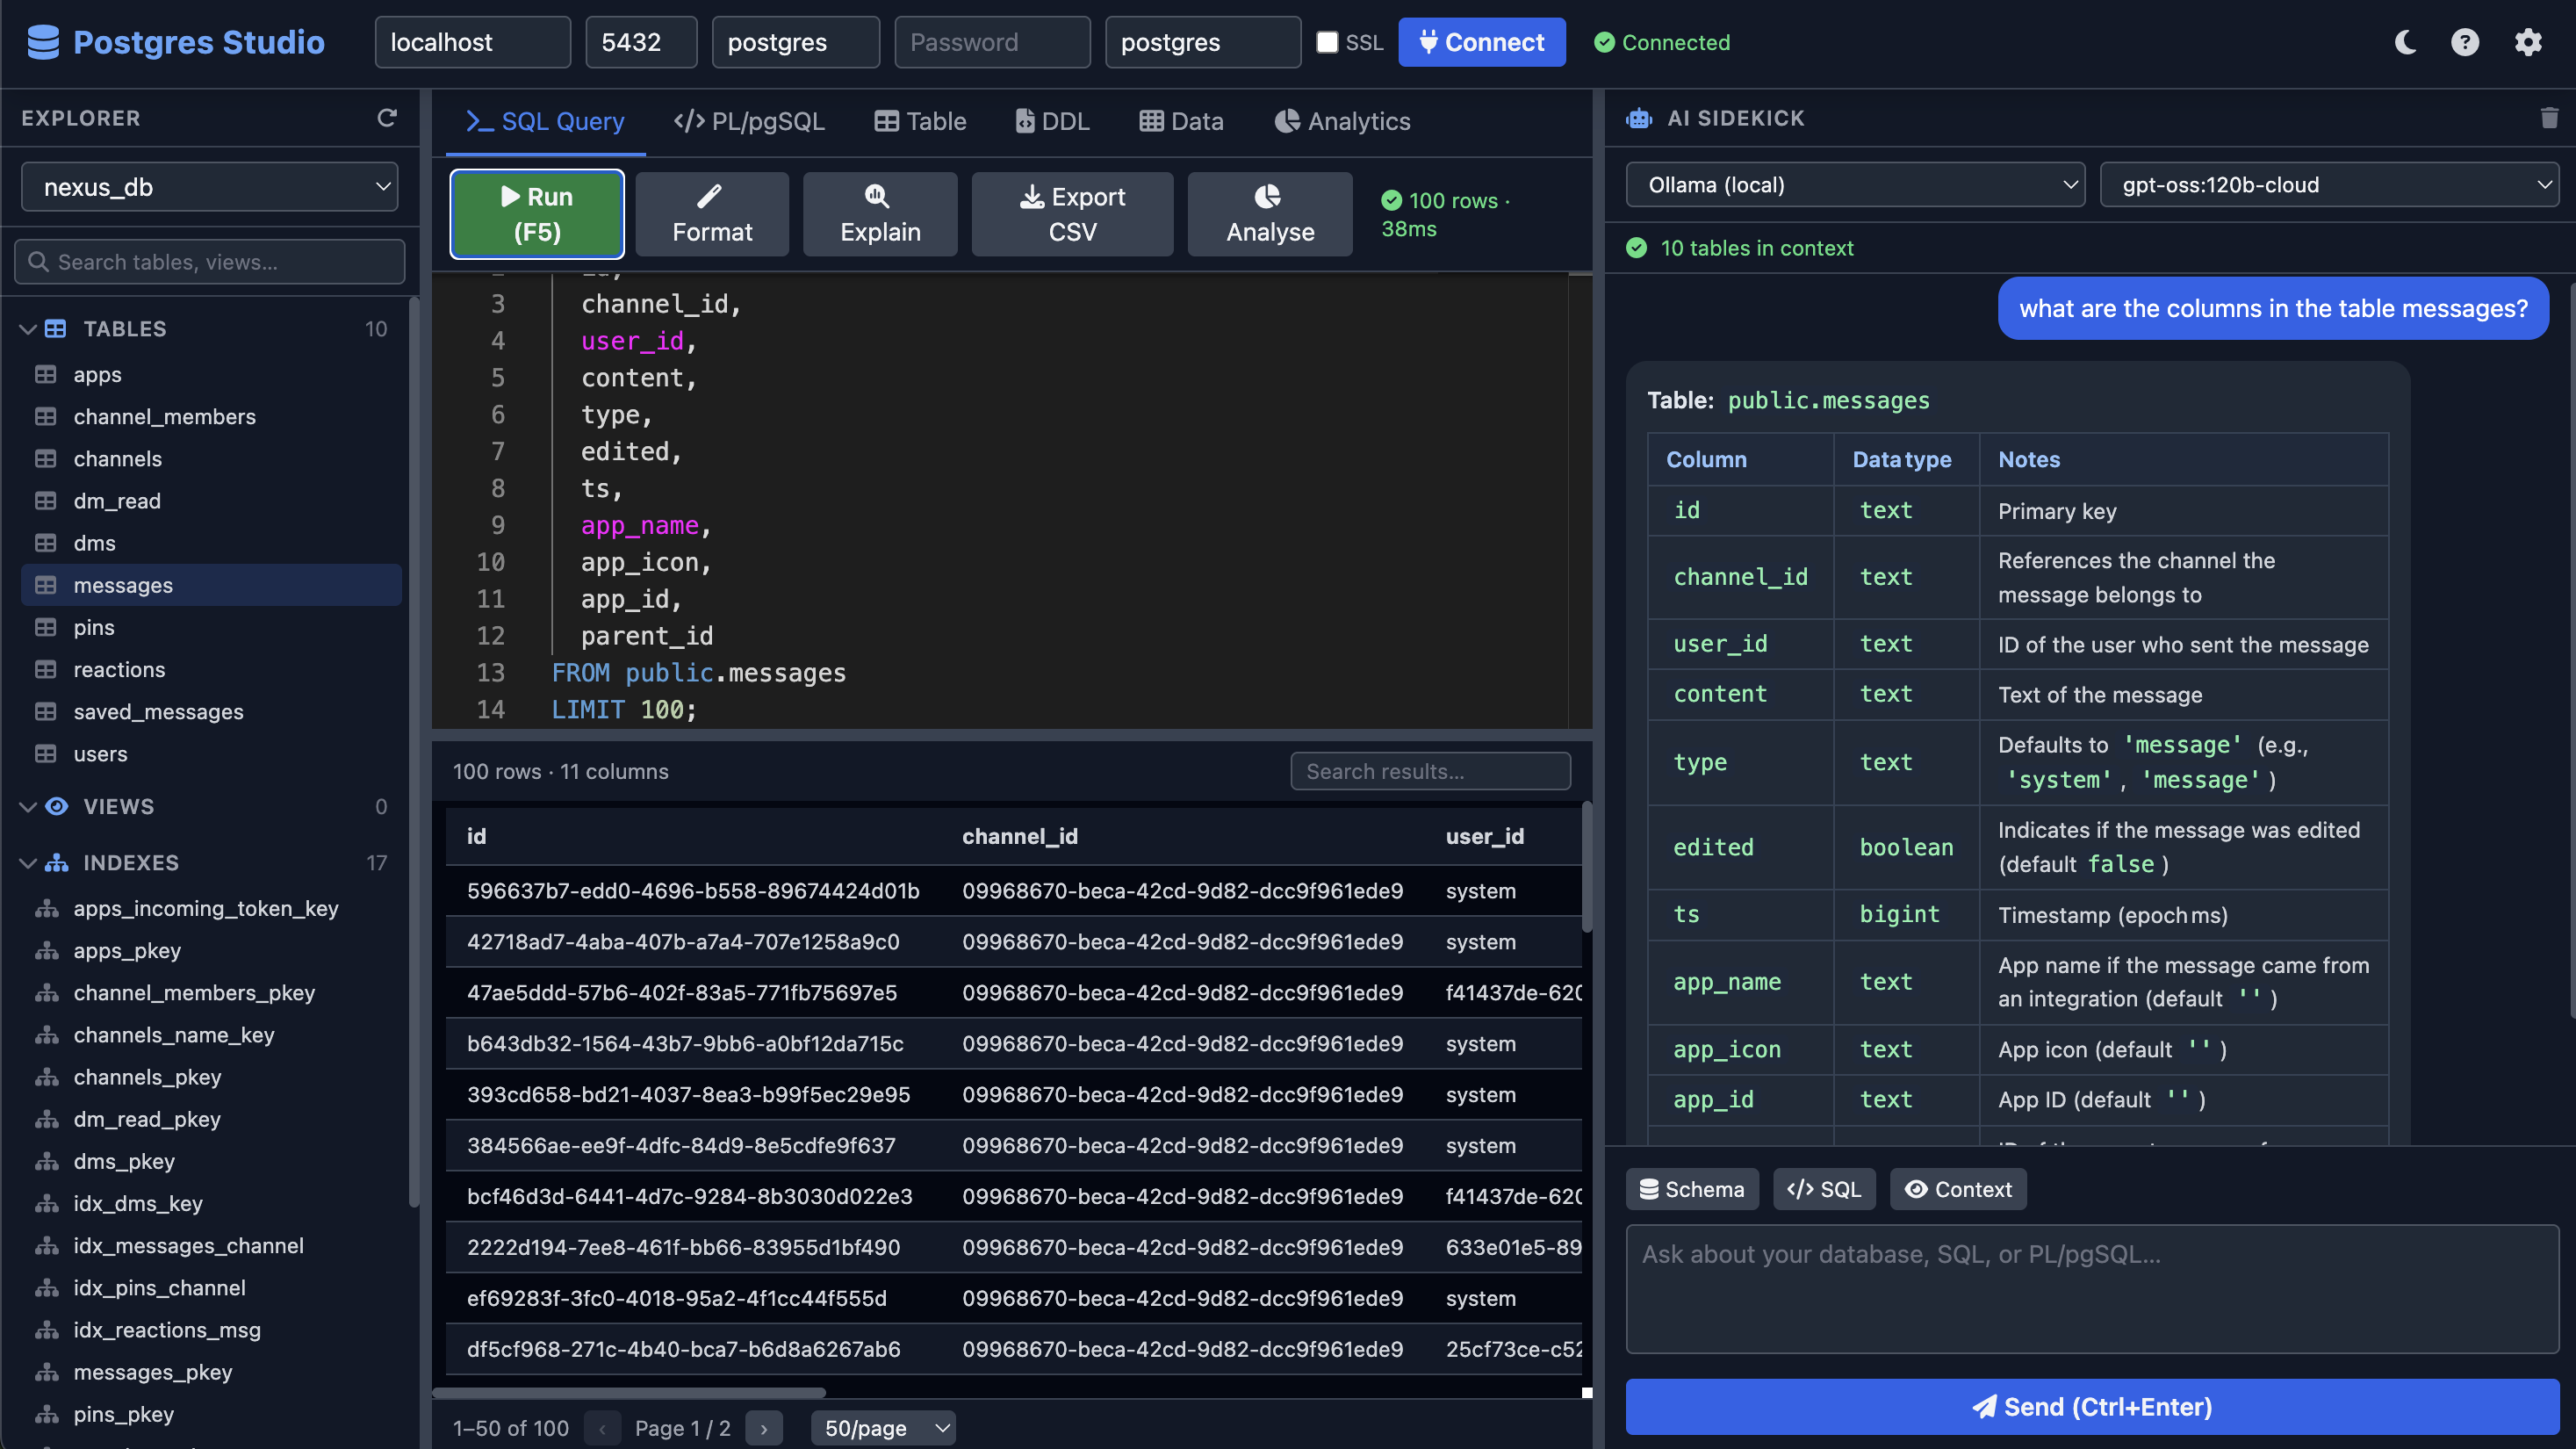
| AI Sidekick | Ask questions about your schema and SQL; responses render as formatted markdown with "↑ Use in SQL Editor" buttons on code blocks |
| Multi-provider AI | Ollama (local), Claude (Anthropic), OpenAI, xAI (Grok), Gemini — schema context auto-injected into every prompt |
| Themes | Dark and light mode with a single click — all panels, editors, and tables adapt |
| Resizable panes | Animated drag splitters between Explorer, Editor, and AI panels |
Screenshots
Requirements
- Node.js 18+ (uses native
fetch) - A running PostgreSQL instance
Install
npm install -g mc-pg-studioUsage
pg-studio start                  # default: http://localhost:3000
pg-studio start -p 8080          # custom port
pg-studio start -p 8080 --host 0.0.0.0   # bind to all interfaces
Then open your browser at the printed URL.
CLI options
pg-studio start [options]

Options:
  -p, --port <number>   Port to listen on (default: 3000)
  --host <string>       Host to bind to (default: localhost)
  -h, --help            Display help
  -V, --version         Display version
Connecting to PostgreSQL
Fill in the header bar at the top of the UI:
| Field | Default | Notes |
|---|---|---|
| Host | localhost | Hostname or IP of the Postgres server |
| Port | 5432 | Standard Postgres port |
| User | postgres | Database user |
| Password | (empty) | Leave blank for local peer auth |
| Database | postgres | Initial database to connect to |
| SSL | off | Toggle for TLS connections (accepts self-signed certs) |
Click Connect. Once connected, select any database from the dropdown in the Explorer to load its objects.
Explorer Search
The left panel has a live search box below the database selector. Type any part of a table, view, index, function, or sequence name to instantly filter the tree. Sections with no matching items are hidden; sections with matches auto-expand. Clear the search to restore the full tree.
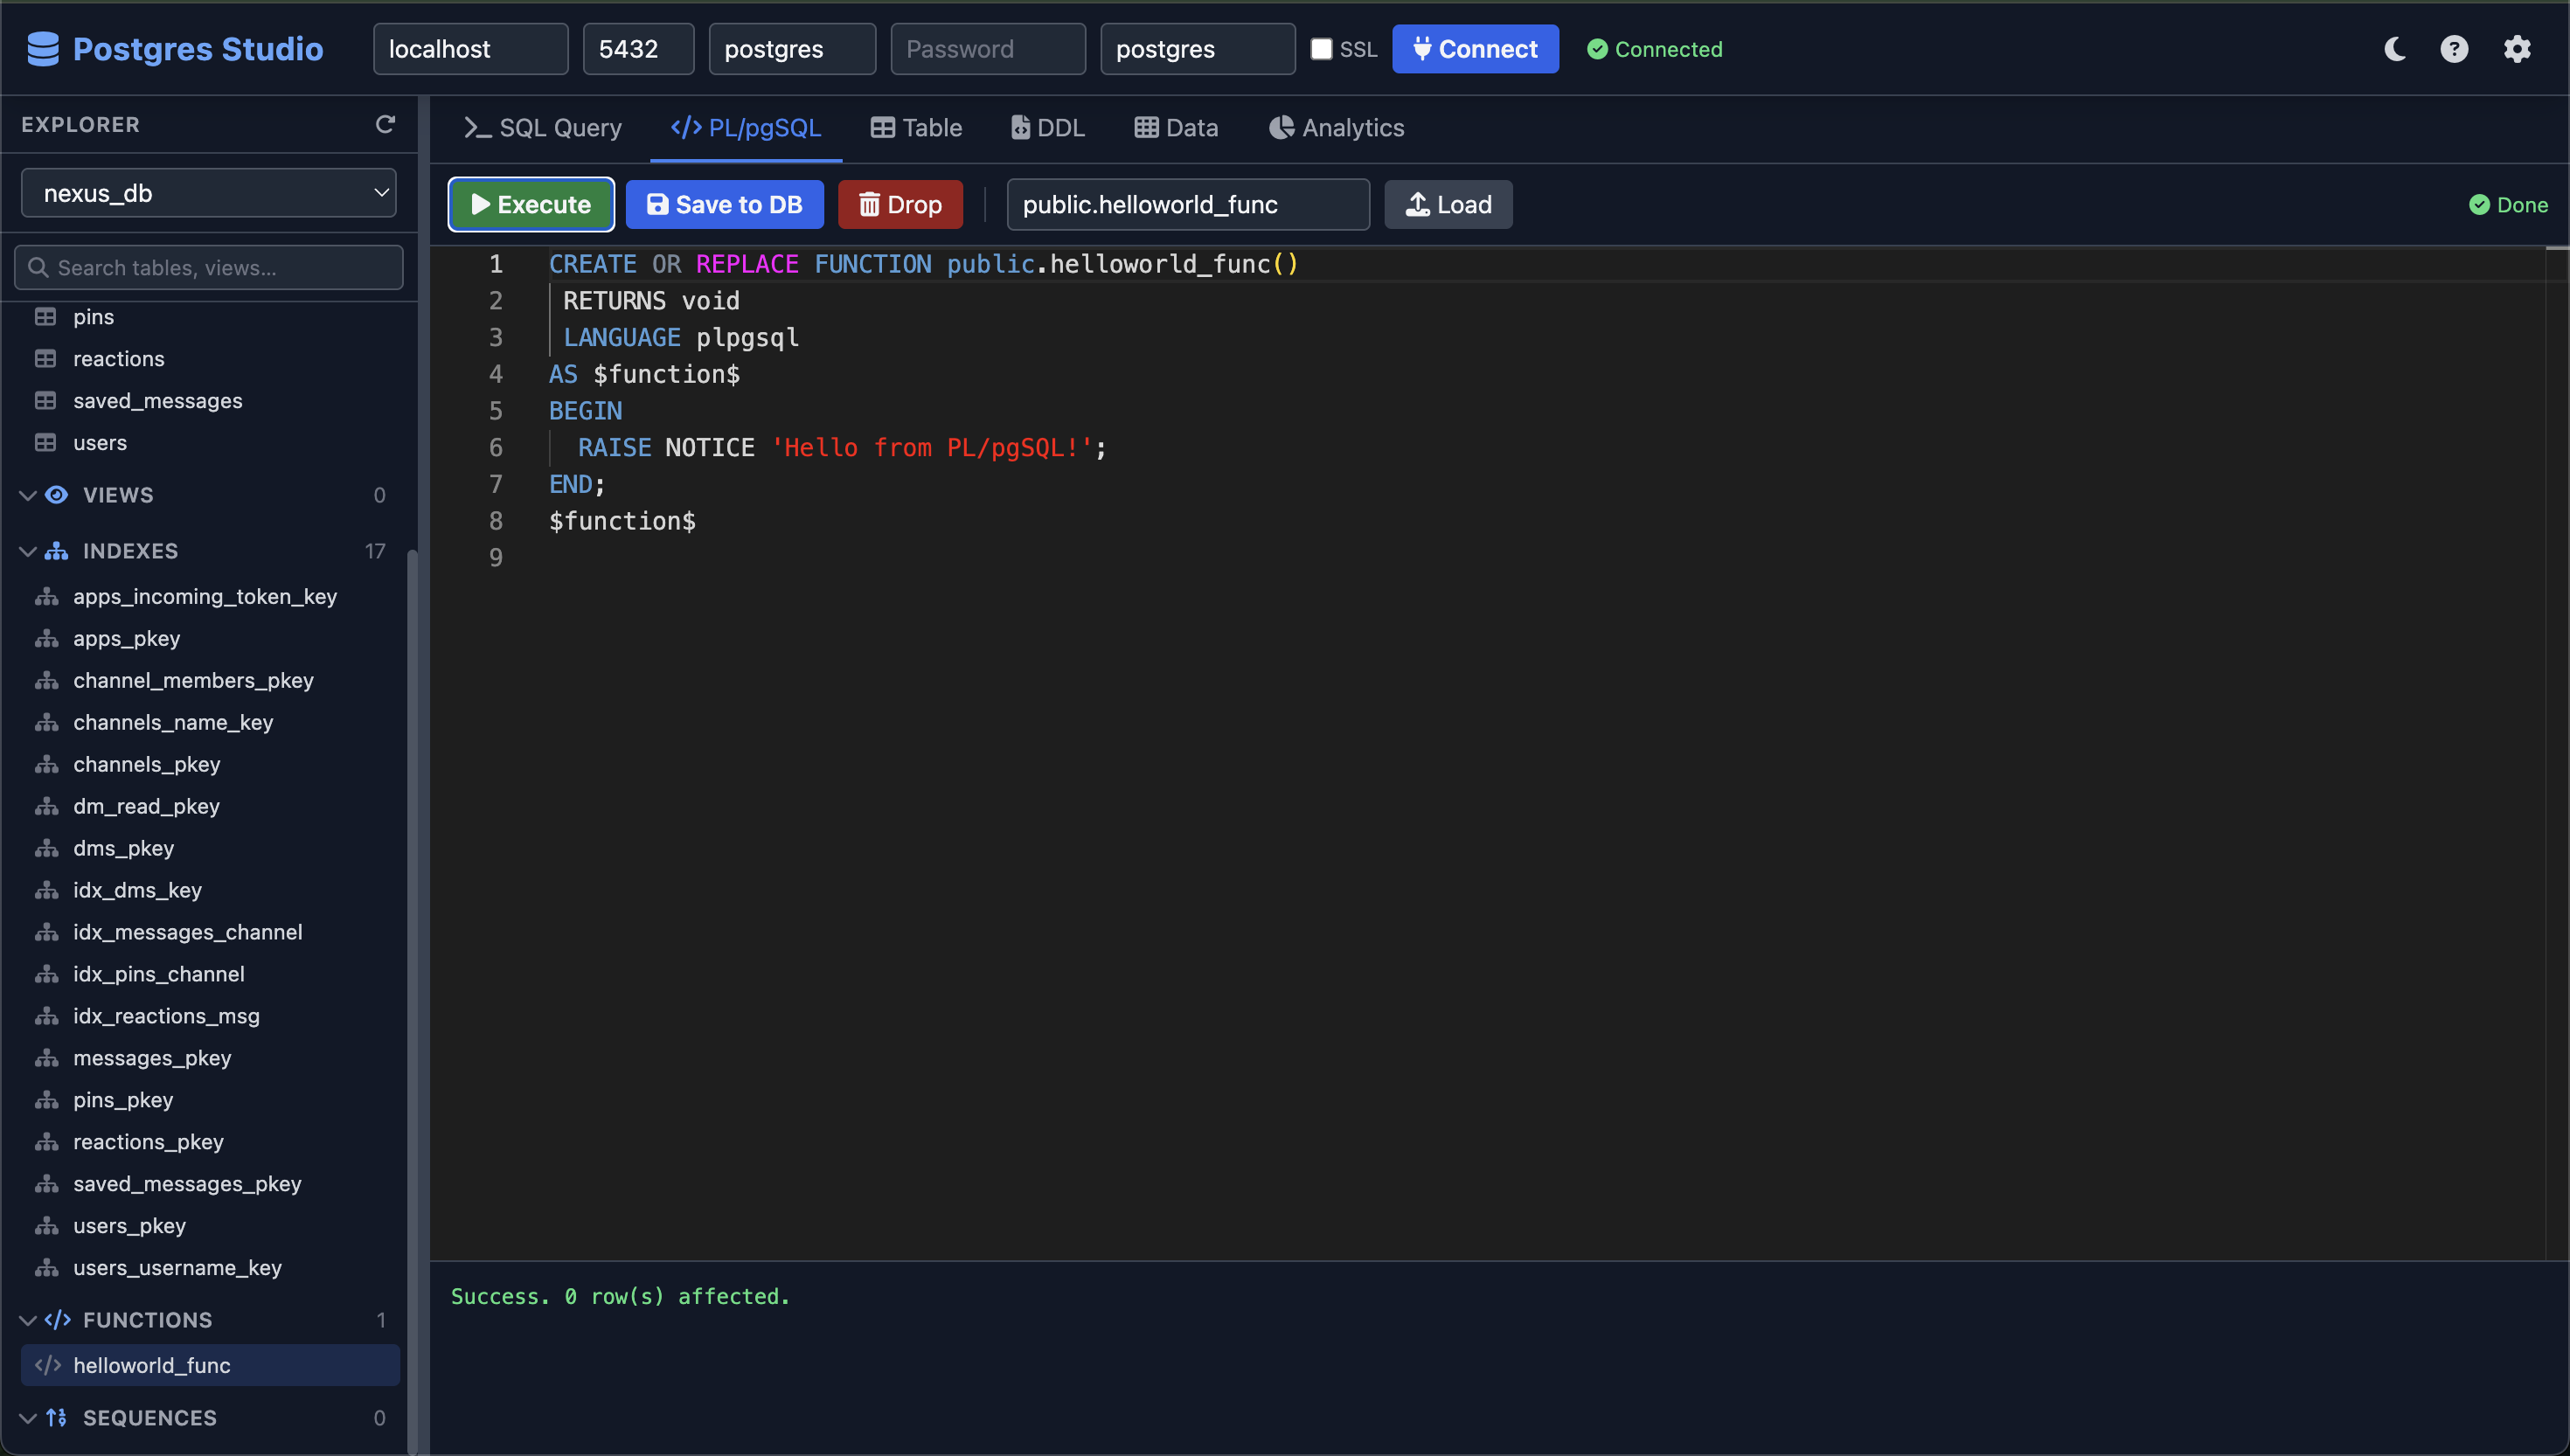
PL/pgSQL Editor
The PL/pgSQL tab provides a full Monaco editor for authoring and managing database functions.
Toolbar actions
| Button | Shortcut | Description |
|---|---|---|
| Execute | — | Runs the current code as a SQL statement (useful for DO $$ … $$ blocks) |
| Save to DB | — | Issues CREATE OR REPLACE FUNCTION — persists the function to the database and refreshes the Explorer |
| Drop | — | Parses the function signature from the editor, confirms with a dialog, then runs DROP FUNCTION IF EXISTS |
| Load | — | Fetches the live DDL of an existing function by schema.name and loads it into the editor |
Workflow
- Write or paste a
CREATE OR REPLACE FUNCTION … $$ … $$ LANGUAGE plpgsql;block - Click Save to DB to persist it — the Explorer refreshes automatically
- To iterate: edit the function body and click Save to DB again
- To remove it: click Drop — a confirmation dialog shows the exact
DROP FUNCTIONstatement before executing
The output panel below the editor shows execution results, errors, and success messages.
Keyboard Shortcuts
| Shortcut | Action |
|---|---|
| F5 / Ctrl+Enter | Run SQL query |
| Ctrl+Shift+F | Format SQL |
| Ctrl+Space | Trigger autocomplete |
| Ctrl+Enter (AI chat) | Send AI message |
AI Sidekick
The right-hand panel connects to your choice of LLM provider. Every request automatically includes your live schema as context, so the AI gives answers specific to your actual tables and columns.
Providers
| Provider | Model selector | API Key required |
|---|---|---|
| Ollama (local) | Fetched from /api/tags in Settings | No |
| Claude (Anthropic) | claude-sonnet-4-6, claude-opus-4-8, claude-haiku-4-5-20251001 | Yes |
| OpenAI | gpt-4o, gpt-4o-mini, gpt-4-turbo, gpt-3.5-turbo | Yes |
| xAI (Grok) | grok-beta, grok-vision-beta | Yes |
| Gemini | gemini-1.5-pro, gemini-1.5-flash | Yes |
Enter API keys directly in the AI panel. They are never stored on disk.
Context buttons
- Schema — appends a formatted schema summary to your prompt
- SQL — appends the current SQL editor content to your prompt
SQL code blocks in AI responses include an ↑ Use in SQL Editor button that copies the query directly into the editor.
Settings
Click the gear icon (top-right) to configure:
- Ollama Base URL — default
http://localhost:11434; click Fetch Models to populate the model list - Editor Font Size — applied to all Monaco editors
- Query Row Limit — maximum rows returned per query
Query Result Analytics
After running any SQL query, an Analyse button appears in the SQL Query toolbar. Clicking it opens an inline analytics panel below the result table — no extra round-trip to the server, everything is computed in the browser from the result set already in memory.
What it shows
KPI row — row count, numeric vs. categorical column split, overall null percentage, and the sum/avg of the first numeric column.
Per-column cards — one card for every column in the result set:
| Column type | Chart | Stats | |---|---|---| | Numeric (auto-detected) | 10-bucket histogram | Min, max, avg, sum, median, stddev | | Categorical / text | Doughnut (≤8 values) or horizontal bar (top-10) | Distinct count, top value | | All | Red null-coverage bar | Null count and % |
SVG export
- Each card has a ↓ download icon — exports that column's chart as a standalone
.svgfile - The SVG button in the panel header exports the full result analytics as a single SVG dashboard with the query text embedded as a subtitle
Toggle
Click Analyse again (or the × button) to close the panel and free Chart.js resources. The button is disabled until a query returns rows.
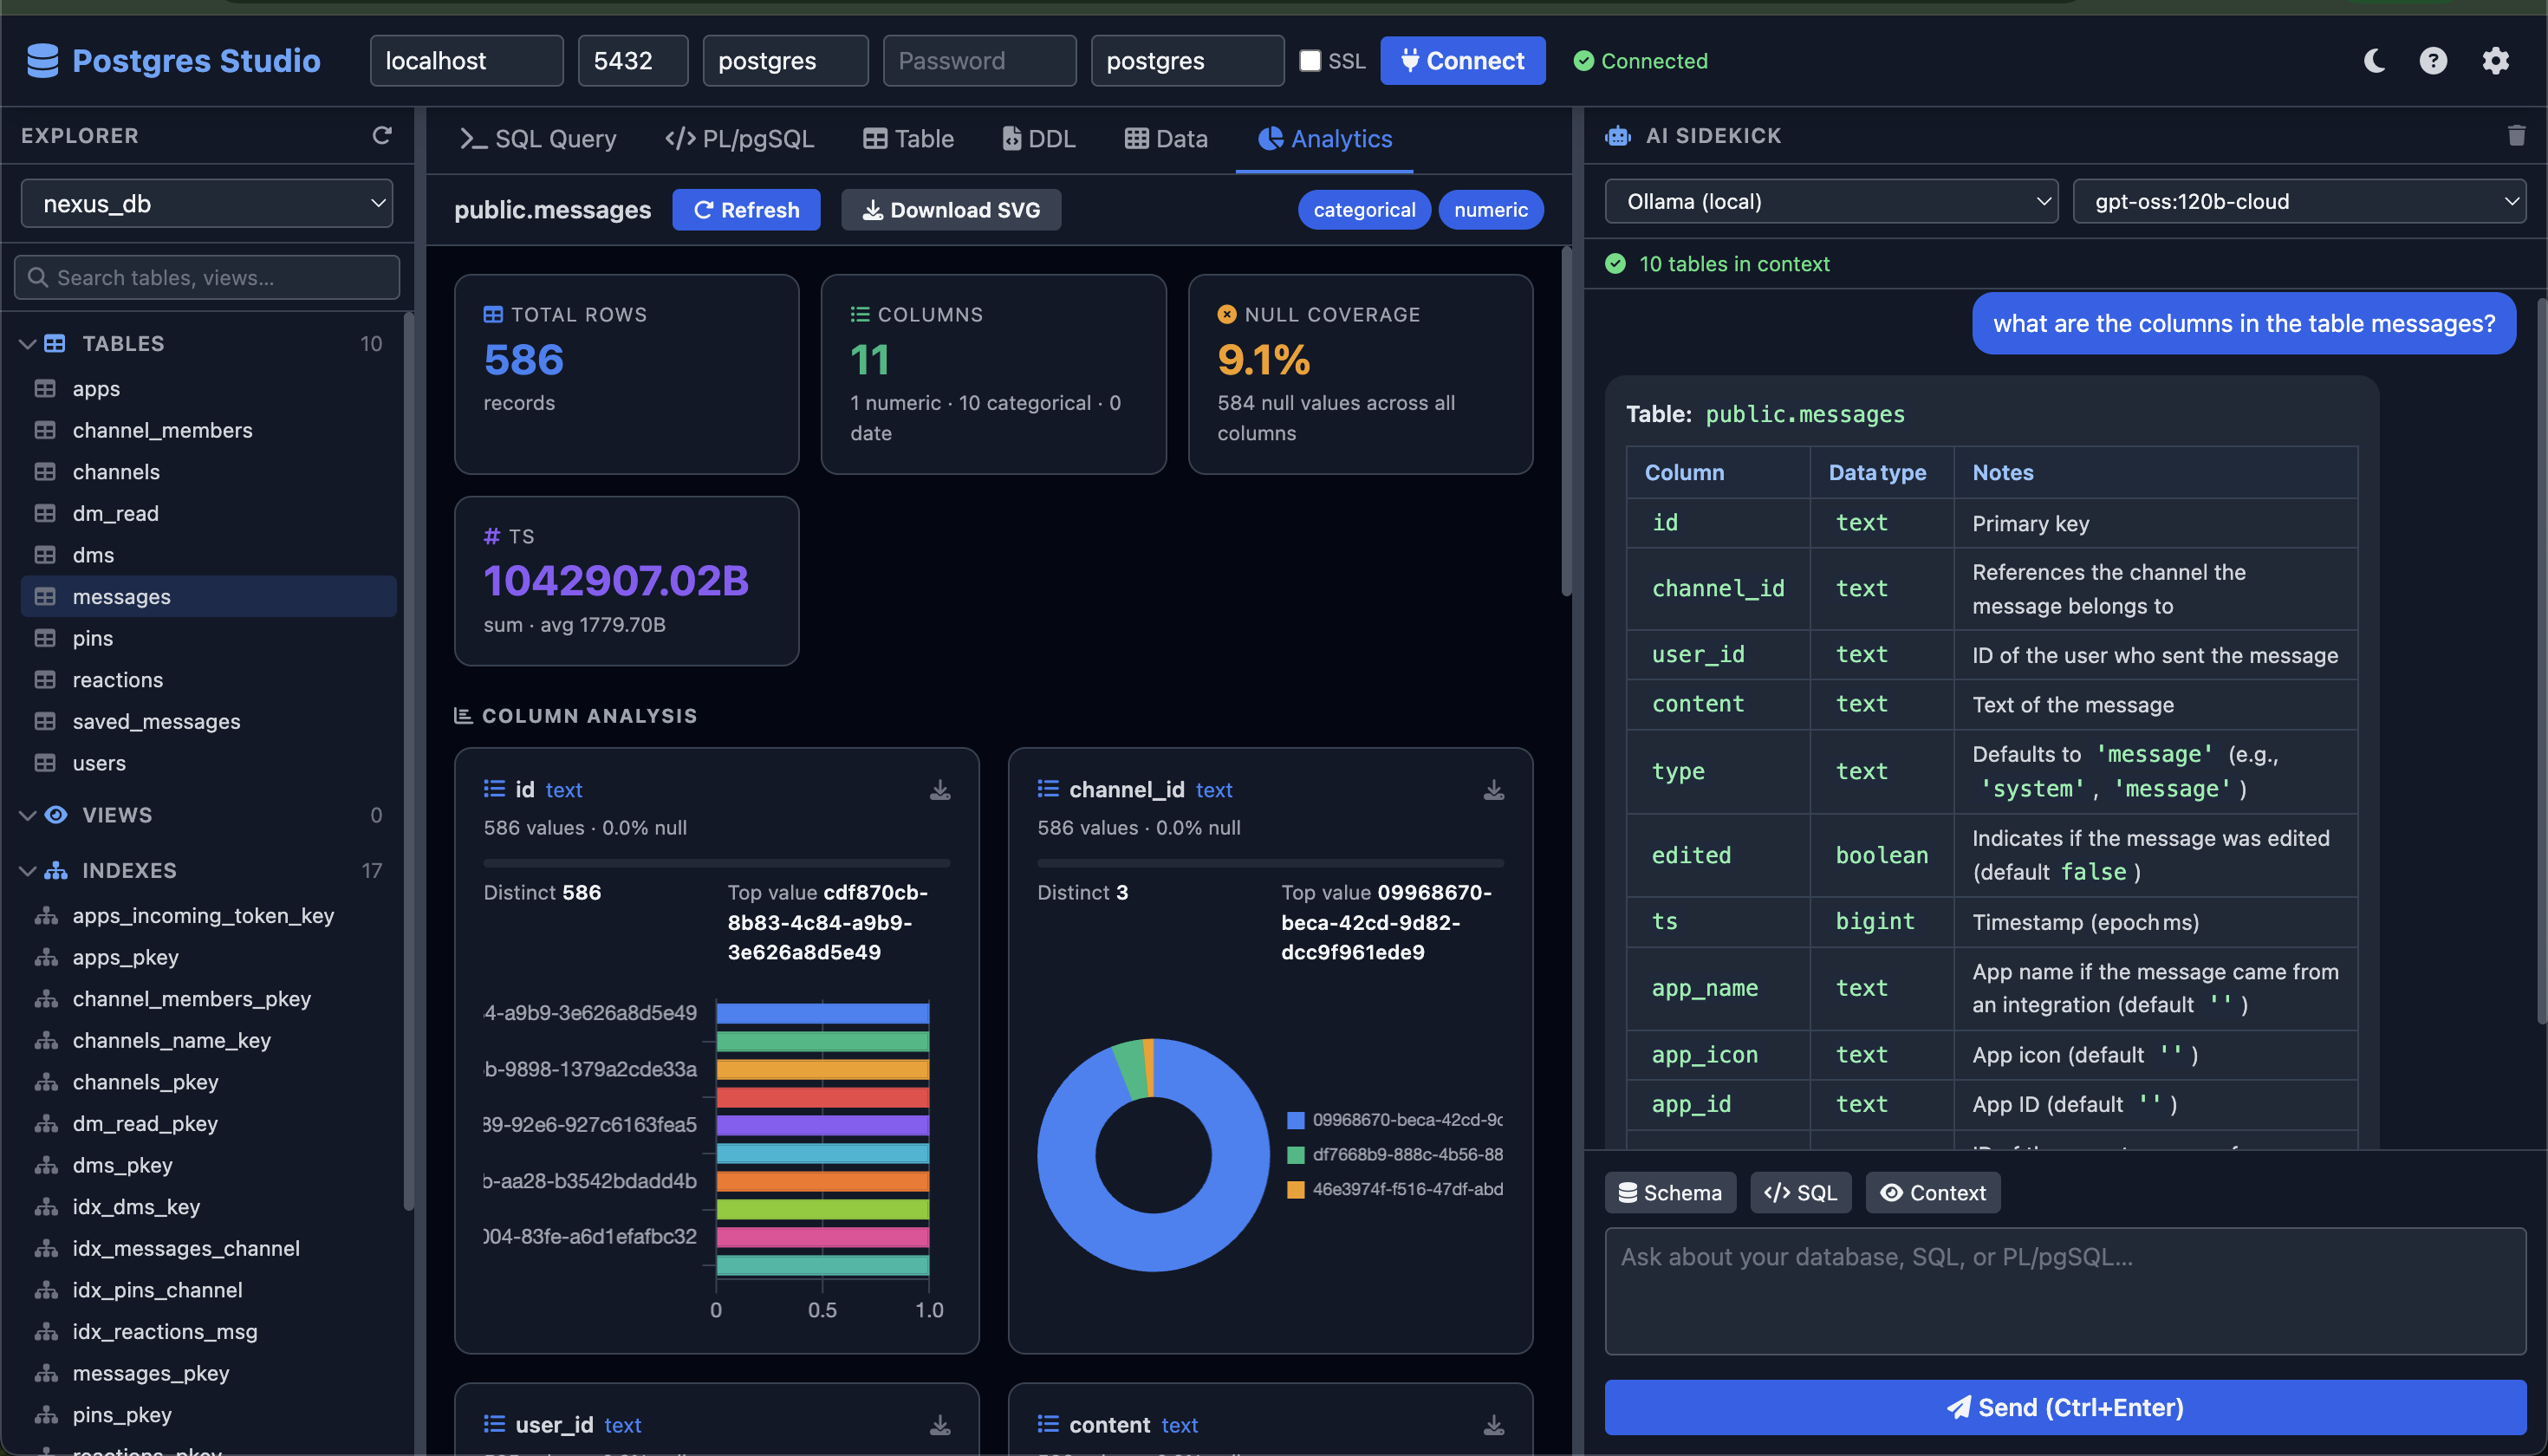
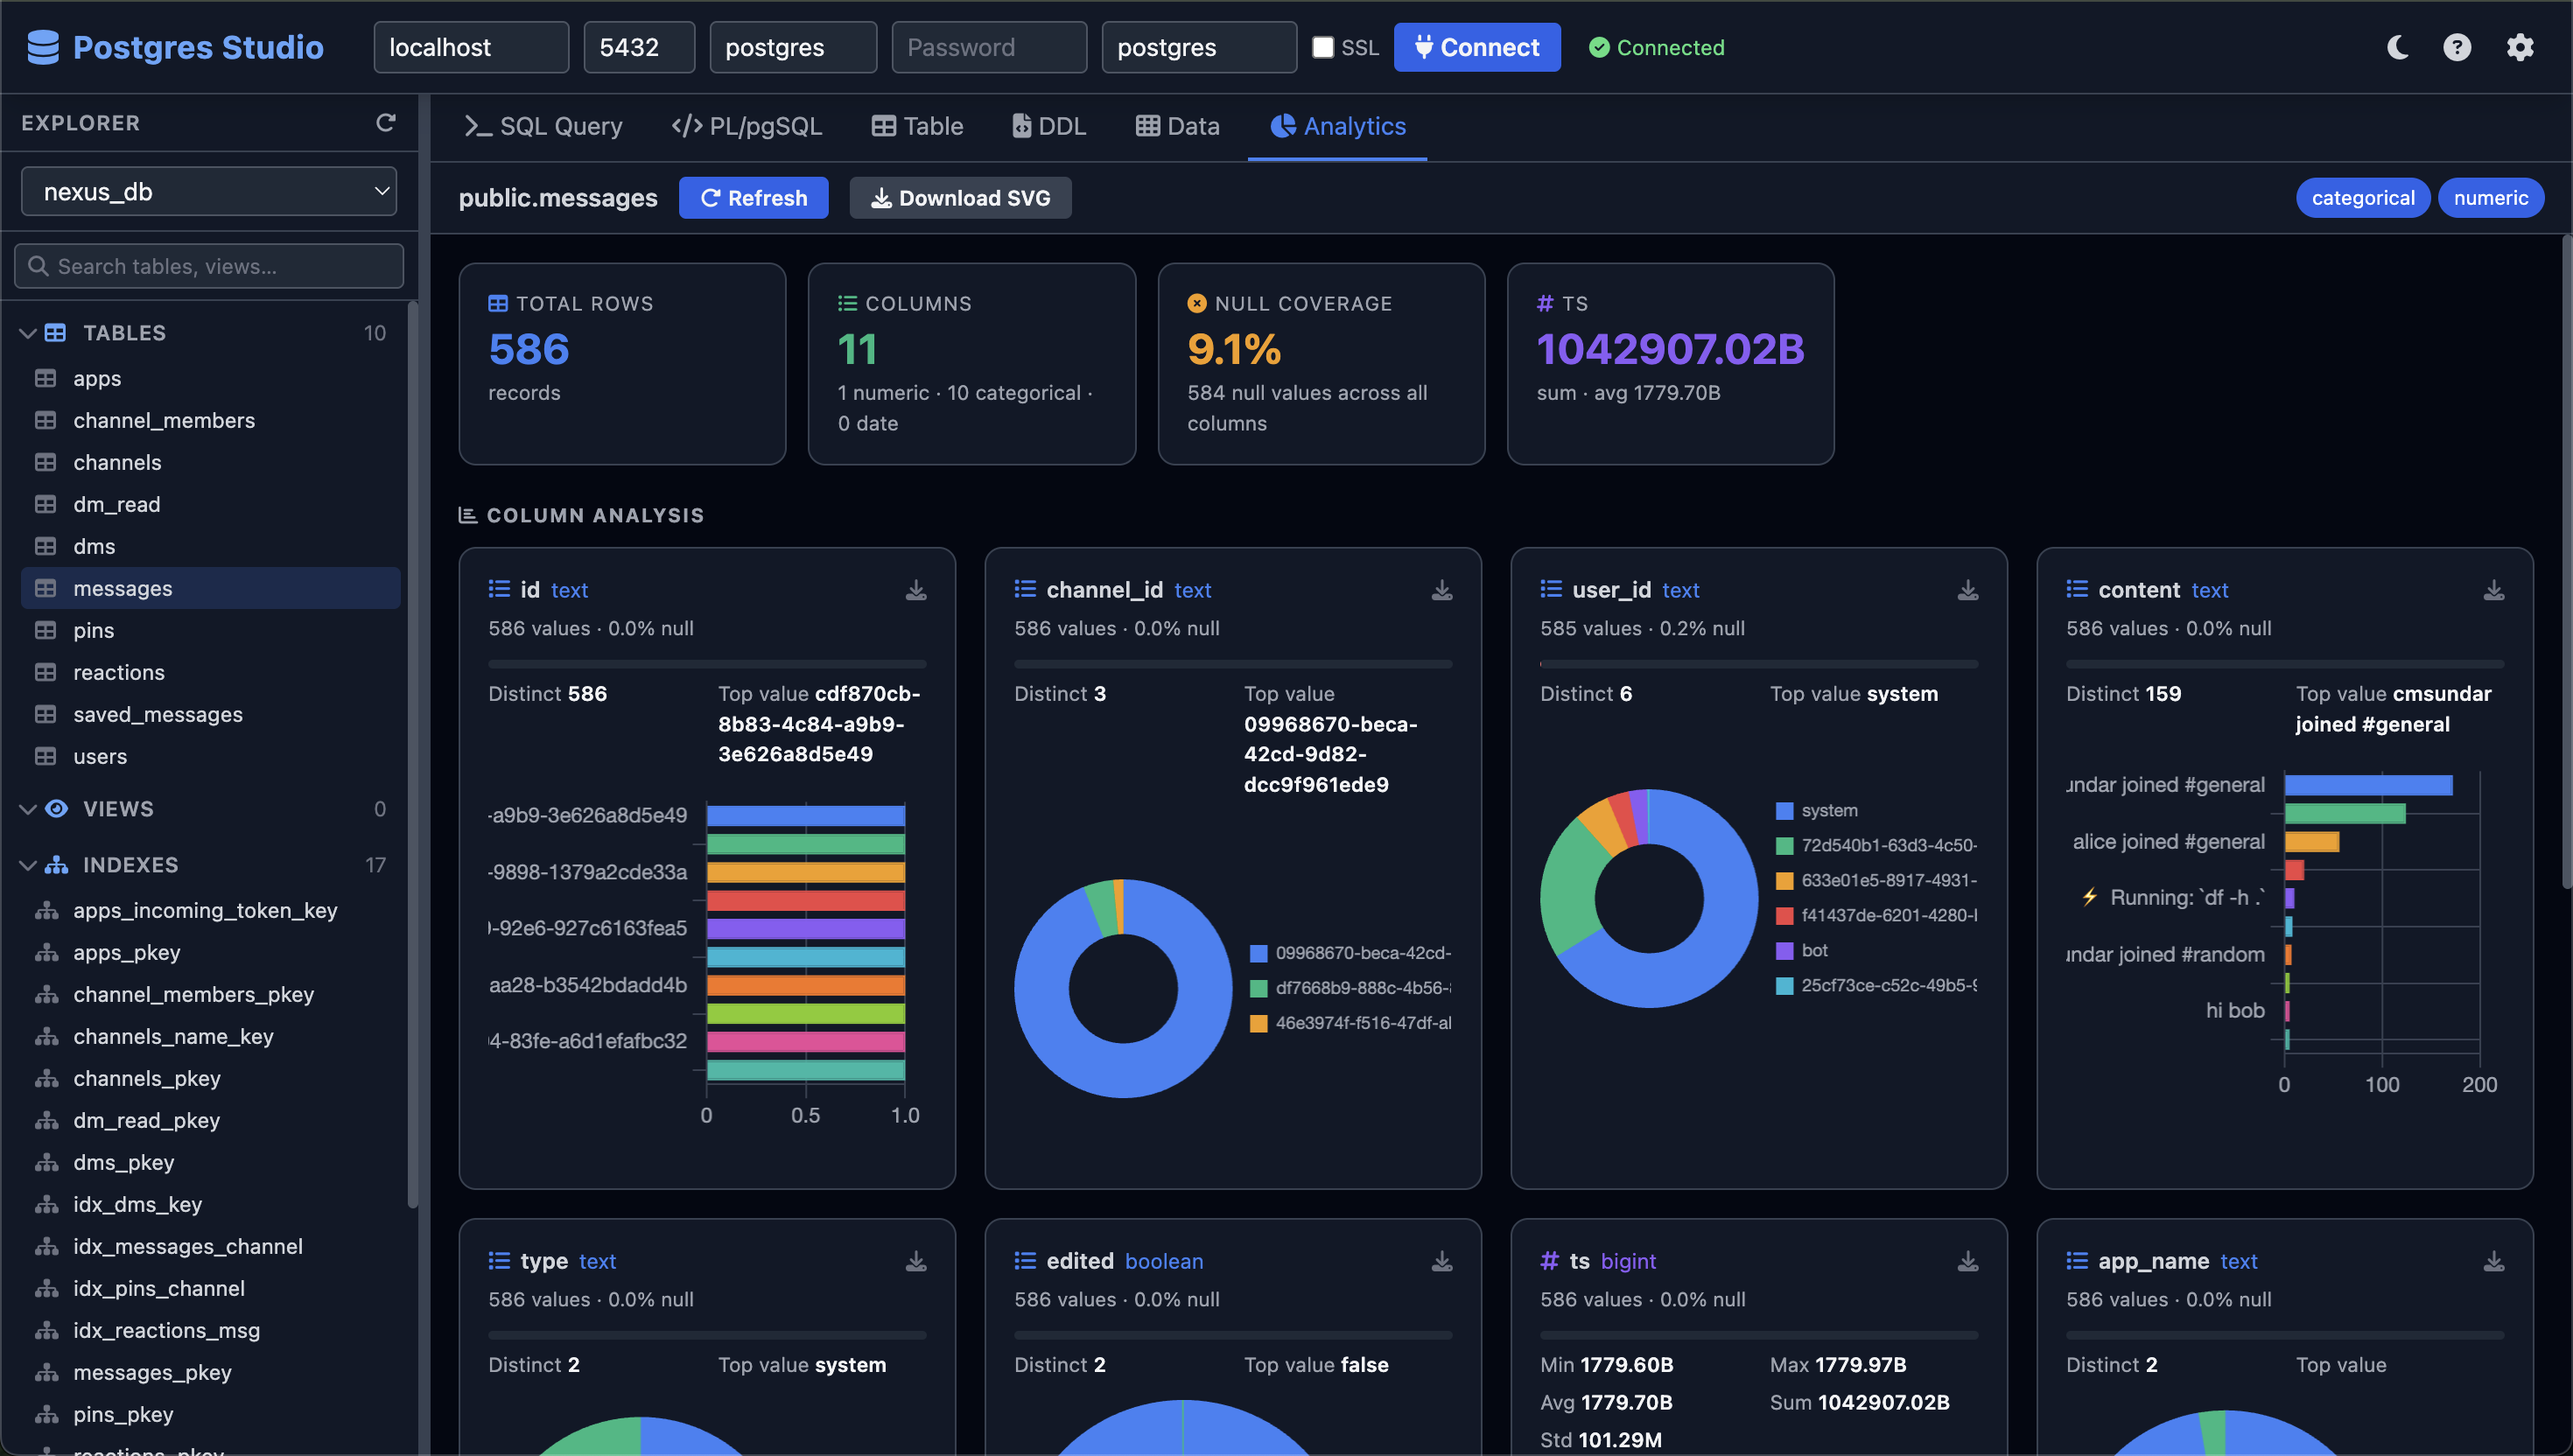
Analytics Dashboard
The Analytics tab provides an instant visual profile of any table — click a table in the Explorer to open it automatically, or click Refresh after loading.
KPI cards
The top row always shows:
- Total Rows — full record count
- Columns — count broken down by numeric / categorical / date
- Null Coverage — percentage of null values across all columns
- First two numeric columns are also promoted as KPI cards with their sum and average
Column cards
Every column gets its own card showing:
- Column name, data type, and kind badge (numeric / categorical / date)
- Fill rate with a visual null-coverage bar (red = null fraction)
Column type determines the chart:
| Column kind | Chart type | Details | |---|---|---| | Numeric | Histogram bar chart | 10 equal-width buckets + min/max/avg/sum/stddev stats | | Categorical / boolean | Doughnut (≤8 values) or horizontal bar | Top-20 values by frequency; distinct count shown | | Date / timestamp | Line chart | Monthly timeline of row counts; up to 60 months |
Filtering by column kind
Use the kind chips in the toolbar (numeric, categorical, date, other) to toggle which column types are shown. Active chips are highlighted blue.
Theme aware
Charts automatically update their colour palette when switching between dark and light mode.
SVG export
Every chart card has a download icon (↓) in its top-right corner. Clicking it downloads a self-contained .svg file for that column's chart — the canvas is embedded as a PNG <image> element inside the SVG, with the column name, type, and fill-rate included as text labels.
The Download SVG button in the Analytics toolbar exports the entire dashboard as a single SVG file:
- All visible chart cards are tiled in a 2-column grid
- Each card includes the column name, data type, and null-coverage metadata as SVG text
- A header row shows the table name, row count, chart count, and export timestamp
- The background, card borders, and text colours match the current dark/light theme
- File is named
<table>_analytics.svg
SVG files can be opened in any browser, imported into Figma/Illustrator, or embedded directly in documentation.
Data Editor
The Data tab provides a full inline record editor for any table. Click a table in the Explorer to open it automatically.
Edit a row
Click Edit (pencil) on any row to turn every cell into an editable input. Only changed columns are sent in the UPDATE. Click Save (or the toolbar Save button) to commit, or Cancel to discard.
Insert a row
Click New Row in the toolbar. A blank editable row appears at the top of the grid. Columns with serial/sequence defaults show "auto" and are excluded from the INSERT. Fill in the remaining fields and click Save.
Delete a row
Click the red trash button on any row. A confirmation modal shows the full row content before executing the DELETE. The operation requires at least one primary key column.
Pagination
Use the page-size selector (50 / 100 / 200 / 500 rows) and the ‹ › navigation buttons. The toolbar shows the current row range and total count. Click the refresh button to re-fetch after external changes.
NULL handling
- Empty inputs are treated as
NULLon save - Existing
NULLvalues are rendered as italic grey "NULL" in view mode - PK columns are highlighted in amber
Note: Edit and Delete require the table to have a primary key. Tables without a PK can still be browsed; insert is also supported.
API Reference
The Express server exposes these REST endpoints (all on the same port as the UI):
| Method | Path | Description |
|---|---|---|
| POST | /api/connect | Open a Postgres connection |
| GET | /api/databases | List all databases |
| POST | /api/use-database | Switch active database |
| GET | /api/objects | Get all tables, views, indexes, functions, sequences |
| GET | /api/table/:schema/:table/columns | Column metadata |
| GET | /api/table/:schema/:table/analytics | Per-column stats: null counts, top values, histograms, timelines |
| GET | /api/table/:schema/:table/rows | Fetch rows with ?limit= and ?offset= |
| POST | /api/table/:schema/:table/row | Insert a new row |
| PUT | /api/table/:schema/:table/row | Update a row by primary key |
| DELETE | /api/table/:schema/:table/row | Delete a row by primary key |
| GET | /api/table/:schema/:table/ddl | Approximate CREATE TABLE DDL |
| GET | /api/view/:schema/:view/ddl | CREATE VIEW DDL |
| GET | /api/function/:schema/:name/ddl | CREATE FUNCTION DDL |
| POST | /api/query | Execute arbitrary SQL |
| POST | /api/ai/query | Proxy to LLM provider |
| GET | /api/ollama/models | List Ollama models |
License
MIT (c) Mohan Chinnappan