
mcp-app-debug
v0.9.0
Published
Debug both ends of MCP Apps — render your server's app in a Playwright browser with 7 automated diagnostics, 12 under --profile (npx mcp-app-debug <server-url>), or grade a HOST's MCP Apps conformance with a probe fixture server (npx mcp-app-debug host).

Maintainers
 booyaka
Readme
mcp-app-debug
A local debug host for MCP Apps.
When your MCP App fails to render in Claude Desktop, you get nothing — no
error, no log, the iframe just never appears
(ext-apps #671).
mcp-app-debug renders your server's app in a local Playwright browser using
the same App Bridge + double-iframe sandbox path as spec-conformant
clients, shows every postMessage exchange live in a side panel, and gives
you 7 automated PASS/FAIL diagnostics that tell you exactly where the flow
broke. When it renders on one host but not another, --profile adds four
cross-host checks and tells you whether the fault is yours or the host's —
see Host profiles, and
--aggregator puts a namespacing gateway in
front of your server to catch the one bug you cannot see locally: an app
calling its tools by the bare name.
It speaks both current MCP revisions — the stateless 2026-07-28
protocol (server/discover, _meta envelopes) and the 2025-11-25
initialize handshake — and auto-detects which one your server is on.
It debugs both ends of the wire: mcp-app-debug <server-url> grades your
server, and mcp-app-debug host grades the host that connects to it —
see Grade a host.
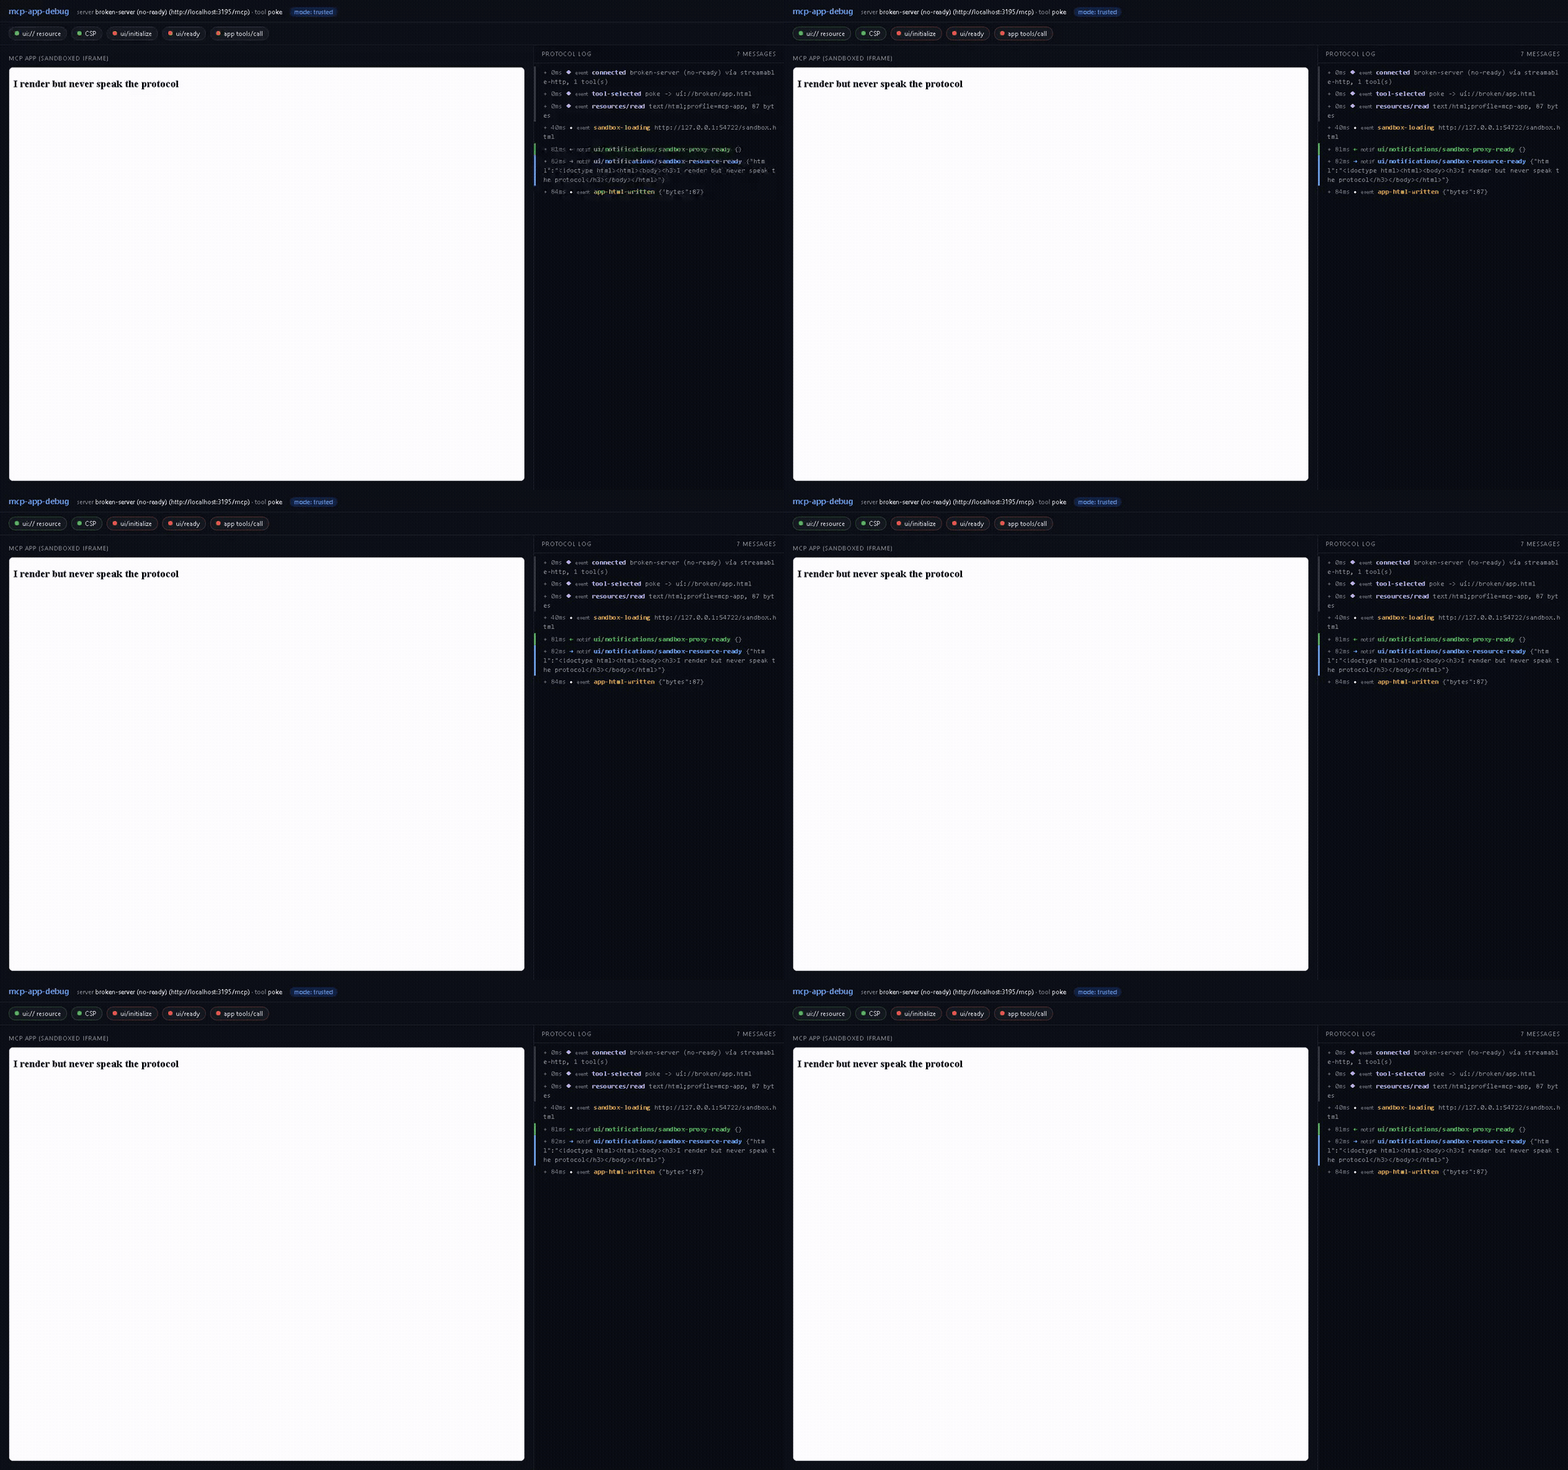
A handshake failure that would be invisible in a real client looks like this —
green up to app-html-written, then silence, and three red chips telling you
what never happened:
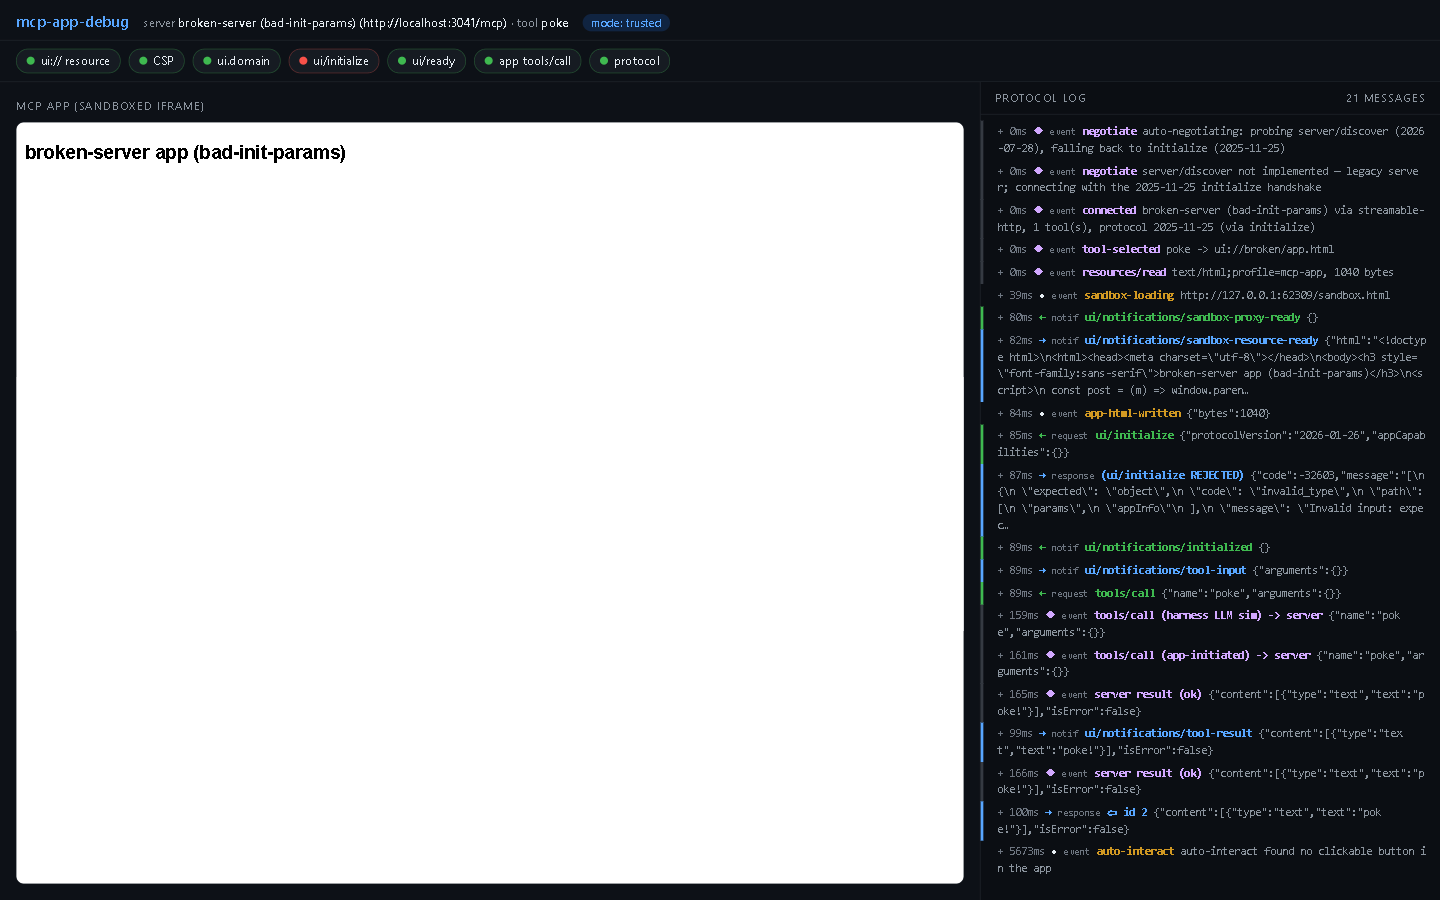
The nastier variant is a handshake that gets an answer and still fails. Here
the app renders, ui/ready fires, and its tools/call round-trips, so six
chips are green. The one red chip is ui/initialize, because the host
answered it with an error: the app never sent appInfo, and it never looked
at the reply, so it carried on as if connected. In a real client this is an
app that draws itself and does nothing.
Run it
# HTTP server (Streamable HTTP, SSE fallback)
npx mcp-app-debug http://localhost:3001/mcp

# stdio server — everything after -- is the server command line
npx mcp-app-debug --stdio -- npx -y @acme/my-mcp-server

# server behind auth
npx mcp-app-debug --header "Authorization: Bearer $TOKEN" https://api.example.com/mcp
That's the whole setup. On the very first run it downloads Chromium automatically (one-time, ~150 MB, via Playwright's installer).
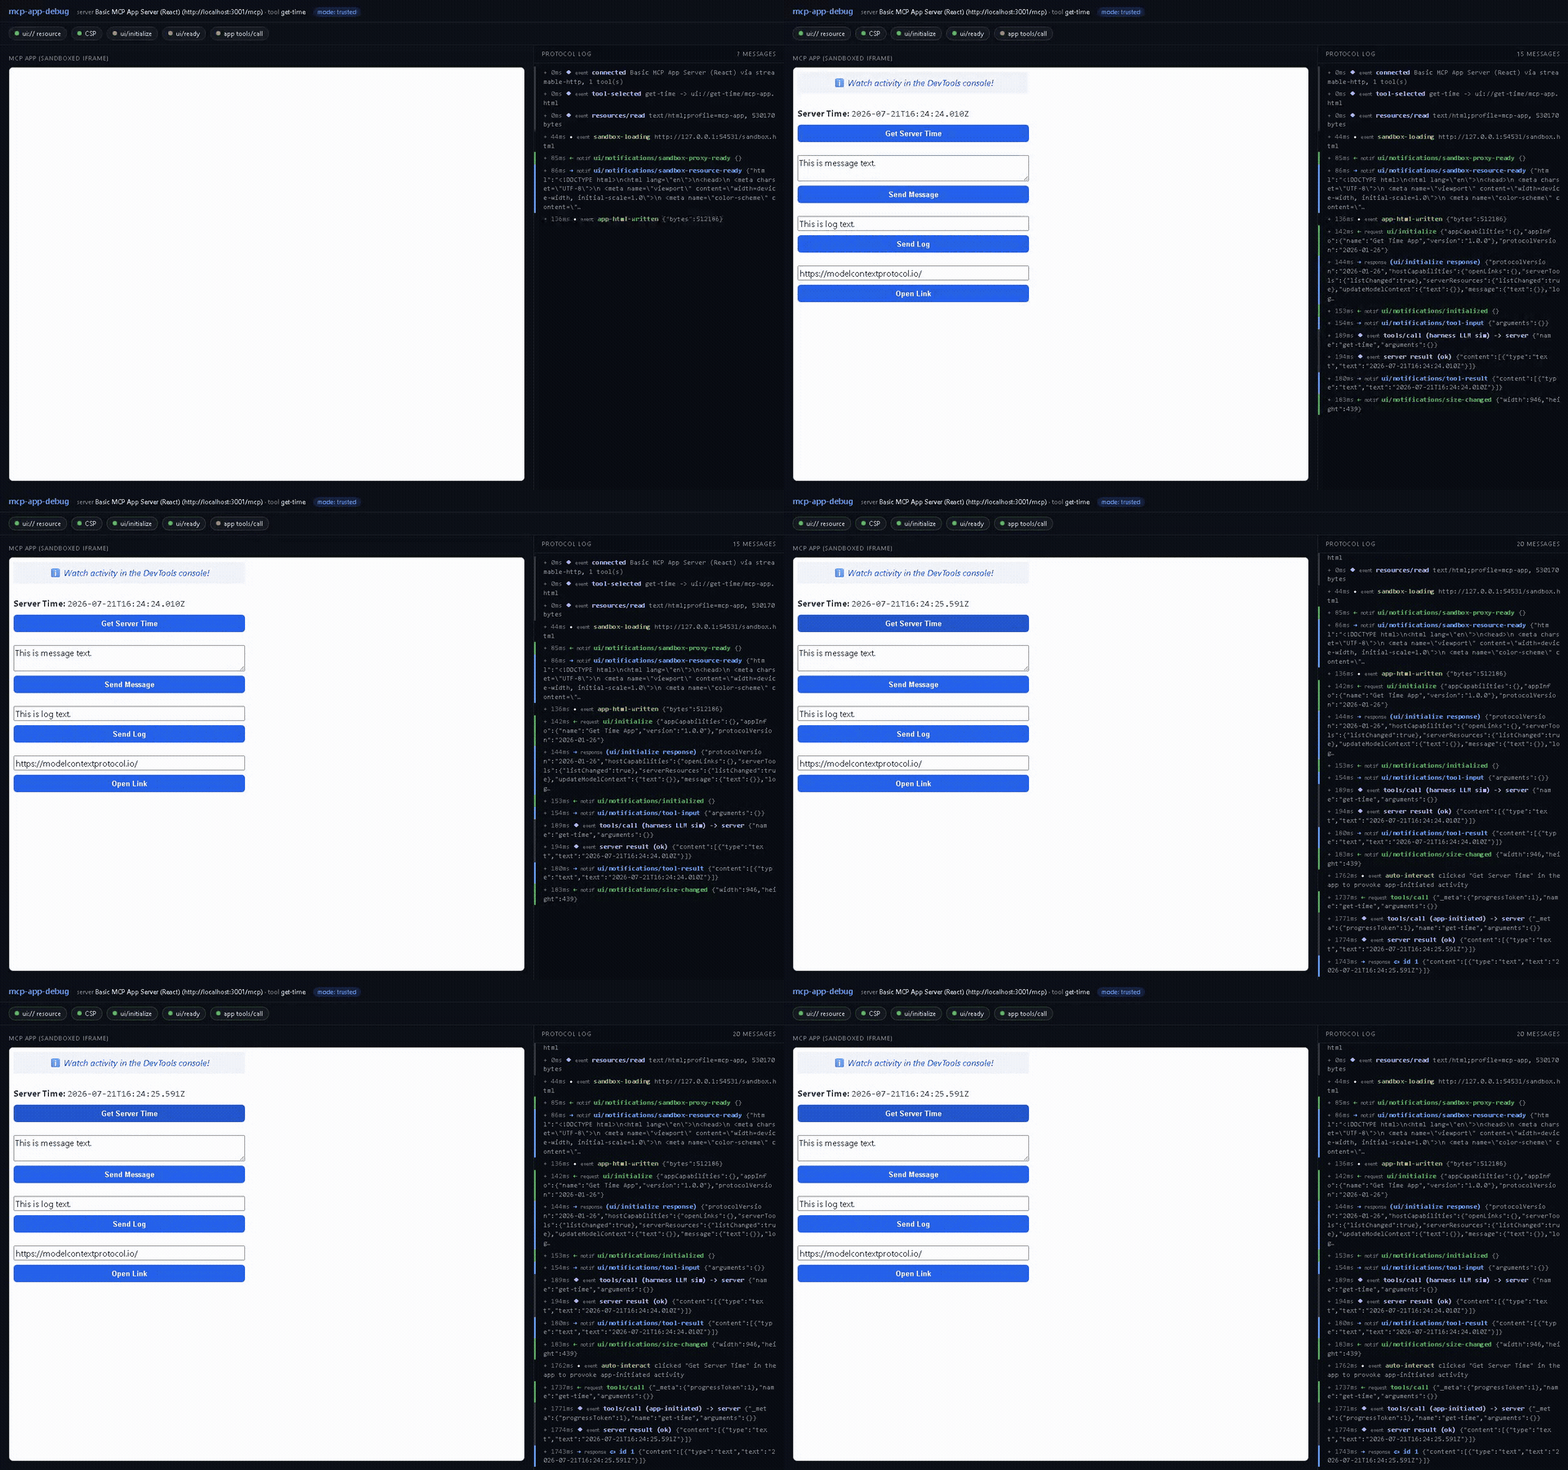
The browser window opens with your app on the left, the protocol log on the right, and the check chips on top; it stays open for interactive debugging. Once every check has passed (or at the end of the observation window, default 10 s) the verdict prints:
Results — server http://localhost:3001/mcp, tool get-time, mode trusted
  PASS  ui:// resource resolves        ui://get-time/mcp-app.html (text/html;profile=mcp-app, 530170 bytes)
  PASS  CSP permits embedding & assets no violations under the default host policy; no frame-ancestors restrictions
  PASS  _meta.ui.domain origin         matches the origin derived from this endpoint (9cdad008…claudemcpcontent.com)
  PASS  ui/initialize handshake        handshake completed in 46 ms
  PASS  ui/ready notification          app signaled ready in 51 ms
  PASS  app-initiated tools/call       app called "get-time" → non-error result (1 app call(s) total)
  PASS  protocol revision              negotiated 2025-11-25 via initialize (legacy path); server/discover not implemented (legitimate during the 12-month deprecation window)
  PASS  server declares io.modelcontextprotocol/ui  declared in the initialize result's capabilities.extensions
  8/8 checks passed OK
The 8 checks
- ui:// resource resolves — the tool's
_meta.ui.resourceUriis a validui://URI andresources/readreturns exactly onetext/html;profile=mcp-appcontent item. - CSP permits embedding & assets — the sandbox is served with the real
HTTP
Content-Security-Policyheader a conformant host builds from your_meta.ui.csp(same policy construction as the official basic-host); anysecuritypolicyviolationfired while your app renders fails this check, as does aframe-ancestorsdirective in your HTML that would block embedding. _meta.ui.domainorigin — if your resource declares a domain, it must match the origin the host derives from your endpoint (sha256(<endpoint URL>)[:32] + ".claudemcpcontent.com"on Claude). Getting this wrong is fatal — Claude declines to mount the iframe at all — while omitting it is harmless for rendering but means the sandbox origin is minted fresh on every render, so an API server can't allowlist it. When the value you sent is the hash of a near-miss endpoint spelling (a stray trailing slash, a missing/mcp, the wrong scheme), the check names which one.- ui/initialize handshake — your app's
ui/initializerequest is answered successfully within 3 s of HTML injection. A JSON-RPC error reply is a FAIL naming the rejected field:appInfoandappCapabilitiesare both required in the params, and an app that firesui/notifications/initializedwithout awaiting the reply runs on through a rejection, so checks 5 and 6 can still look healthy while a real client has no connected app. - ui/ready notification —
ui/notifications/initialized(the "ui/ready" signal) arrives within 5 s. - app-initiated tools/call — at least one
tools/callinitiated by your app returned a non-error result. After the handshake the harness simulates the LLM flow (tool-input→ server call →tool-result) and then clicks the first button in your app (or the one you name with--click <text>) to provoke real app activity. - protocol revision — the protocol negotiation succeeded cleanly. Reports
which revision was negotiated and whether
server/discoveranswered. FAILs when a server speaks 2026-07-28 but does not implementserver/discover(a MUST in that revision). A 2025-11-25 server passes with a note, legitimate during the 12-month deprecation window. - server declares io.modelcontextprotocol/ui — the server advertises the
extension in its own
capabilities.extensions, read fromserver/discoveron 2026-07-28 and from theinitializeresult on 2025-11-25.registerAppToolandregisterAppResourcedo not declare it for you: they set the tool_metaand the resource mime type and register no capability. A host that gates on the extension will then fetch nothing and mount nothing, which is indistinguishable from a host-side render bug (claude-ai-mcp#165). SKIPs rather than passes when the capabilities cannot be read.
Beyond the checks, the log surfaces the evidence silent failures hide: app
console.errors, uncaught exceptions, failed network requests, CSP violation
details, and every JSON-RPC frame with direction and timing.
Host profiles and the fault verdict (--profile)
When an app renders on one host and breaks on another, the first question is
whether the bug is yours.
ext-apps #750
is the shape of it: the same resource renders on ChatGPT and Claude but goes
stale, hangs or duplicates on Grok.
ext-apps #671
is the same question from the other side — "the tool runs and returns
normally, but no iframe mounts". The seven checks above are all mount-time and
single-widget, so they cannot tell those apart. --profile can.
npx mcp-app-debug http://localhost:8787/mcp --profile spec      # normative baseline
npx mcp-app-debug http://localhost:8787/mcp --profile grok      # spec, then grok
npx mcp-app-debug http://localhost:8787/mcp --profile all       # the divergence matrix
npx mcp-app-debug http://localhost:8787/mcp --profile all --json
A profile is a descriptor of the observable knobs a host applies — sandbox
tokens, CSP directives, whether popups are allowed, whether tool-result is
redelivered after a state change, how many concurrent instances mount, and
whether _meta.ui.domain is enforced. Naming a non-spec profile runs the spec
baseline first, so the verdict is always computable.
Only
specis normative. It mirrors the 2026-07-28 spec and ext-apps 1.7.x defaults (strict CSP with nounsafe-eval, sinceAppOptions.allowUnsafeEvaldefaults tofalsein v1.7.0;object-srcsynced withdefault-srcper v1.7.5). Theclaude-desktop,claude-web,chatgptandgrokprofiles are community-observed reports, not vendor documentation. Nobody from those vendors publishes these knobs; each one is derived from a public issue or an SDK release, and every descriptor must cite its sources — a descriptor with an emptysourcesarray is refused at load time. They are a way to reproduce a reported symptom locally, not a claim about what any vendor's host does today. This tool still does not claim to verify host compliance with SEP-1865. Readsrc/profiles/*.json; they are short, and you can pass your own descriptor path instead of a built-in name. Check 11 sits outside this scheme for the same reason: fronting servers with a namespacing aggregator is a deployment choice, not something the spec asks of an app, so it runs only where you say a rewrite is in play (--aggregator, or a descriptor withtoolNameRewrite) and never on a barespecrun.
Checks 8-10 and 12 (profile mode only)
(11 is aggregator-only and lives below.)
- tool-result redelivery — a second
tools/callwith different arguments goes through the same connection to the already-mounted app. PASS when a secondtool-resultreaches it. This is #750's symptom 1: the widget showing a completed transaction as still pending.SKIPs honestly when the tool takes no arguments to vary. - multi-instance isolation — the same view is mounted twice in one
page. PASS needs two distinct
ui/initializehandshakes and zero postMessages crossing between them (each instance'stool-resultcarries its own_metamarker, so leakage is visible on the wire).SKIPs when the server returns a singletonui://resource that cannot be read twice. - external navigation —
window.openand atarget=_blankclick from inside the sandbox.INFOunder spec (the sandbox has noallow-popups, so blocking is correct and worth recording, not failing). It only FAILs when the active profile grants popups and navigation is blocked anyway, and it distinguishes a sandbox-level block from a browser-level one. - declared CSP origins reachable — check 2 reads the policy, this one
tries it. After
ui/readythe harness injects a probe into the sandbox: an<img>per_meta.ui.csp.resourceDomainsorigin and afetch()perconnectDomainsorigin, each to<origin>/__mcp-app-debug-probe. A Playwright route answers every one of those with204locally, so nothing leaves your machine and the check is about the policy, not about whether the origin is up. A request that reaches the route is reachable; asecuritypolicyviolationnaming the origin means the sandbox stopped it before any request was made.SKIPs when the server declares no_meta.ui.csp. Wildcards are probed at a synthetic subdomain (https://*.example.com→https://mcp-app-debug-probe.example.com) and the check says so; entries CSP accepts but nothing can be requested from (cdn.example.com,*,https:) are reported as unprobeable rather than counted as blocked. A source expression's path counts too, so an entry ending in/is probed under its own prefix (https://cdn.example.com/assets/→https://cdn.example.com/assets/__mcp-app-debug-probe), and one naming an exact file is reported as unprobeable, because the only request that could match it is a real request for that real file. If a probe simply never comes back inside its 2 s window the check reportsINFO, not a failure: a loaded machine is not evidence about the declaration.
Check 12 is where
ext-apps #761
shows up. claude.ai's sandbox proxy destructures only {html, permissions}
from the resource and never reads csp, so the resourceDomains you declared
never reach the policy the sandbox is served with, and your app's images and
API calls are blocked on a host where you did nothing wrong. That is modelled
by the appliesResourceCsp knob, false only on claude-web. Rows 2 and 12 of
eleven, against the csp-origins fixture, long lines wrapped:
$ npx mcp-app-debug http://localhost:3001/mcp --profile claude-web

  PASS   2 CSP permits embedding & assets no violations; _meta.ui.csp honored:
                                          {"resourceDomains":["https://cdn.example.com"],
                                           "connectDomains":["https://api.example.com"]}
  FAIL  12 declared CSP origins reachable 0/2 reachable; img-src blocked
                                          https://cdn.example.com/__mcp-app-debug-probe, connect-src blocked
                                          https://api.example.com/__mcp-app-debug-probe. This host does not apply
                                          _meta.ui.csp (ext-apps#761); the app is correct.

VERDICT: APP-OK-HOST-SUSPECT — every check passes under spec, but claude-web: declared CSP origins reachable fail(s) under
a community-observed profile; the divergence is on the host side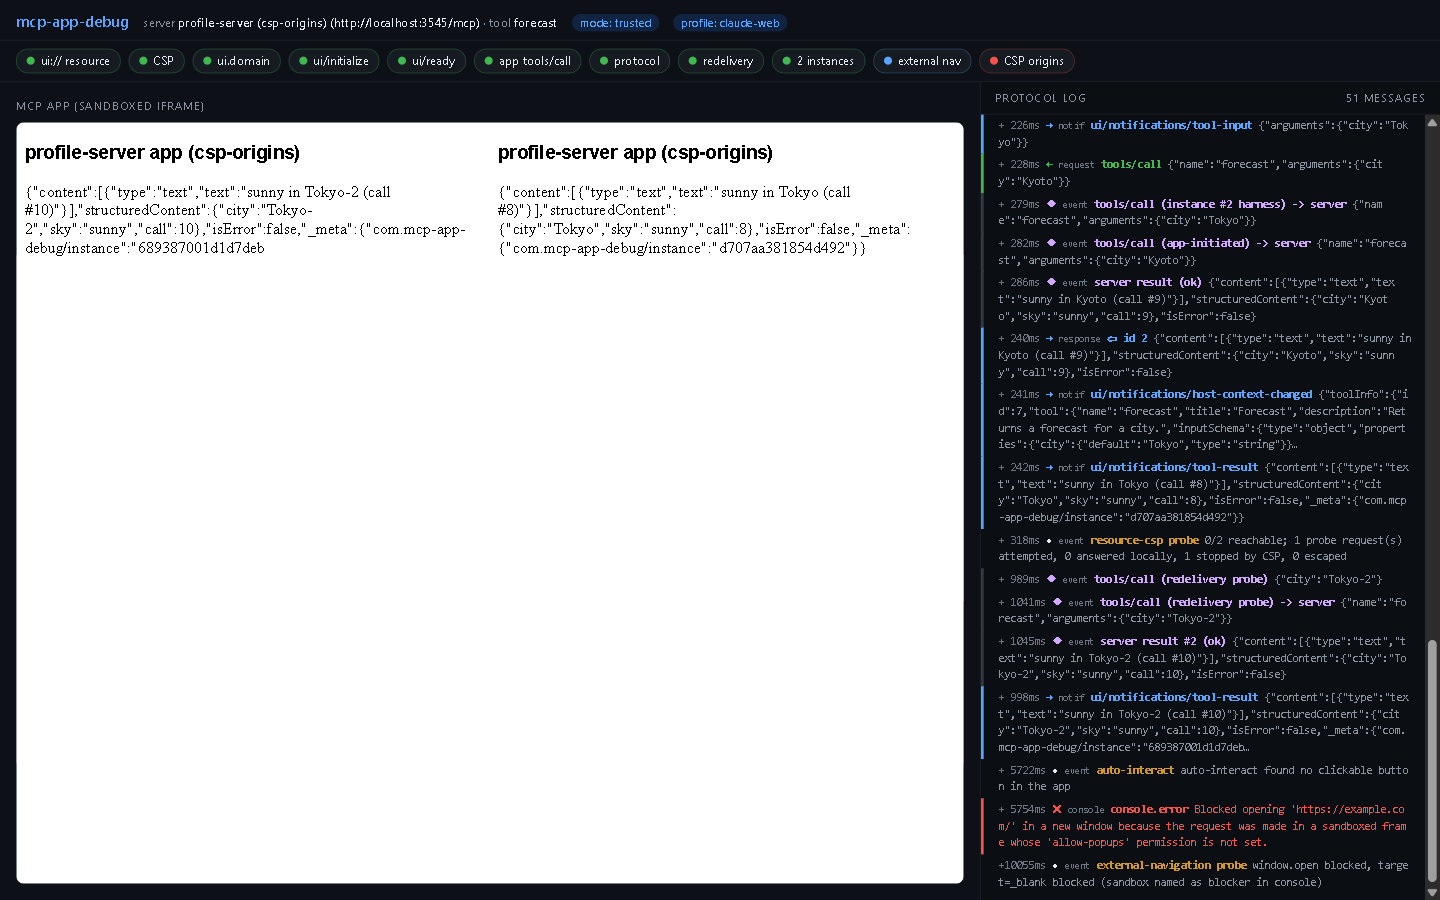
Check 2 stays exactly as it was: it reports violations your app caused, and the probe's deliberate ones are filtered out of it. That is the pair of chips in the shot above, green next to red, on a run where the app did nothing wrong. Reading one against the other is the point. Check 2 green and check 12 red means the declaration is right and the host ignored it.
The knobs a descriptor sets
| Knob | What it models | Check it drives |
| --- | --- | --- |
| sandboxTokens | the sandbox attribute the host puts on the iframe | 10 |
| csp | frame-ancestors, script-src, default-src, object-src of the served policy | 2, 12 |
| popupsAllowed | whether the host intends external navigation to work | 10 |
| redeliversToolResult | whether a later tools/call result reaches a mounted app | 8 |
| maxConcurrentInstances | how many copies of one view mount at once | 9 |
| honoursUiDomain | whether _meta.ui.domain is enforced or ignored | 3 |
| appliesResourceCsp | whether the sandbox proxy folds your _meta.ui.csp resourceDomains/connectDomains into the policy it serves (ext-apps#761) | 12 |
| toolNameRewrite | a namespacing gateway in front of the server | 11 |
| sources | the public evidence for every knob above; an empty list is refused at load | — |
appliesResourceCsp and toolNameRewrite both default to true/absent, so a
descriptor written before 0.8.0 still loads unchanged.
The verdict then attributes fault:
| Verdict | Meaning | Exit |
| --- | --- | --- |
| APP-FAULT | a check fails under spec — fix your app before blaming a host | 1 |
| APP-OK-HOST-SUSPECT | passes under spec, fails under a named profile — the divergence is host-side | 0, or 1 if the failing check is blocking |
| APP-OK | everything passes everywhere it ran | 0 |
Reading APP-OK-HOST-SUSPECT. It means your app is correct and something
about the host is not. Whether that is actionable depends on which check
failed, which is why the exit code splits:
- Check 8 under
grokis withheld by the descriptor for every app, so it says nothing about yours. Exit0, the run is informational. - Check 12 is contingent on what your server declared: your app asked for
origins this host will not grant it, so on that host it does not work. Exit
1, so CI does not go green on "it renders but loads nothing". The verdict line still readsAPP-OK-HOST-SUSPECT, because the fix is an issue on the host, not a change to your app.
Checks that fail this way carry "blocking": true on their evidence entry
in the JSON report, so CI can say which check took the exit code to 1.
Real run against a third-party server
Captured output, not hand-written: this is --profile all against
primevalsoup/mcp-apps-claude-demo,
the minimal cross-host demo #750 cites as working, cloned and served locally on
port 8787.
                                   spec            claude-desktop  claude-web      chatgpt         grok
1 ui:// resource resolves          PASS            PASS            PASS            PASS            PASS
2 CSP permits embedding & assets   PASS            PASS            PASS            PASS            PASS
3 _meta.ui.domain origin           FAIL            FAIL            FAIL            INFO            INFO
4 ui/initialize handshake          FAIL            FAIL            FAIL            FAIL            FAIL
5 ui/ready notification            PASS            PASS            PASS            PASS            PASS
6 app-initiated tools/call         FAIL            FAIL            FAIL            FAIL            FAIL
7 protocol revision                PASS            PASS            PASS            PASS            PASS
8 tool-result redelivery           SKIP            SKIP            SKIP            SKIP            SKIP
9 multi-instance isolation         FAIL            FAIL            FAIL            FAIL            FAIL
10 external navigation             SKIP            SKIP            SKIP            SKIP            SKIP
12 declared CSP origins reachable  SKIP            SKIP            SKIP            SKIP            SKIP

VERDICT: APP-FAULT — _meta.ui.domain origin, ui/initialize handshake, app-initiated tools/call, multi-instance isolation fail(s) under the spec profile; fix the app/server before suspecting any host
Row 3 is the whole point of the matrix: the same observation is a FAIL on the
Claude profiles and an INFO on chatgpt/grok, because only Claude hosts are
reported to derive that value. Read the detail line and the reason is concrete
rather than mysterious:
FAIL   3 _meta.ui.domain origin   declared "187f71d263d6cc8b3a92ca14ca4055b2.claudemcpcontent.com" but this
                                  endpoint derives "1e7037d0e74fbc84d7746b9da9adb5bc.claudemcpcontent.com" —
                                  that value is the hash of the same URL with the scheme swapped; recompute it
                                  from the exact URL the connector was added with.
FAIL   4 ui/initialize handshake  the host REJECTED the app's ui/initialize (-32603: invalid_type at
                                  params.appInfo) — appInfo and appCapabilities are both required in the params.
SKIP   8 tool-result redelivery   tool is not argument-sensitive — it has no input property to vary between calls
SKIP  12 declared CSP origins reachable  _meta.ui.csp declares no resourceDomains or connectDomains; nothing to probe
Every one of those is honest and specific. That demo computes its domain from
https://<host>/mcp because it is meant to sit behind an HTTPS tunnel, while
this run reached it over plain http://localhost:8787, so check 3 correctly
reports a scheme-swap near miss that would not occur behind the tunnel. Its
ui/initialize params predate the appInfo/appCapabilities requirement the
current ext-apps SDK enforces, which is check 4, and because the widget sends
ui/notifications/initialized without awaiting the reply it renders anyway and
check 5 still passes. Check 9 is the same rejection hitting the second instance,
and check 10 SKIPs because no app frame survived it. Its get_stats widget is a
static bar chart with no button, so nothing provokes an app-initiated
tools/call (check 6) and there is no argument to vary (check 8 SKIPs rather
than inventing a failure).
Check 12 is worth reading closely. The demo ships
csp: { connectDomains: [], resourceDomains: [] } because the widget is
self-contained, which is a declaration with nothing in it rather than no
declaration at all, and the SKIP reason says which of the two it was. None of
this is a defect in that demo; it is what a tunnel-shaped server, a widget older
than the current SDK, and a self-contained bundle actually look like from here,
and the tool says so in words you can act on.
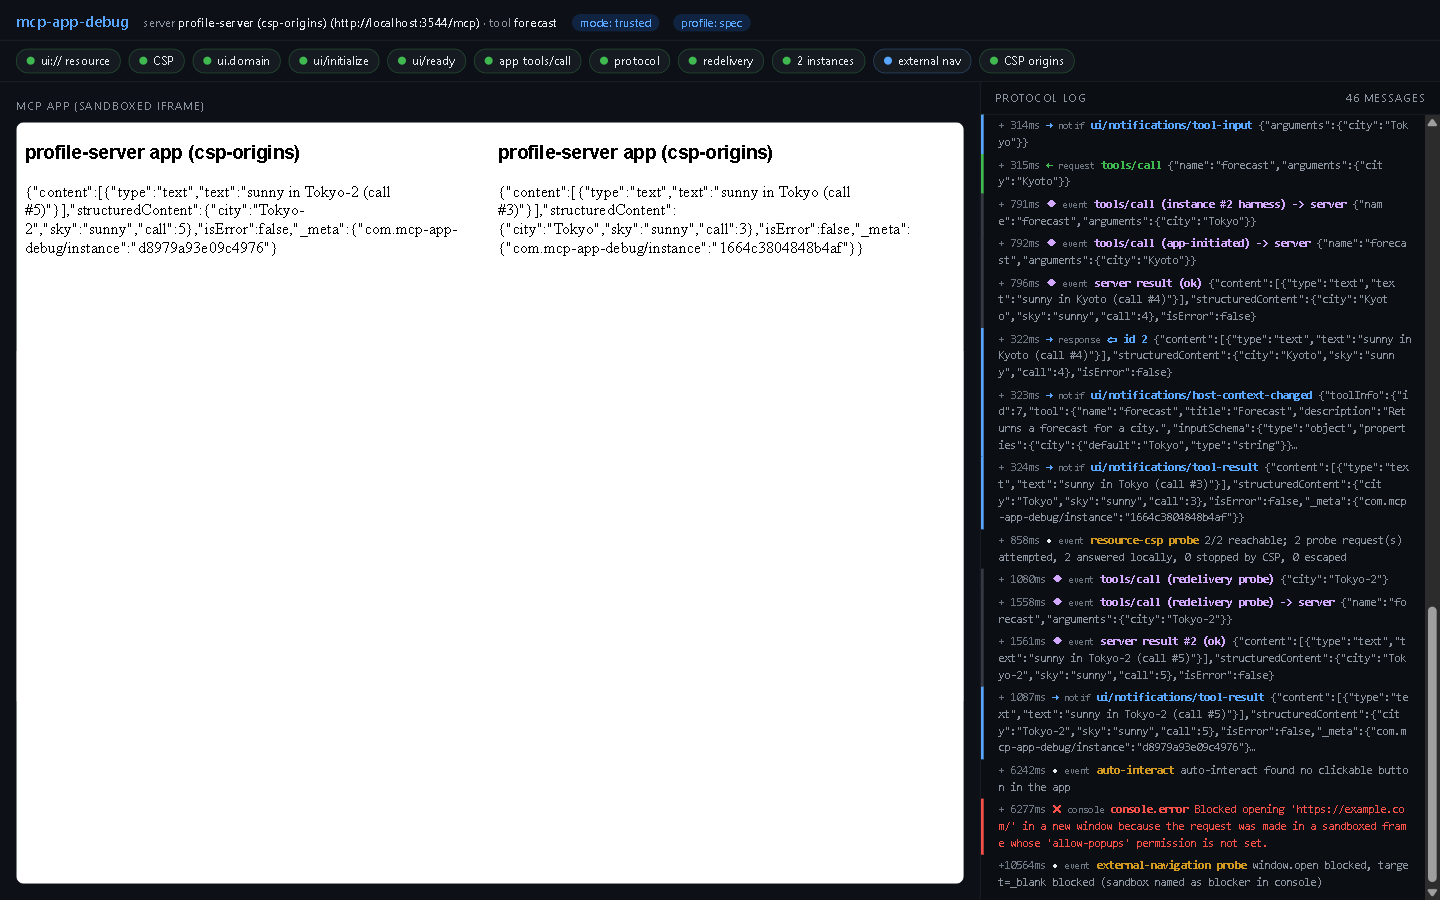
Here is the same thing against a fixture where every check resolves. Note the two instances mounted side by side for check 9, the redelivery probe and the check 12 probe in the log, and the chips for checks 8-10 and 12 along the top:
--json for an issue report
--profile … --json emits {verdict, profile, matrix, evidence[]}, shaped so
you can paste it straight into an ext-apps issue. matrix.cells[row][col]
follows matrix.checks × matrix.profiles, and each evidence entry carries
the observation plus the raw protocol frames behind it. An entry gains
"blocking": true when that failure is what took the exit code to 1:
{"verdict":"APP-OK-HOST-SUSPECT","profile":"grok",
 "matrix":{"checks":["resource-uri","csp","ui-domain","ui-initialize","ui-ready","tool-call",
                     "protocol-revision","tool-result-redelivery","multi-instance-isolation","external-navigation",
                     "resource-csp-effective"],
           "profiles":["spec","grok"],
           "cells":[["PASS","PASS"],["PASS","PASS"],["PASS","PASS"],["PASS","PASS"],["PASS","PASS"],
                    ["PASS","PASS"],["PASS","PASS"],["PASS","FAIL"],["PASS","PASS"],["INFO","INFO"],
                    ["SKIP","SKIP"]]},
 "evidence":[{"check":"tool-result-redelivery","profile":"spec",
              "observation":"PASS: second tool-result observed after 7ms (city: \"Tokyo-2\")","timestampMs":7,
              "rawMessages":["+946ms server event tools/call (redelivery probe) {\"city\":\"Tokyo-2\"}", "…"]},
             {"check":"tool-result-redelivery","profile":"grok",
              "observation":"FAIL: app received tool-result #1 but the grok profile models a host that does not redeliver tool-result after further tools/call (ext-apps#750 symptom 1) — the app is left showing stale state",
              "timestampMs":null,"rawMessages":["…"]}]}
With --profile all, --video, --screenshot and --log-file are written
once per profile, suffixed with the profile name
(session.spec.webm, session.grok.webm, …).
Behind a gateway (--aggregator)
Your app works. Then somebody puts your server behind an MCP gateway that namespaces tool names to avoid collisions, and every button in your widget stops working, while the model's calls keep going through.
ext-apps #745
has the frames. The gateway exposes an upstream's get-time as
alpha__get-time, so the app's call:
{"method":"tools/call","params":{"name":"get-time"}}
{"error":{"code":-32043,"message":"unknown name \"get-time\": no upstream owns this namespace"}}
and the model's call with alpha__get-time succeeds.
#753 counts
fifteen official example apps with the bare name written into the bundle,
including the six basic-server-* templates, which are what third parties
fork. Both issues name the same fix: read
getHostContext().toolInfo.tool.name, the name the host knows.
--aggregator puts that gateway in front of your server locally:
npx mcp-app-debug http://localhost:3001/mcp --aggregator            # prefix alpha__
npx mcp-app-debug http://localhost:3001/mcp --aggregator gateway.   # your own prefix
Every tool is advertised to your app as <prefix><name>, toolInfo carries
that name, and a tools/call arriving with the bare name is answered with
#745's error instead of being fulfilled, so the failure happens on your
machine rather than in somebody's production gateway. The model-side simulation
uses the rewritten name throughout, because that is what a real aggregating
host holds. A tool whose name already contains the separator is not prefixed
twice.
Check 11 (aggregator mode only)
- aggregator-safe tool names — every
tools/callyour app initiated used the name the host advertised, taken either fromhostContext.toolInfoor from atools/listthrough the bridge (#745 names both routes).SKIPs when the app never called a tool, because check 6 already reports that. A FAIL isAPP-FAULTeven under a non-spec profile: both issues put the fix in the app.
Captured output, not hand-written. This is the bundled bare-names fixture, a
view with its tool name written in (the #753 shape), run with the descriptor
below so the spec baseline goes first:
Profile aggregator — server http://localhost:3601/mcp, tool alpha__forecast, mode trusted
  ...
  FAIL   6 app-initiated tools/call     app made 2 tools/call(s), all returned errors (first: "forecast")
  ...
  FAIL  11 aggregator-safe tool names   app sent tools/call name="forecast" but the host advertised "alpha__forecast" in hostContext.toolInfo.tool.name; a namespacing aggregator answers -32043 for the bare name and every interaction after mount fails (ext-apps#745, #753)

                                  spec        aggregator
1 ui:// resource resolves         PASS        PASS
2 CSP permits embedding & assets  PASS        PASS
3 _meta.ui.domain origin          PASS        PASS
4 ui/initialize handshake         PASS        PASS
5 ui/ready notification           PASS        PASS
6 app-initiated tools/call        PASS        FAIL
7 protocol revision               PASS        PASS
8 tool-result redelivery          PASS        PASS
9 multi-instance isolation        PASS        PASS
10 external navigation            INFO        INFO
11 aggregator-safe tool names     SKIP        FAIL

VERDICT: APP-FAULT — aggregator-safe tool names fail(s) under aggregator; the app must read the tool name the host advertises (ext-apps#745, #753)
Check 6 fails alongside it, and that is the honest reading: behind a real
gateway this widget renders and then does nothing. Its fixed twin
(resolved-names, the same view using #753's resolveToolName()) passes both:
  PASS   6 app-initiated tools/call     app called "alpha__forecast" → non-error result (2 app call(s) total)
  PASS  11 aggregator-safe tool names   app resolved "alpha__forecast" from hostContext.toolInfo (2 app call(s), 0 bare)
Without --profile it is the plain seven checks plus row 11, and the panel
gets a tool names chip. The log has the whole exchange: the model's call
going out as alpha__forecast, the app's coming back -32043, and the
toolInfo the app should have read.
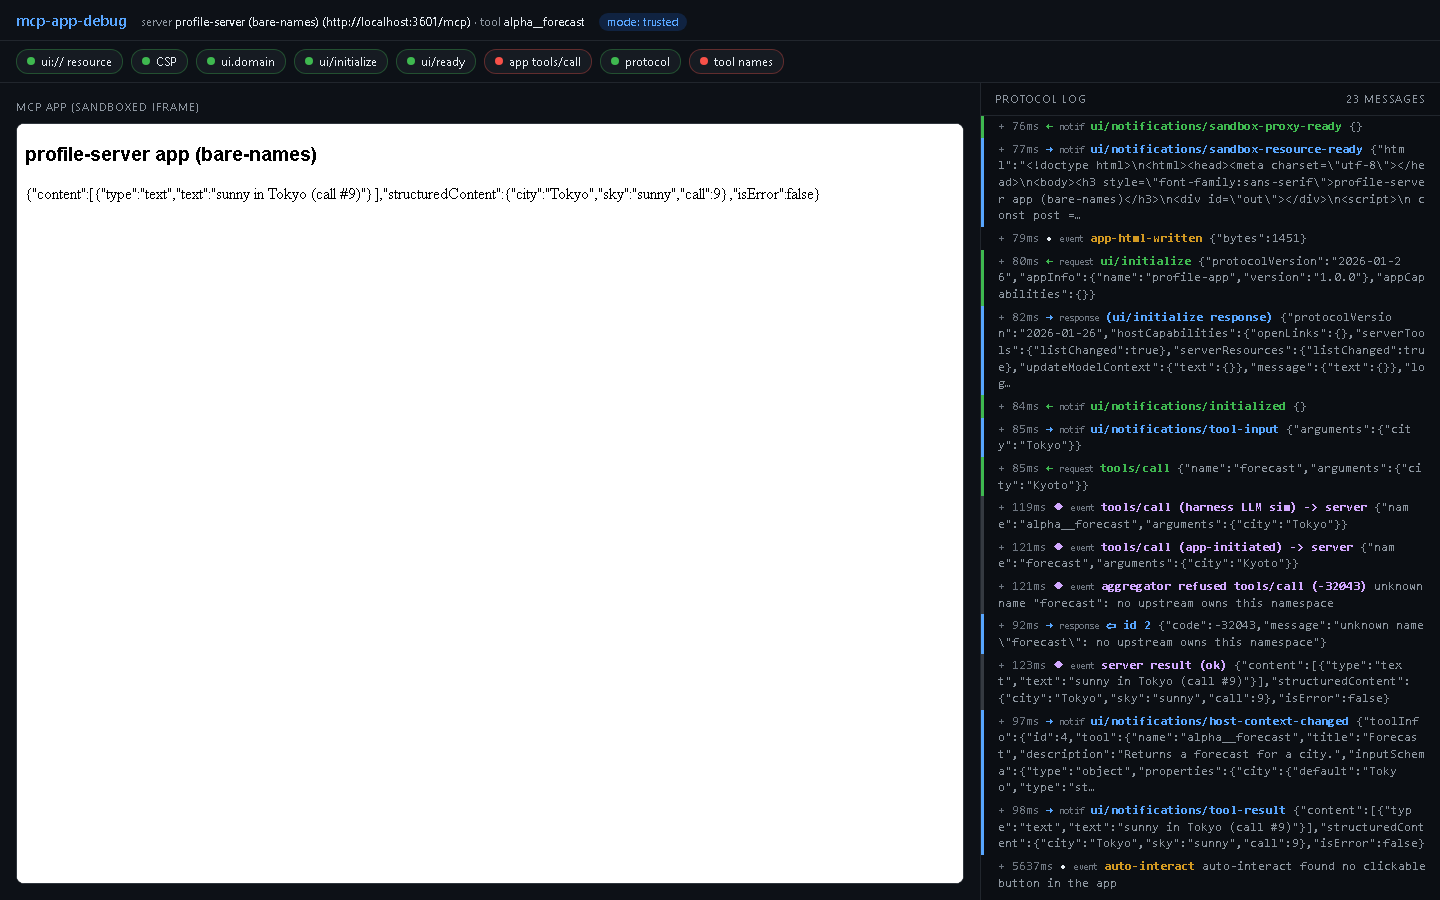
The check only exists when you ask for it. A run without --aggregator has no
row 11 at all, and --profile spec never gains one, because fronting servers
with a gateway is a deployment choice rather than something the spec asks of an
app. A descriptor can turn it on for one profile instead of the whole run:
{
  "name": "aggregator",
  "description": "spec knobs plus a namespacing gateway in front of the server",
  "sandboxTokens": ["allow-scripts", "allow-same-origin", "allow-forms"],
  "csp": { "frameAncestors": "'self'", "scriptSrc": "'self' 'unsafe-inline' blob: data:",
           "defaultSrc": "'self' 'unsafe-inline'", "objectSrc": "'self' 'unsafe-inline'" },
  "popupsAllowed": false,
  "redeliversToolResult": true,
  "maxConcurrentInstances": 2,
  "honoursUiDomain": true,
  "appliesResourceCsp": true,
  "toolNameRewrite": "alpha__",
  "sources": ["https://github.com/modelcontextprotocol/ext-apps/issues/745",
              "https://github.com/modelcontextprotocol/ext-apps/issues/753"]
}
--profile all --aggregator then prints a twelve-row matrix, with
aggregator-safe-tool-names in matrix.checks under --json.
hostContext.toolInfo, with or without the flag
None of the above works if the host never tells the app which name it used.
The 2026-01-26 apps spec lists toolInfo on hostContext, "Metadata of the
tool call that instantiated the View", and until 0.7.0 this harness did not
send it, so an app written the correct way found nothing to read. It is there
now on every run, both for the mounted view and for check 9's second instance:
{"toolInfo":{"id":4,"tool":{"name":"forecast","title":"Forecast",
  "description":"Returns a forecast for a city.",
  "inputSchema":{"type":"object","properties":{"city":{"default":"Tokyo","type":"string"}}}}}}
toolInfo.id is the real JSON-RPC id of the tools/call on the wire. It
arrives a moment after the handshake, over
ui/notifications/host-context-changed, because this harness mounts the view
from resources/read and only then simulates the model's call: at
ui/initialize time the name exists and the id does not. Apps read the name,
which is there from the first frame.
Grade a host (host conformance mode)
The mirror image of a broken server is a host or agent framework that
silently drops MCP Apps fields — the app never renders and nobody gets an
error. pydantic-ai#6613
is the canonical case: tool-result _meta discarded, read_resource() losing
the text/html;profile=mcp-app mimeType and the resource _meta that carries
sandbox security policies, and the extensions capability field dropped so
io.modelcontextprotocol/ui support can never be advertised. The reporter had
to derive all of that by hand; this mode prints the verdict in one run.
Use it as a control when your own server renders everywhere except one
host. The fixture is a server you did not write and whose conformance is
asserted by this repo's own suite, so pointing the suspect host at it
separates the two explanations that otherwise look identical from the server
side. If the fixture's app renders, the host works and the difference is in
your server. If it does not, you have a reproduction that no longer depends on
your code, and check 2 answers the question the server side cannot see at all:
whether the host ever issued resources/read.
npx mcp-app-debug host              # fixture serves http://localhost:3111/mcp
npx mcp-app-debug host --json       # CI verdict as one JSON object
npx mcp-app-debug host --stdio      # for hosts that spawn a server command
mcp-app-debug becomes a conformant MCP Apps server (both protocol
revisions, io.modelcontextprotocol/ui advertised on both) and grades
whoever connects. Point the host you want to test at the printed URL and ask
it to run the probe tool. The probe app that renders inside the host
self-reports what it received; the fixture combines that with what it saw on
the wire into 7 checks, each PASS / FAIL / INCONCLUSIVE — never a guess:
- client-advertises-ui — the client's capabilities contain
io.modelcontextprotocol/ui(2025-11-25:initializeparams.capabilities.extensions; 2026-07-28: theio.modelcontextprotocol/clientCapabilities_metaenvelope). FAIL is the pydantic-ai#6613 capabilities defect verbatim. - ui-resource-read — a
resources/readfor the declaredui://URI arrived. - app-mounted — the probe app's beacon arrived at all. If check 2 passed
and this fails, the host most likely dropped the
text/html;profile=mcp-appmimeType or refused to mount the iframe. - ui-initialize-answered — the host answered the app's
ui/initializewith a result (self-reported, with latency). An error reply is a FAIL naming the code and message, not an answer. - tool-result-meta-preserved — the planted
_meta.ui.probeToken(a random hex string minted per run) reached the app inside thetool-resultpayload. FAIL is the_map_mcp_tool_resultdefect. - app-call-relayed — the
reportcall itself proves the host relays app→servertools/call. It is a precondition of checks 4 and 5, so when it fails and the direct beacon brought no data either, those two report INCONCLUSIVE, never FAIL. - sandbox-origin-and-csp — the app runs on a distinct sandbox origin
(
window.topunreachable) and nosecuritypolicyviolationfired.
The log also calls out one thing that is not a check, because it is a trap
rather than a defect: when the MCP-Protocol-Version HTTP header and the
initialize body name different revisions, the fixture says so. Claude does
exactly this (header 2026-07-28, body 2025-11-25), so a server that logs
only one of the two concludes the wrong thing about what was negotiated.
A host that drops capabilities.extensions and strips tool-result _meta
(reproduce it with node test/fake-host.mjs <url> --drop) gets:
{"mode":"host","fixture":"http://localhost:3111/mcp","passed":5,"failed":2,"inconclusive":0,"checks":[
 {"id":"client-advertises-ui","verdict":"fail","pass":false,"detail":"client capabilities carried no extensions map; io.modelcontextprotocol/ui was never advertised (pydantic-ai#6613 shape)"},
 {"id":"ui-resource-read","verdict":"pass","pass":true,"detail":"resources/read ui://mcp-app-debug/probe.html at +16 ms"},
 {"id":"app-mounted","verdict":"pass","pass":true,"detail":"beacon received at +168 ms (via direct beacon)"},
 {"id":"ui-initialize-answered","verdict":"pass","pass":true,"detail":"answered in 1 ms"},
 {"id":"tool-result-meta-preserved","verdict":"fail","pass":false,"detail":"planted _meta.ui.probeToken ff90… did not reach the app; the host dropped tool-result _meta"},
 {"id":"app-call-relayed","verdict":"pass","pass":true,"detail":"1 app-initiated tools/call"},
 {"id":"sandbox-origin-and-csp","verdict":"pass","pass":true,"detail":"origin http://127.0.0.1:64822; no violations"}]}
and exit code 1 (title fields elided here for width). A fully conformant
host goes 7/7 with exit 0 — scan mode itself is one: mcp-app-debug host in
one terminal and mcp-app-debug http://localhost:3111/mcp in another go 7/7
in both directions, and the test suite asserts exactly that.
Behaviour at the edges: if no client connects within --window (default
120 s in host mode) the run exits 2 with "no client connected" — never a fake
FAIL. A host that connects and lists tools but never calls probe gets
checks 2-7 INCONCLUSIVE ("the host never called the tool — ask it to run
probe") and exit 0. Text mode prints checks as they resolve and keeps
serving until the window ends or Ctrl-C; --json prints a single final
object, no interactive output, and ends early once every check resolves. In
--stdio mode the verdict prints on stderr (stdout is the transport).
What this can and cannot see. Host mode observes only what the host does
on the wire plus what the probe app can self-report from inside the sandbox.
It cannot inspect the host's code, and a failing check means a field did not
arrive, not that a specific function is at fault. It does not claim to
verify SEP-1865 host compliance — it claims exactly the seven observations
above. A host that reads the resource over a transport the fixture cannot see
(native or in-process, without touching the fixture's endpoint) is out of
scope. For context: the official ext-apps debug-server example is a manual
dashboard with no verdict, and MCPJam Inspector's Apps Conformance SDK —
per its own docs — "currently validates the server-side MCP Apps surface
only. It does not prove full host-side SEP-1865 behavior such as
ui/initialize, sandbox-proxy forwarding, or host notification ordering."
Host mode exists to cover that other end.
Host-mode options:
--port <n>           fixture port, Streamable HTTP at /mcp   (default: 3111)
--stdio              serve the fixture over stdio (verdict on stderr)
--window <seconds>   how long to wait for the host           (default: 120)
--json               CI mode: one JSON report on stdout, ends early
CI usage
npx mcp-app-debug http://localhost:3001/mcp --json | jq .Prints one compact JSON object (passed, failed, checks[] with id,
title, pass, detail, ms) on stdout and exits 1 if any check failed.
--json implies headless. Runs end early once all checks have passed and
stayed passed for 2 s (pass --full-window to always wait the whole window).
Exit codes: 0 all checks passed · 1 one or more checks failed ·
2 operational error (bad arguments, connection failed, browser failed).
Under --profile the exit code follows the verdict: 1 for APP-FAULT, and
1 for APP-OK-HOST-SUSPECT when the failing check is blocking (check 12).
See the verdict table.
For CI artifacts, --log-file debug.ndjson writes every protocol log entry
as NDJSON (final line is the check report) and --video session.webm
records the debug window — attach either to a bug report.
Protocol support
The 2026-07-28 MCP revision
removed the initialize handshake entirely: servers are stateless, advertise
themselves via the new server/discover RPC, and expect every request to
carry its protocol version and client capabilities in _meta (plus
Mcp-Method/Mcp-Name headers on Streamable HTTP POSTs). mcp-app-debug
speaks both this and the 2025-11-25 revision:
auto (default) —
server/discoveris probed first (the spec sanctions it as a backward-compatibility probe). A definitive answer selects the stateless 2026-07-28 path;-32601/legacy-shaped signals fall back to theinitializehandshake. On stdio the probe is time-boxed at 5 s so a server that crashes on unknown pre-initialize requests is treated as legacy — the log says so when that happens.--protocol 2026-07-28/--protocol 2025-11-25— force a revision. If the server does not support the forced revision, the run exits2with a message naming what the server actually offers.Half-migrated servers — a server that rejects both
initializeandserver/discoverbut answers stateless 2026-07-28 requests still gets debugged (the harness connects via a synthetic era verdict); check 7 then FAILs, becauseserver/discoveris a MUST:FAIL protocol revision server claims 2026-07-28 (stateless requests succeed) but server/discover returned -32601 Method not found — the 2026-07-28 revision makes server/discover a MUST
On the stateless path every request carries the documented _meta envelope
(io.modelcontextprotocol/protocolVersion, …/clientCapabilities advertising
the io.modelcontextprotocol/ui extension with
mimeTypes: ["text/html;profile=mcp-app"], …/clientInfo), results missing
resultType are treated as "complete" per spec, and a server/discover
result missing the required ttlMs/cacheScope fields is surfaced in check
7's detail rather than crashing the run. Everything downstream of the
connection — App Bridge, sandbox, CSP construction — is identical on both
paths (@modelcontextprotocol/ext-apps is unchanged by the revision).
Reproducing restrictive-host failures (--mode)
npx mcp-app-debug http://localhost:3001/mcp --mode strict # or: --mode 3pstrict runs the host with no optional capabilities (empty
hostCapabilities in the ui/initialize response, no
tools/resources/openLinks/message handlers). Apps that assume a full-featured
host fail here the same way they fail in restrictive clients — you'll see your
app's tools/call rejected with -32601 Method not found in the log while
everything else looks healthy.
Honesty note: the
deploymentMode: '3p'setting circulating in some issue threads does not exist in@modelcontextprotocol/ext-apps(verified against v1.7.4, including the generated protocol schema).--mode 3pis accepted as an alias ofstrictand says so in the output.
All options
--stdio              target is a stdio server command (write it after --)
--header <n:v>       extra HTTP header, repeatable ("Authorization: Bearer …")
--protocol <rev>     auto | 2026-07-28 | 2025-11-25   (default: auto)
--profile <name>     spec | claude-desktop | claude-web | chatgpt | grok | all
                     (or a path to your own descriptor .json) — adds checks
                     8-10 and the fault verdict; omit for the 7-check run
--aggregator [pfx]   simulate a namespacing aggregator: advertise every tool as
                     "<prefix><name>" and answer -32043 for the bare name —
                     adds check 11        (default prefix: alpha__)
--tool <name>        tool to render (default: first tool with _meta.ui.resourceUri)
--args <json>        tool arguments (default: inputSchema defaults)
--mode <mode>        trusted | strict | 3p            (default: trusted)
--timeout <seconds>  observation window                (default: 10)
--full-window        wait the whole window even after all checks pass
--json               CI mode: JSON on stdout, exit 1 on failure
--headless           headless browser; --headed forces a window
--click <text>       button text to click inside the app
--no-interact        don't auto-click anything
--screenshot <path>  save a PNG of the debug window
--video <path>       record the session to a .webm file
--log-file <path>    write the protocol log as NDJSON (last line = report)
Test fixtures
test/broken-server.mjs ships 9 scenarios (ok, bad-uri, bad-mime,
no-ready, slow-init, tool-error, csp-meta, ext-img, bad-domain)
reproducing the common silent-failure modes, servable over HTTP or stdio
(--stdio), with optional auth (AUTH_TOKEN=x demands a Bearer token).
With --stateless it serves the 2026-07-28 revision instead — a hand-rolled
stateless server implementing server/discover, rejecting initialize and
stamping resultType/ttlMs/cacheScope — including two revision-specific
scenarios, discover-missing and no-ui-extension. For host mode,
test/fake-host.mjs is a minimal conformant host (Playwright + the same
double-iframe sandbox files the package ships) with --drop (the
pydantic-ai#6613 shape: no capabilities.extensions, tool-result _meta
stripped) and --list-only modes.
For profile and aggregator mode, test/profile-server.mjs ships fourteen
scenarios (HTTP or --stdio): weather (an argument-sensitive tool, so
checks 8-10 all resolve), first-only (the varied second call errors — check
8 FAILs), leak (a view that broadcasts its tool-result to sibling instances
through a shared storage key — check 9 FAILs), popup (a view that calls
window.open on load), noargs (nothing to vary — check 8 must SKIP, not
fail), singleton (the ui:// resource can only be read once — check 9 must
SKIP), bare-names (the ext-apps#753 shape, the tool name written into the
bundle — check 11 FAILs under --aggregator), resolved-names (#753's
resolveToolName() reading hostContext.toolInfo.tool.name — check 11 PASSes
either way), listed-names (the same job done with a tools/list through the
bridge, #745's other correct route) and namespaced (a tool already called
alpha__forecast upstream, which must not be prefixed twice), csp-origins
(a resource declaring one resourceDomains and one connectDomains origin,
so check 12 PASSes under spec and FAILs under claude-web), csp-wildcard
(a wildcard, a duplicate and a schemeless host in one list), csp-paths (one
entry a path prefix, one naming an exact file), csp-self-asset (an app
that really loads an image from the one origin it declared, served by the
fixture itself, so under claude-web check 2 FAILs on the app's own asset
while check 12 FAILs on the probe) and csp-unmatchable (a declared entry
carrying userinfo, which Chromium parses and then matches against nothing, so
check 12 FAILs under spec and blames the app). test/profiles/ holds descriptor
fixtures, including one with sources: [] that must be refused at load, one
that claims popupsAllowed while withholding the allow-popups token (check
10 must catch it and blame the sandbox) and one that sets toolNameRewrite.
test/checks-unit.ts asserts the checks 8-12 decision logic, the CSP probe
planner and the aggregator name mapping directly, for the branches a real
browser cannot force reliably — a browser-level popup block as opposed to a
sandbox-level one, a
second instance that mounts but never completes its handshake, a bare name
among otherwise correct calls. Those are exactly the branches whose wording a
user acts on, so they are tested rather than left unexecuted.
npm test asserts every scenario trips exactly the right checks on its
revision (the shared scenarios trip identical check ids on both), plus
strict-mode, stdio (both revisions), forced---protocol, seven host-mode cases,
twenty profile cases — a --profile all matrix snapshot, both honest SKIPs,
profile-over-stdio, per-profile artifact suffixing, and seven check-12 cases
covering a reachable declaration, the same one blocked under claude-web, a
wildcard, a path prefix, a same-origin asset the app really loads (run under
both profiles, so the probe is proven not to contaminate check 2) and a
declaration no browser can match, which fails under spec and blames the app
— and nine aggregator cases. It prints 59 ok lines: 58 scenario assertions plus one for the 72 unit
assertions in test/checks-unit.ts. All green in CI on Linux and Windows.
Architecture
- Node CLI (
src/cli.ts, commander) →src/host.tsPlaywright harness. - The MCP client lives in Node, so server CORS never causes false
negatives; the page reaches it through a Playwright binding. Connections
are negotiated in
src/mcp/negotiate.tsand served through one era-agnostic interface (McpConn,src/mcp/connect.ts) with two implementations:@modelcontextprotocol/sdkv1 for 2025-11-25 (Streamable HTTP with SSE fallback, or stdio) and@modelcontextprotocol/clientv2 for stateless 2026-07-28. - The page (
src/web/host-page.ts) runs the official@modelcontextprotocol/ext-appsAppBridge in manual-handler mode with a logging transport wrapped aroundPostMessageTransport. - The sandbox (
src/web/sandbox-page.ts) is a port of the official basic-host double-iframe sandbox, served on a separate origin with the CSP header built by the official policy logic, plus CSP-violation relay. A frame's sandbox flags are fixed when its browsing context is created, so when a profile overrides the tokens the inner iframe is replaced rather than mutated in place —setAttribute("sandbox", …)on a live frame is silently ignored. - Profiles (
src/profiles/) are plain JSON validated with zod at load time and shipped in the package;src/profile-run.tsruns the scan once per descriptor and computes the verdict. --aggregatorlives in the connection layer (src/mcp/aggregator.ts), which wraps aMcpConnso the rewrite applies to everything downstream: the tool list the harness advertises,hostContext.toolInfo, the simulated model call and the app's owntools/call. A name it does not own is refused there, before the server sees it.
Development
npm install
npm run build        # esbuild: node CLI bundle + 2 browser bundles
npm run typecheck    # tsc, types only
node dist/cli.js <server-url>
npm test             # 58 scenario + 72 unit assertions, all must pass
A handy live target is the official example server:
npx @modelcontextprotocol/server-basic-react (serves on port 3001), then
node dist/cli.js http://localhost:3001/mcp.
Note for Windows tarball testing: give npx a relative path
(npx ./mcp-app-debug-0.1.0.tgz) — npx silently no-ops on absolute tarball
paths.
License
MIT